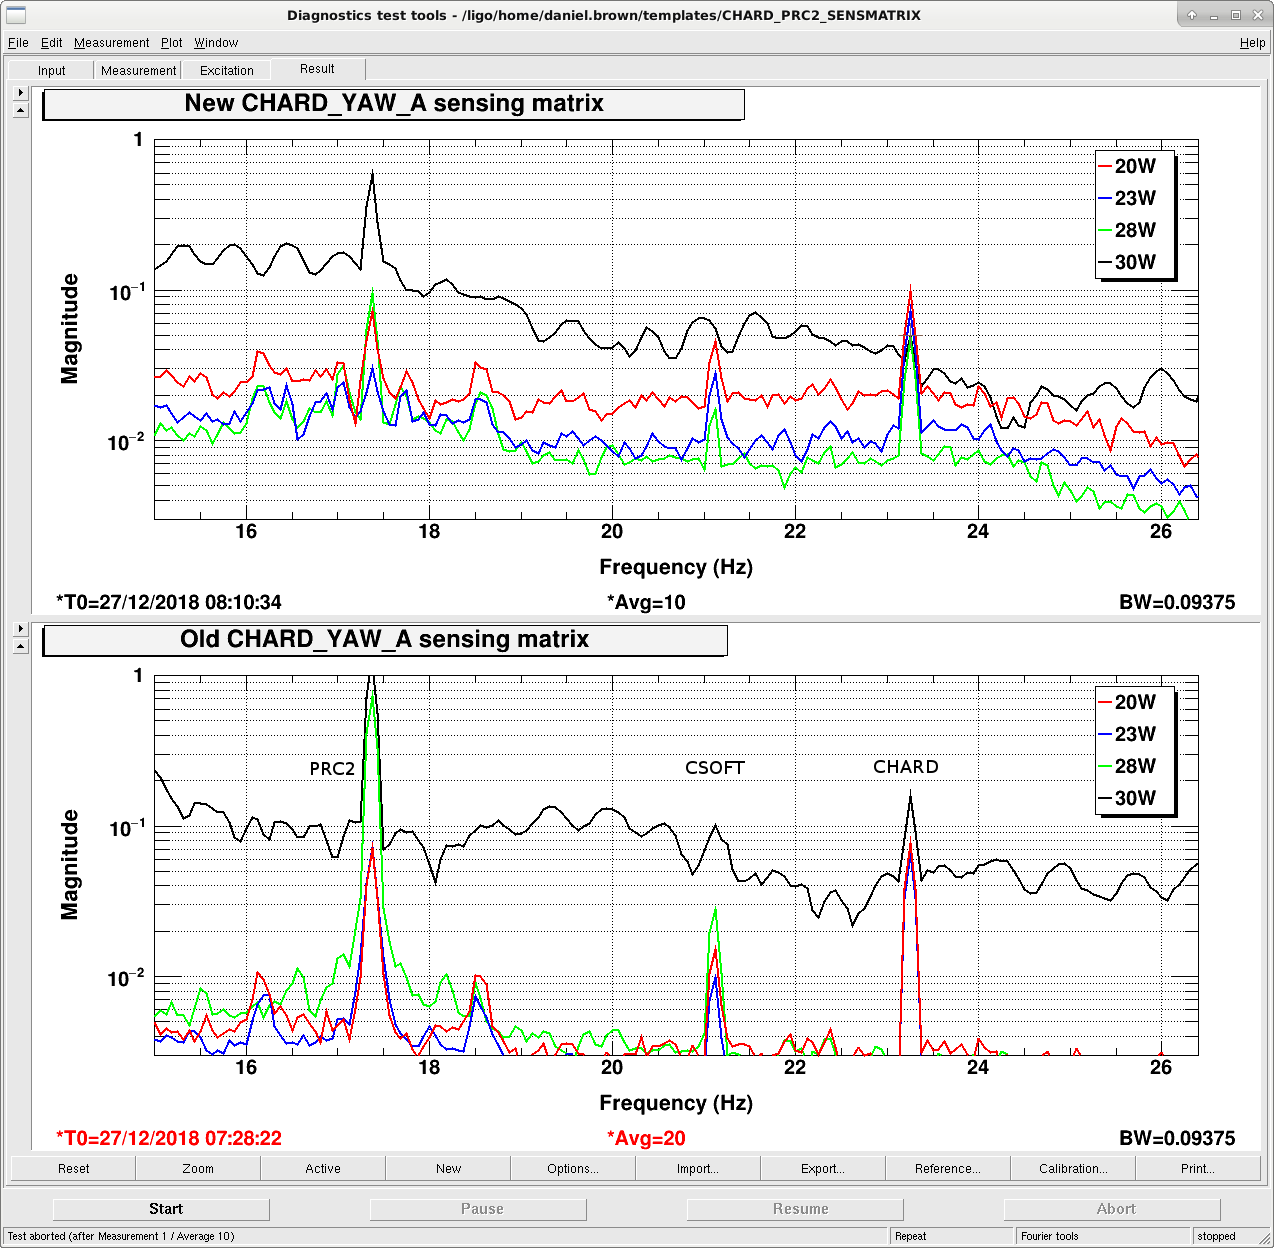
We tuned some dtt templates for radiation pressure compensation adjustments.
For DHARD PIT and CHARD YAW, the templates currently are at:
/ligo/home/hang.yu/Desktop/ASC/common/dtt/DHARD/data/DHARD_P_10W_HBW_ref.xml
/ligo/home/hang.yu/Desktop/ASC/common/dtt/CHARD/data/CHARD_Y_10W_HBW_ref.xml
Those were taken at the high ASC bandwidth configuration. For DHARD PIT the boost is on and CHARD YAW the boost is off. The excitations used are saved yet due to dtt's issue in ramping the gains, it might be better to send in the excitations through awggui. When do the tuning, one only needs to check the high freq part to make sure the secondary suspension resonance stayed at ~ 1.7 Hz for PIT and ~ 1.6 Hz for YAW.
For the CHARD_P and DHARD_Y, we don't have templates as detailed as the above ones (which covered from 0.5 to 3 Hz). However, one could use
/ligo/home/hang.yu/Desktop/ASC/common/dtt/DHARD/DHARD_OLG_Y_broadband.xml
/ligo/home/hang.yu/Desktop/ASC/common/dtt/CHARD/CHARD_OLG_P_broadband.xml
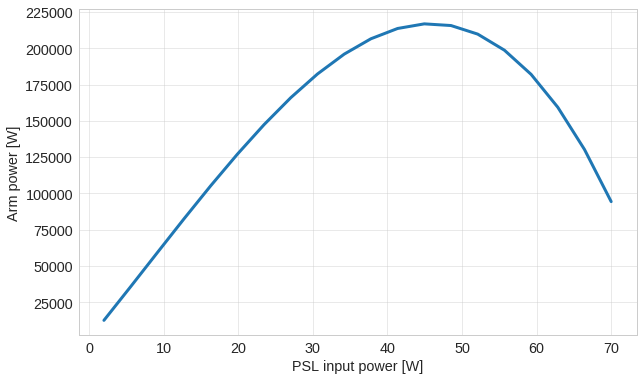
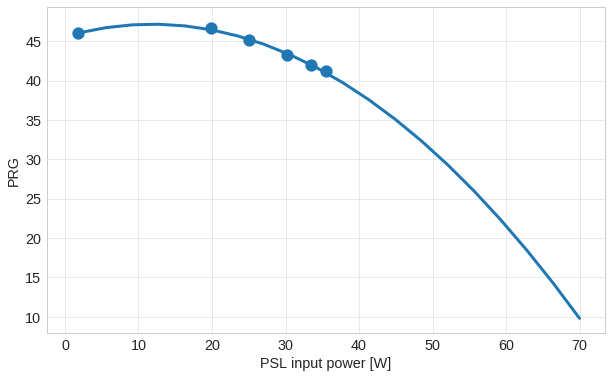
and again try to match the location of the secondary sus resonance. This would effectively reduce the plant back to the 10 W input level where most of our ASC loops were designed for.
==================================================
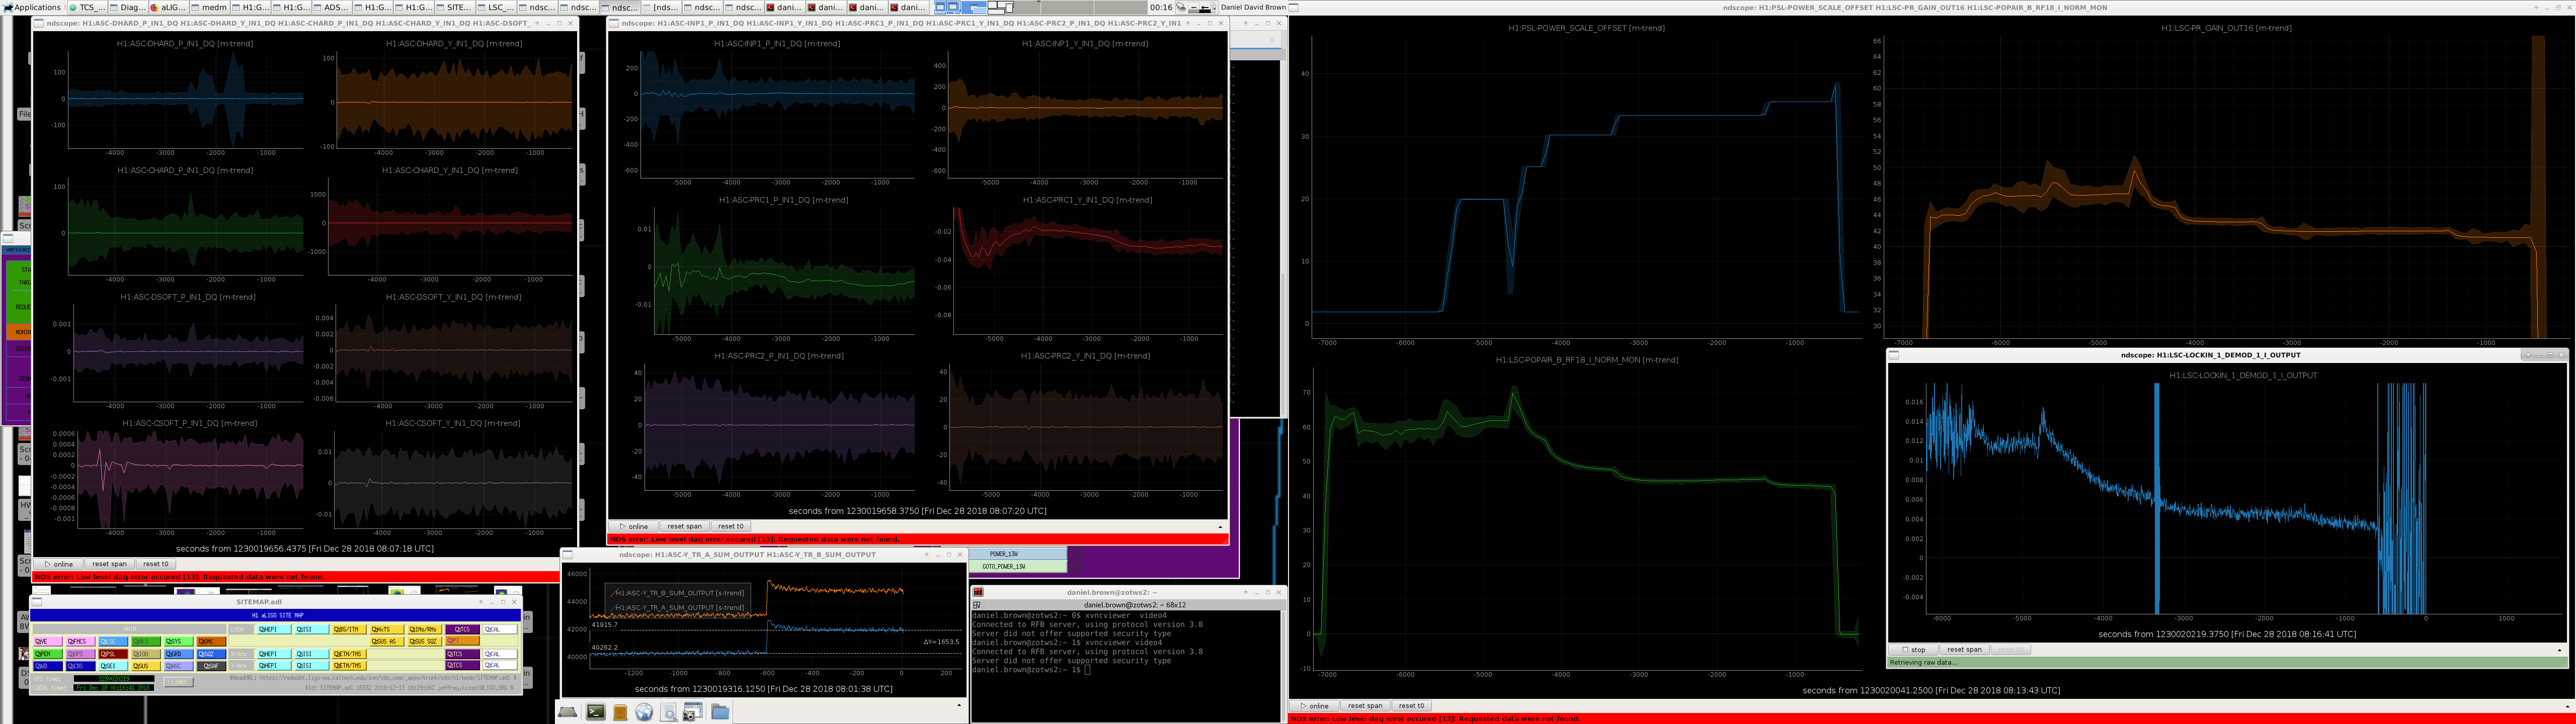
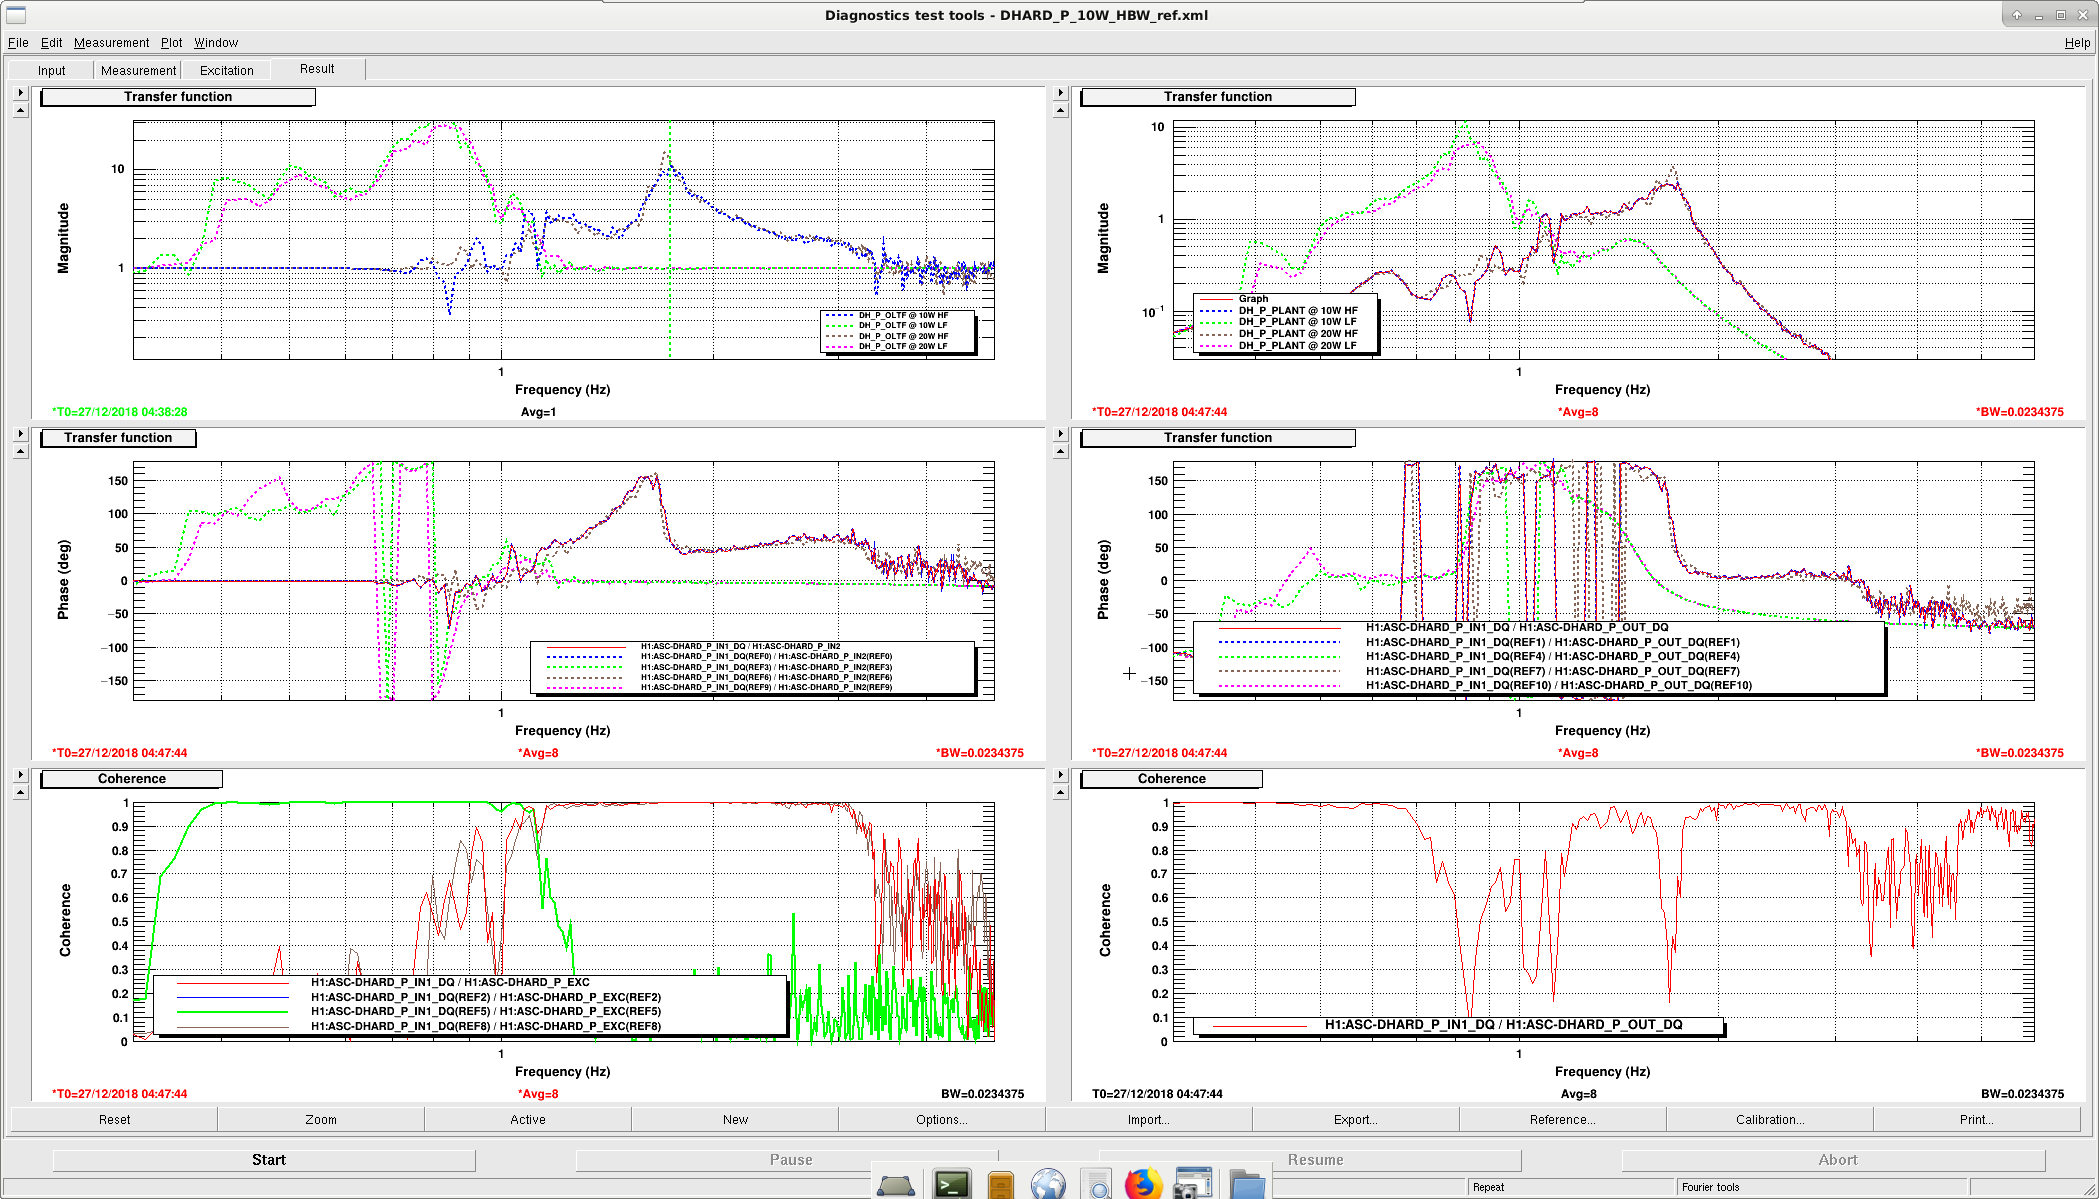
While taking the data for DHARD PIT in the 0.5-1 Hz band, we noticed the suspension plant seemed to be strange at around the main resonance at ~ 0.9 Hz. Specifically, if one focus on the middle-right panel and the green and pink traces, one would see that when the TF hits the main sus resonance, the phase instead of decreasing by 180 deg, it actually increased by 180 deg...
To see the issue more clearly, one could see DH_P_OLTF.pdf attached to this entry. Here the TF is calculated from <exc, in1>/<in2, exc>, where <> stands for taking the cross-spectrum, and therefore it should be an unbiased estimator. Again we saw a weird phase behavior around the main sus resonance at ~ 0.9 Hz, in both the 10 W data (without any RPC), and in the 20 W data after engaging the radiation pressure compensation path.


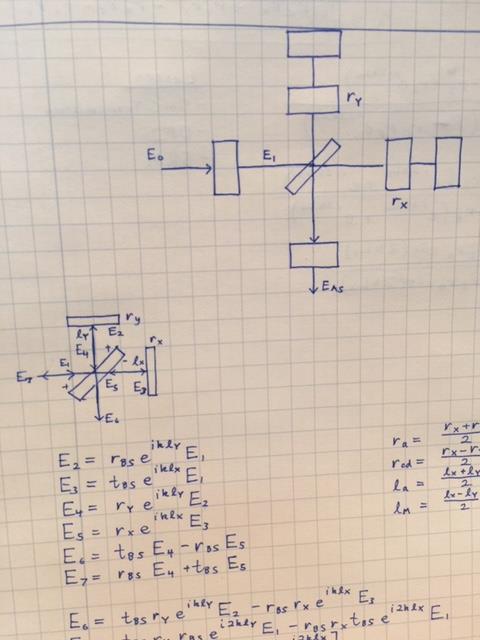
 The electric fields associated with this equation are shown in the fourth attachment.
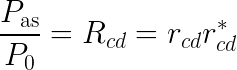
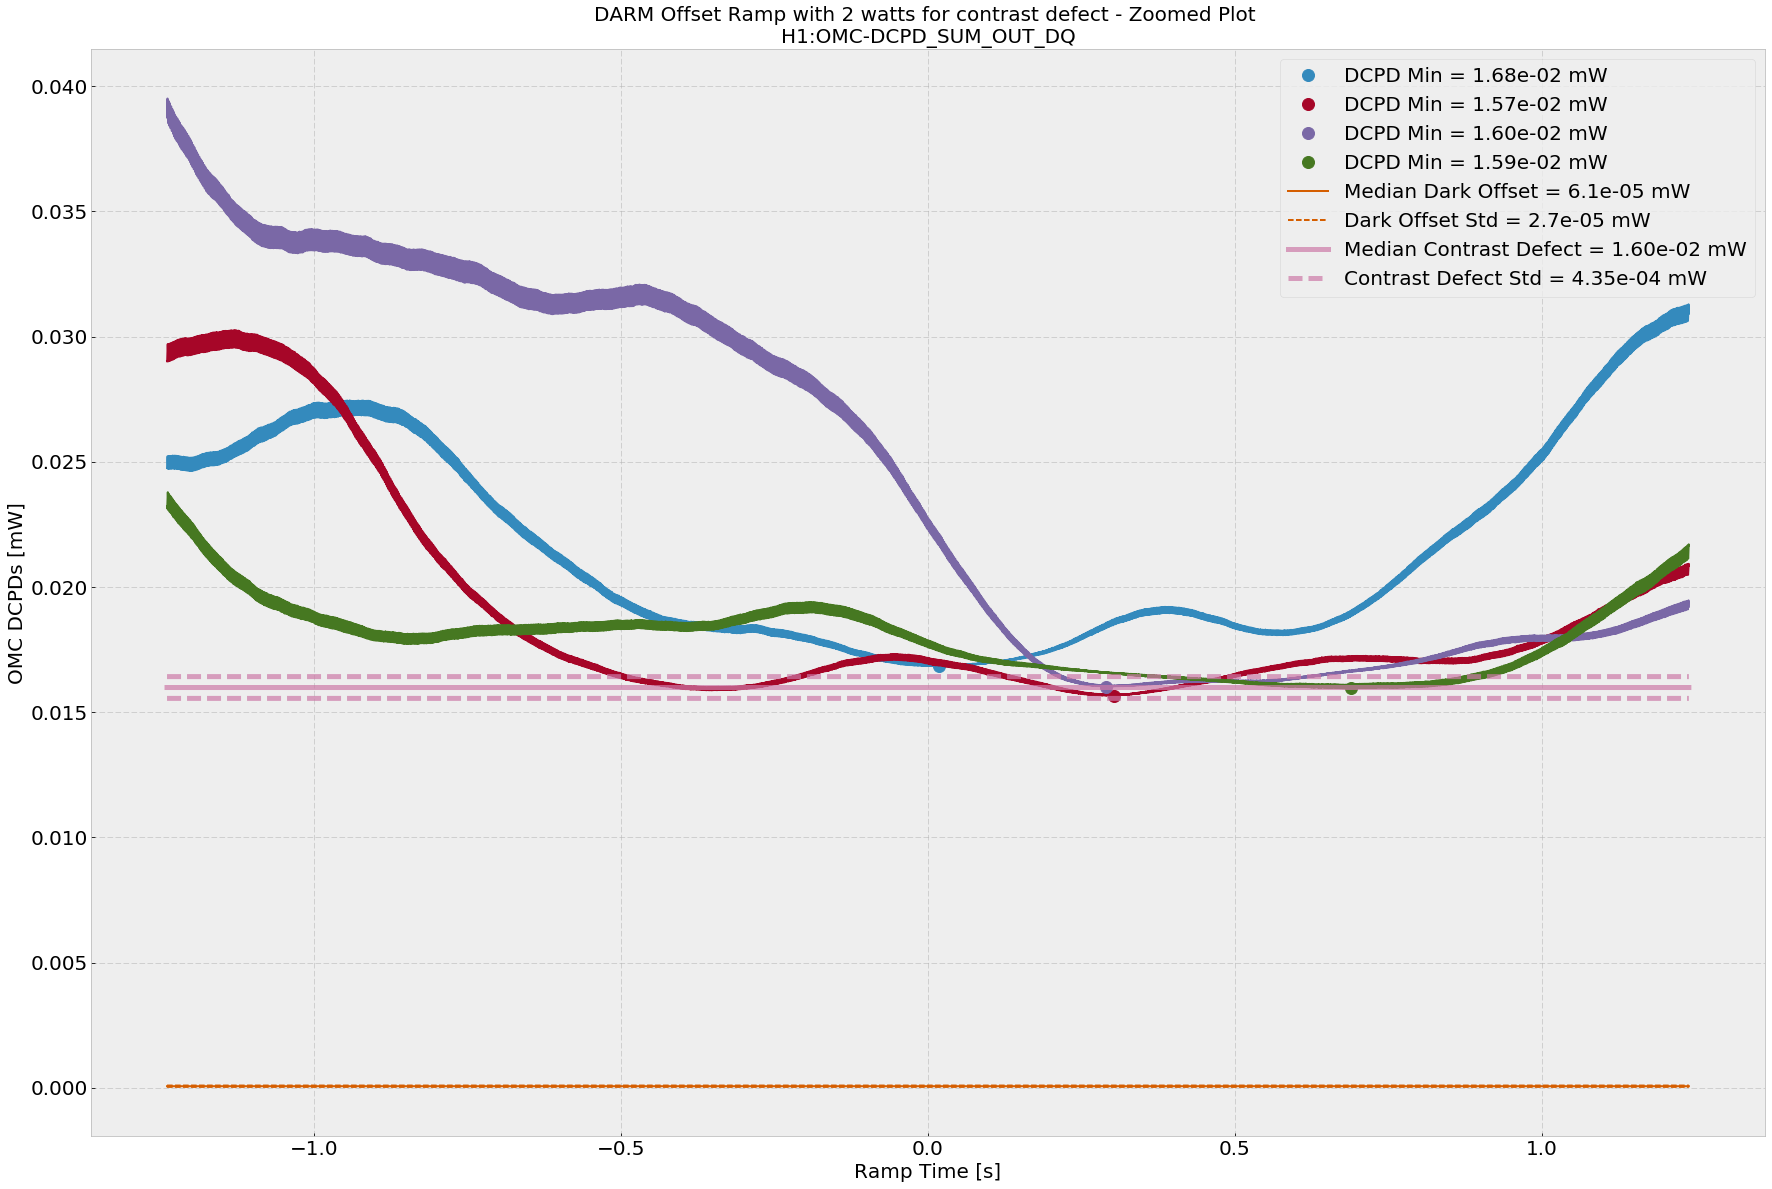
When DARM is locked on RF at 2 watts and the OMC is locked, we get about 11.8 mA, or 14.0 mW of power on the OMC DCDPs. This means the DARM offset is around 29 pm according to
The electric fields associated with this equation are shown in the fourth attachment.
When DARM is locked on RF at 2 watts and the OMC is locked, we get about 11.8 mA, or 14.0 mW of power on the OMC DCDPs. This means the DARM offset is around 29 pm according to 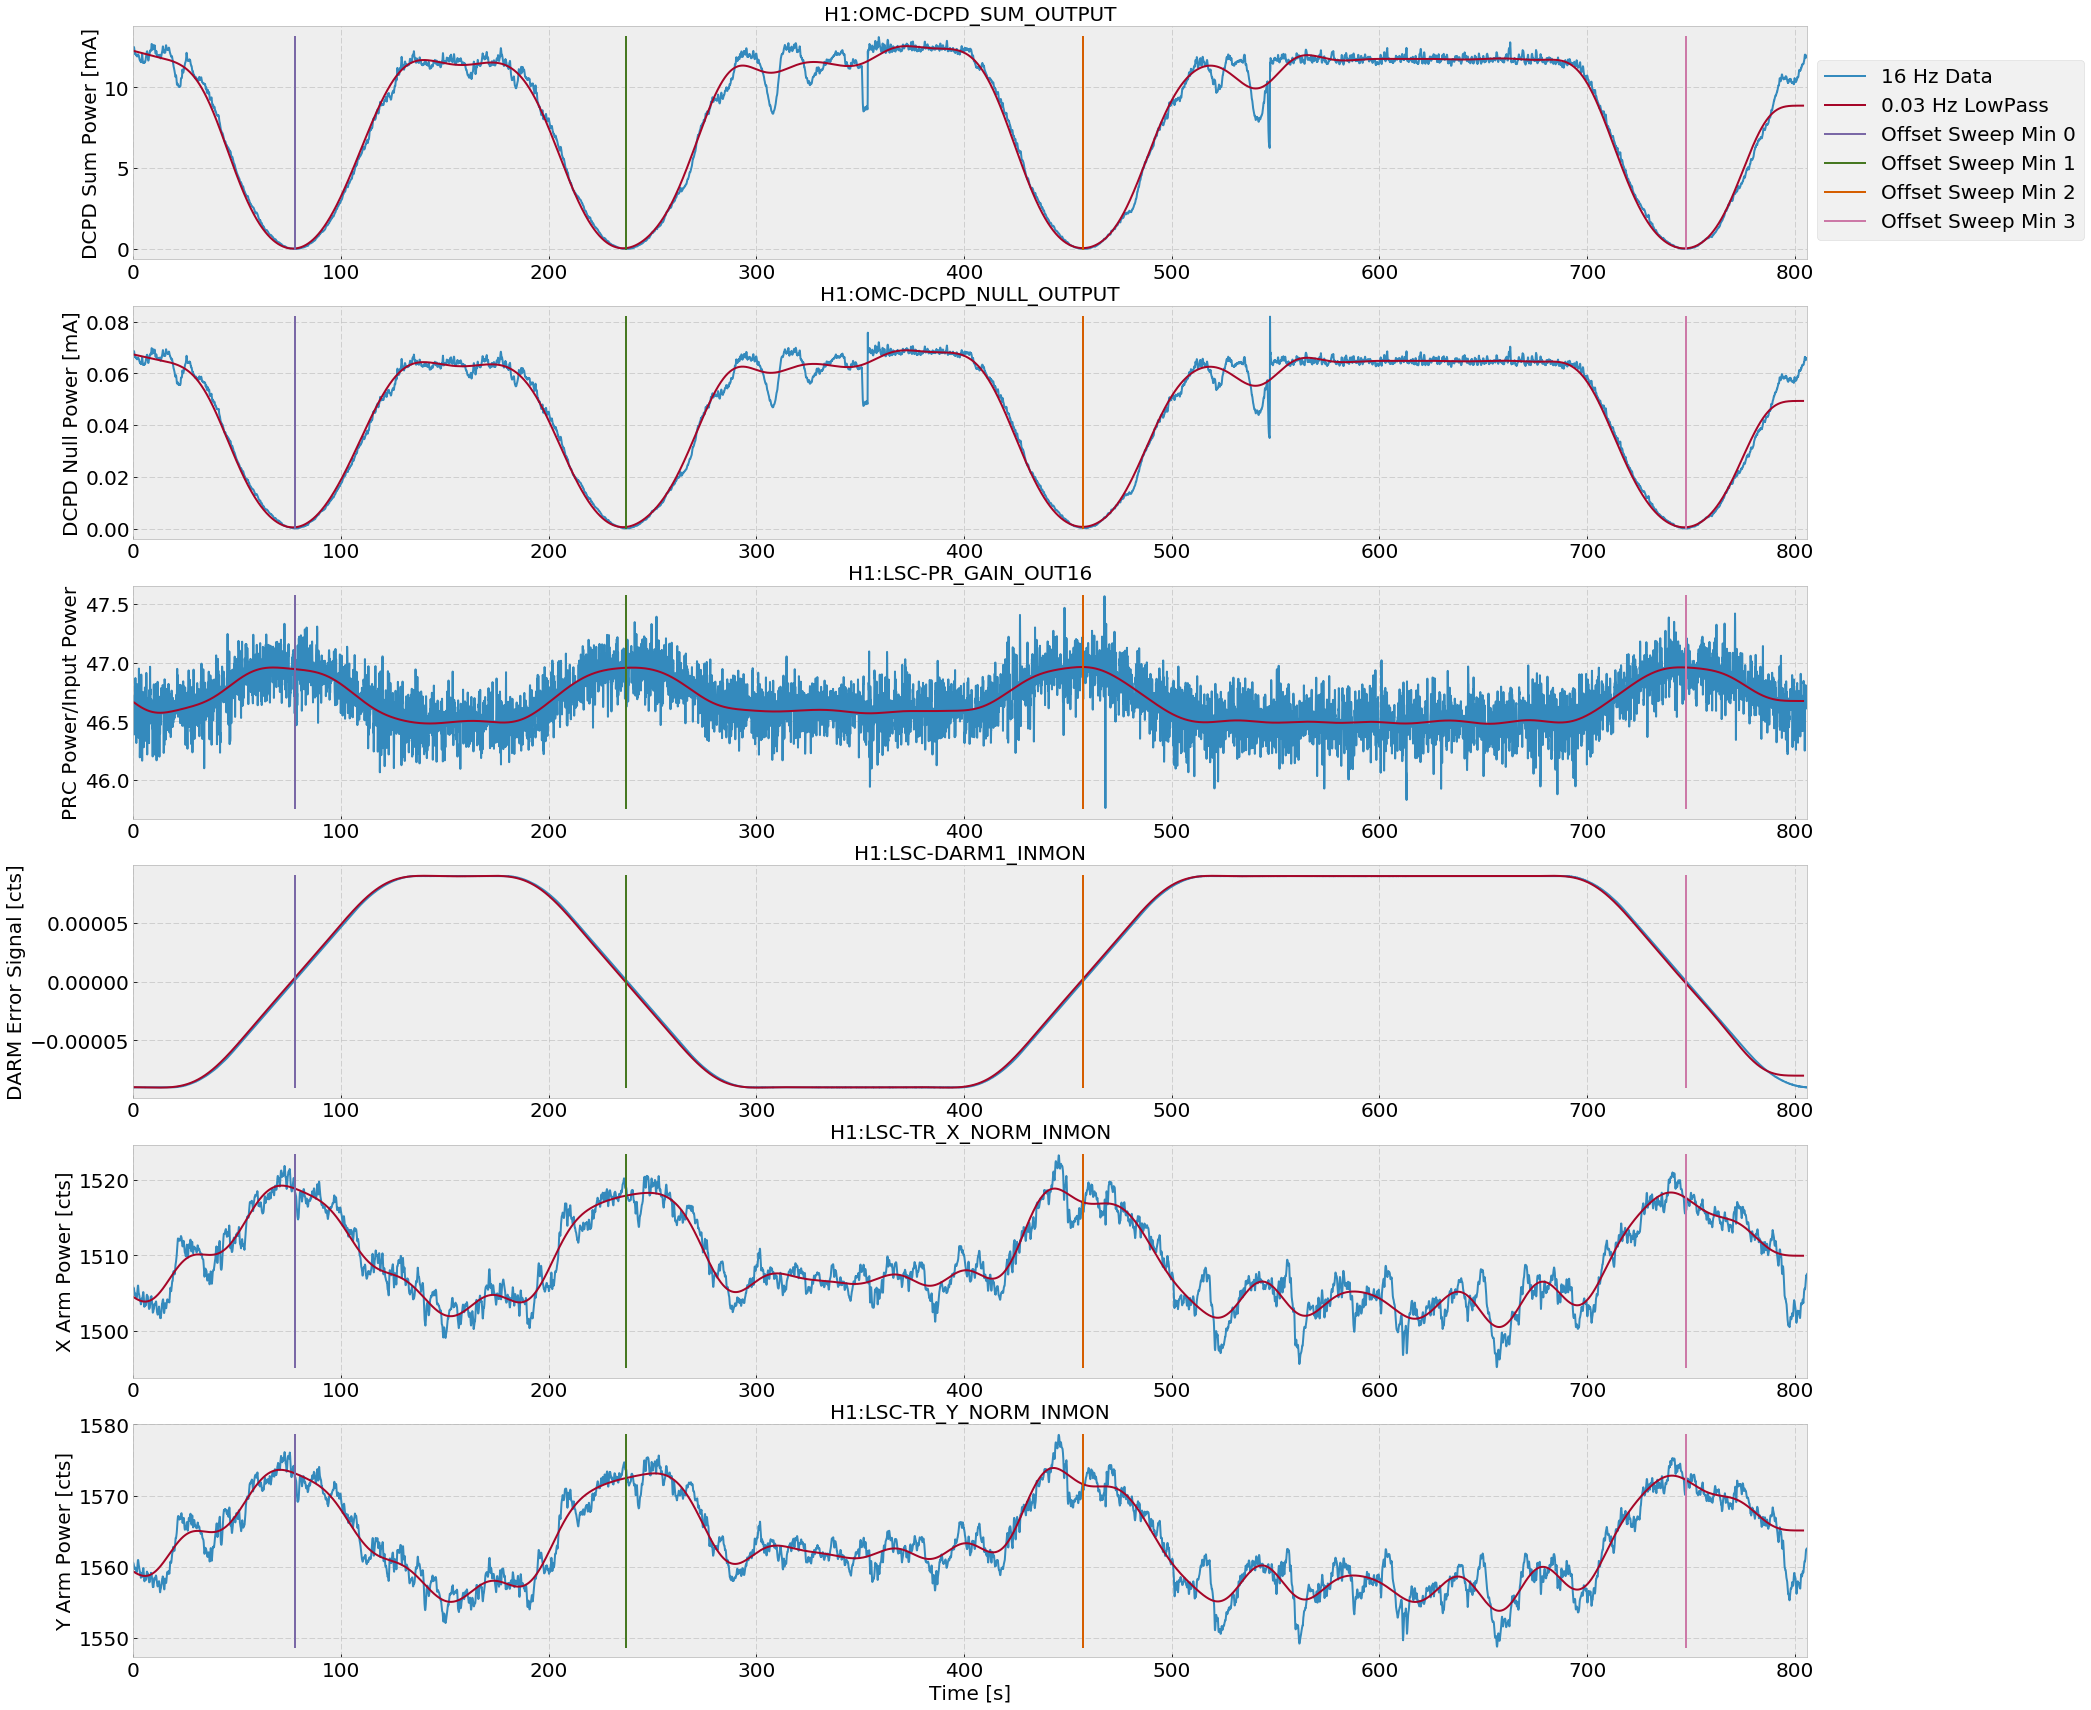