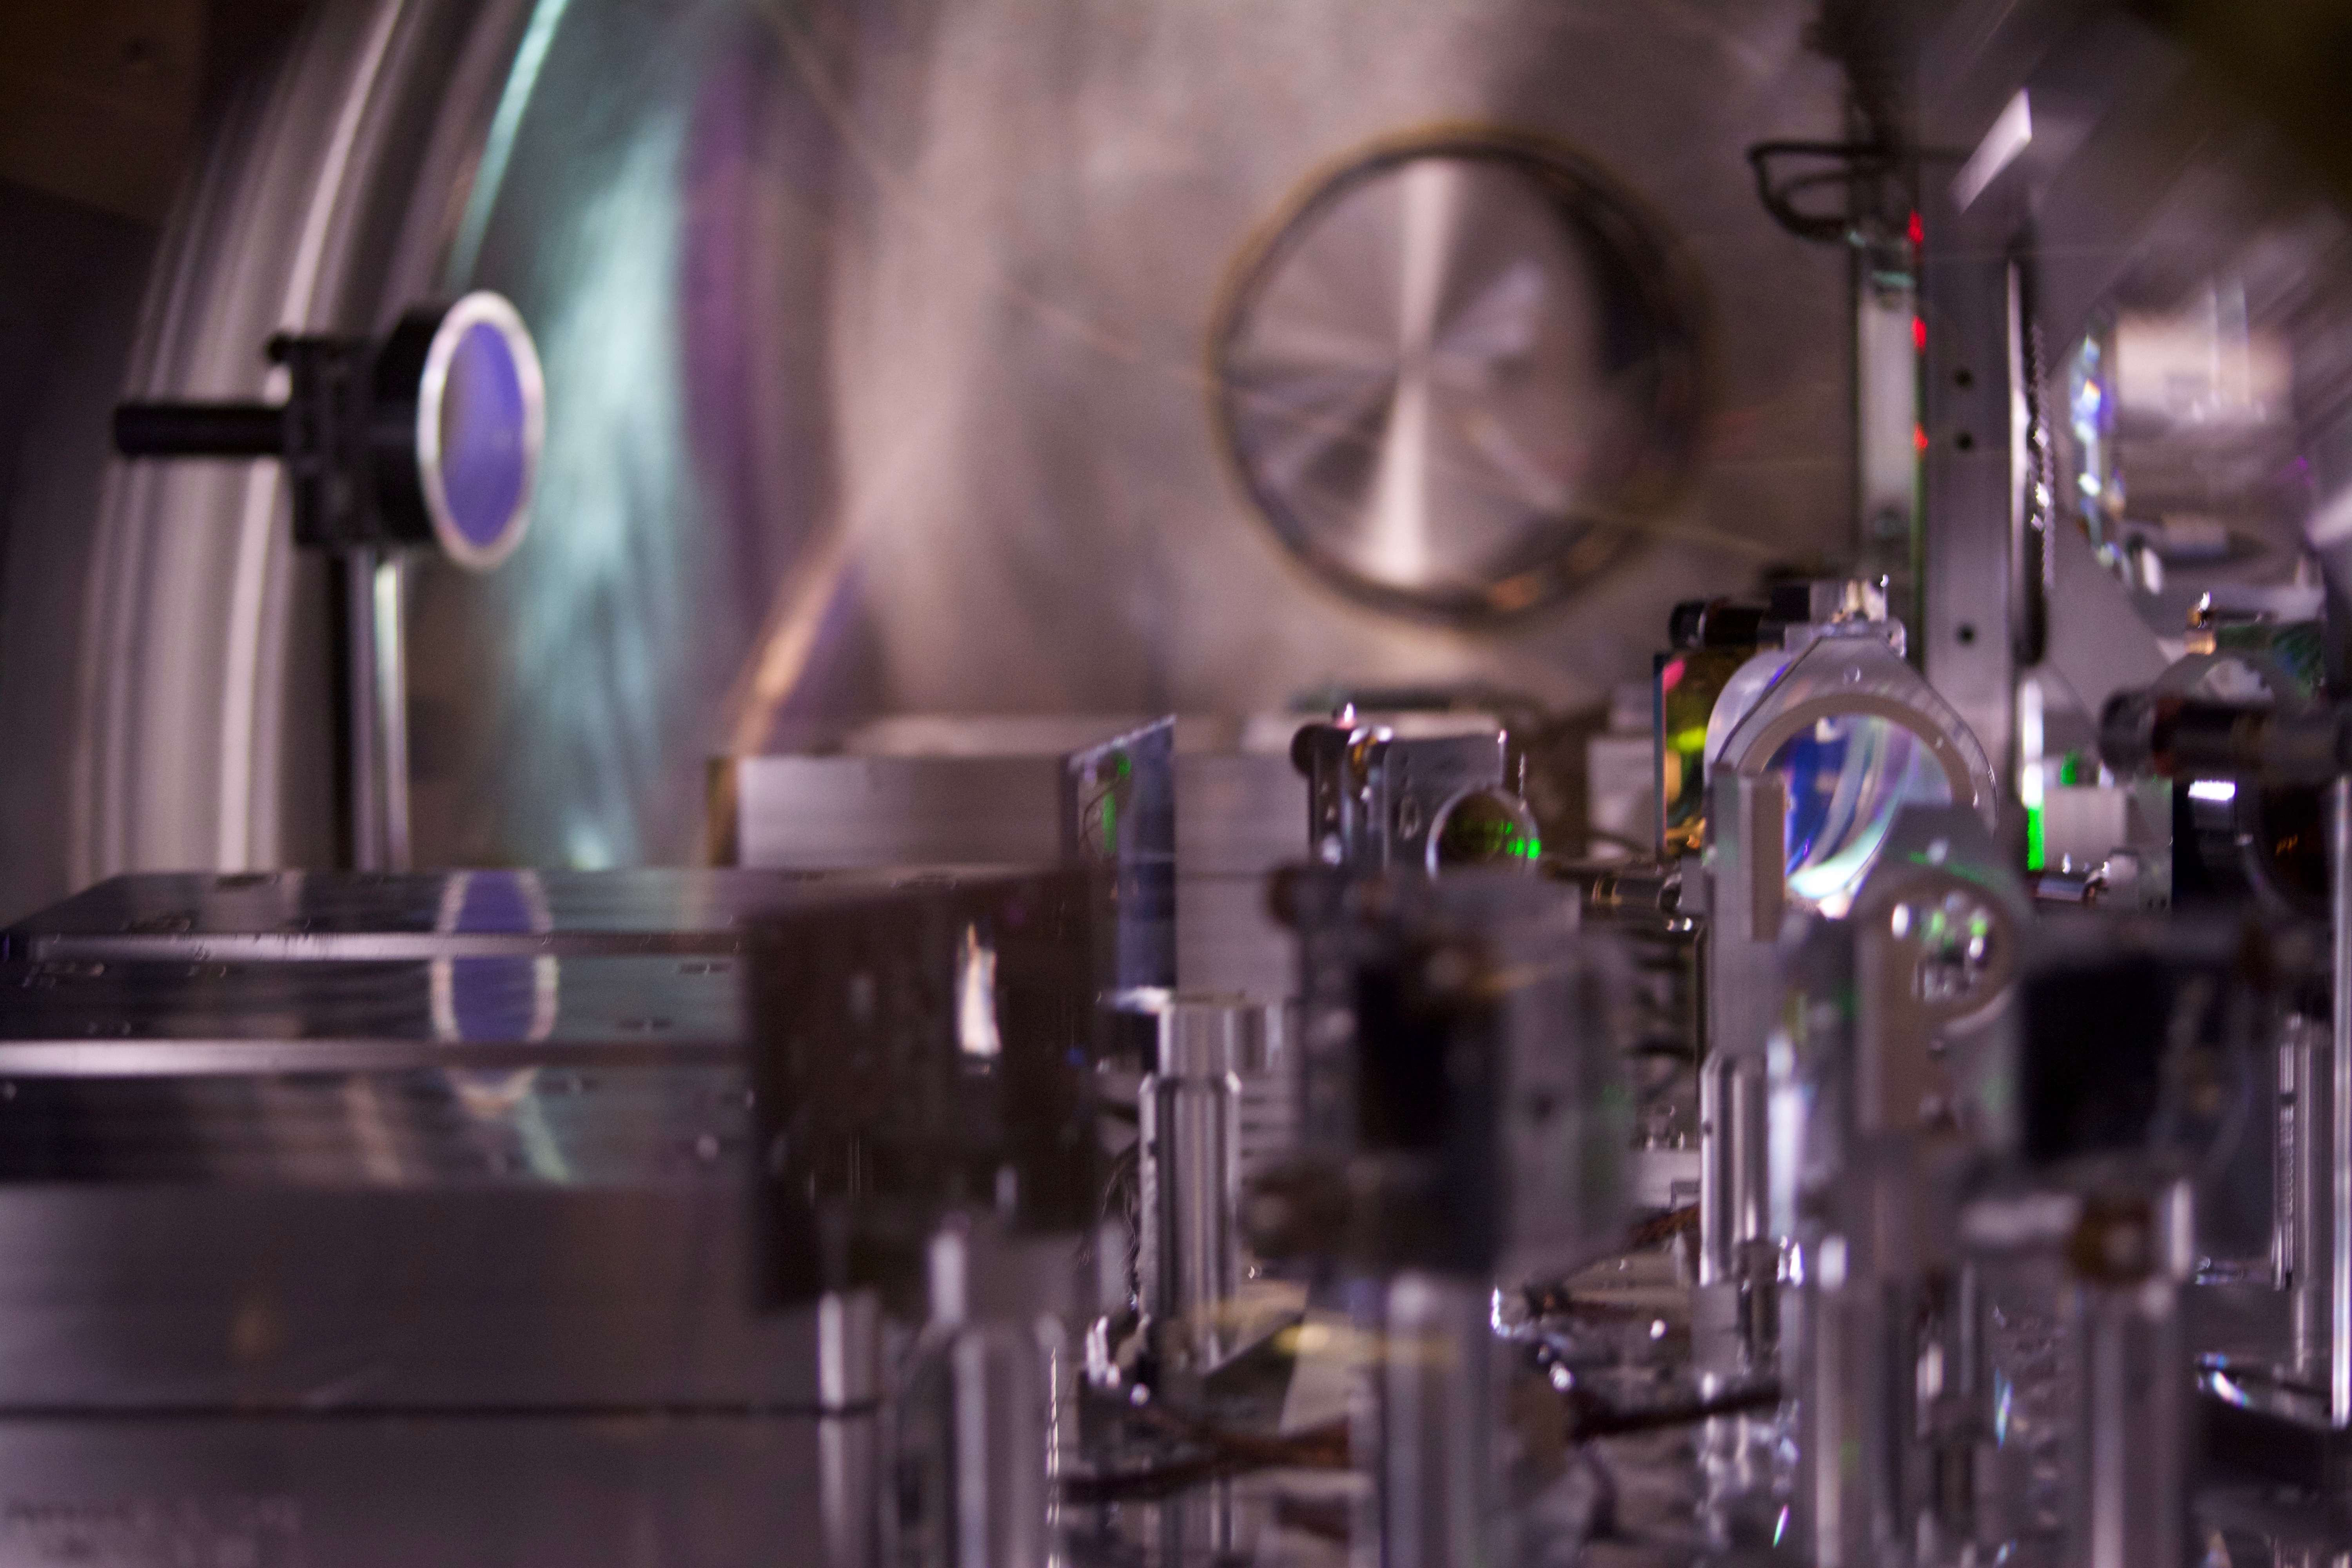
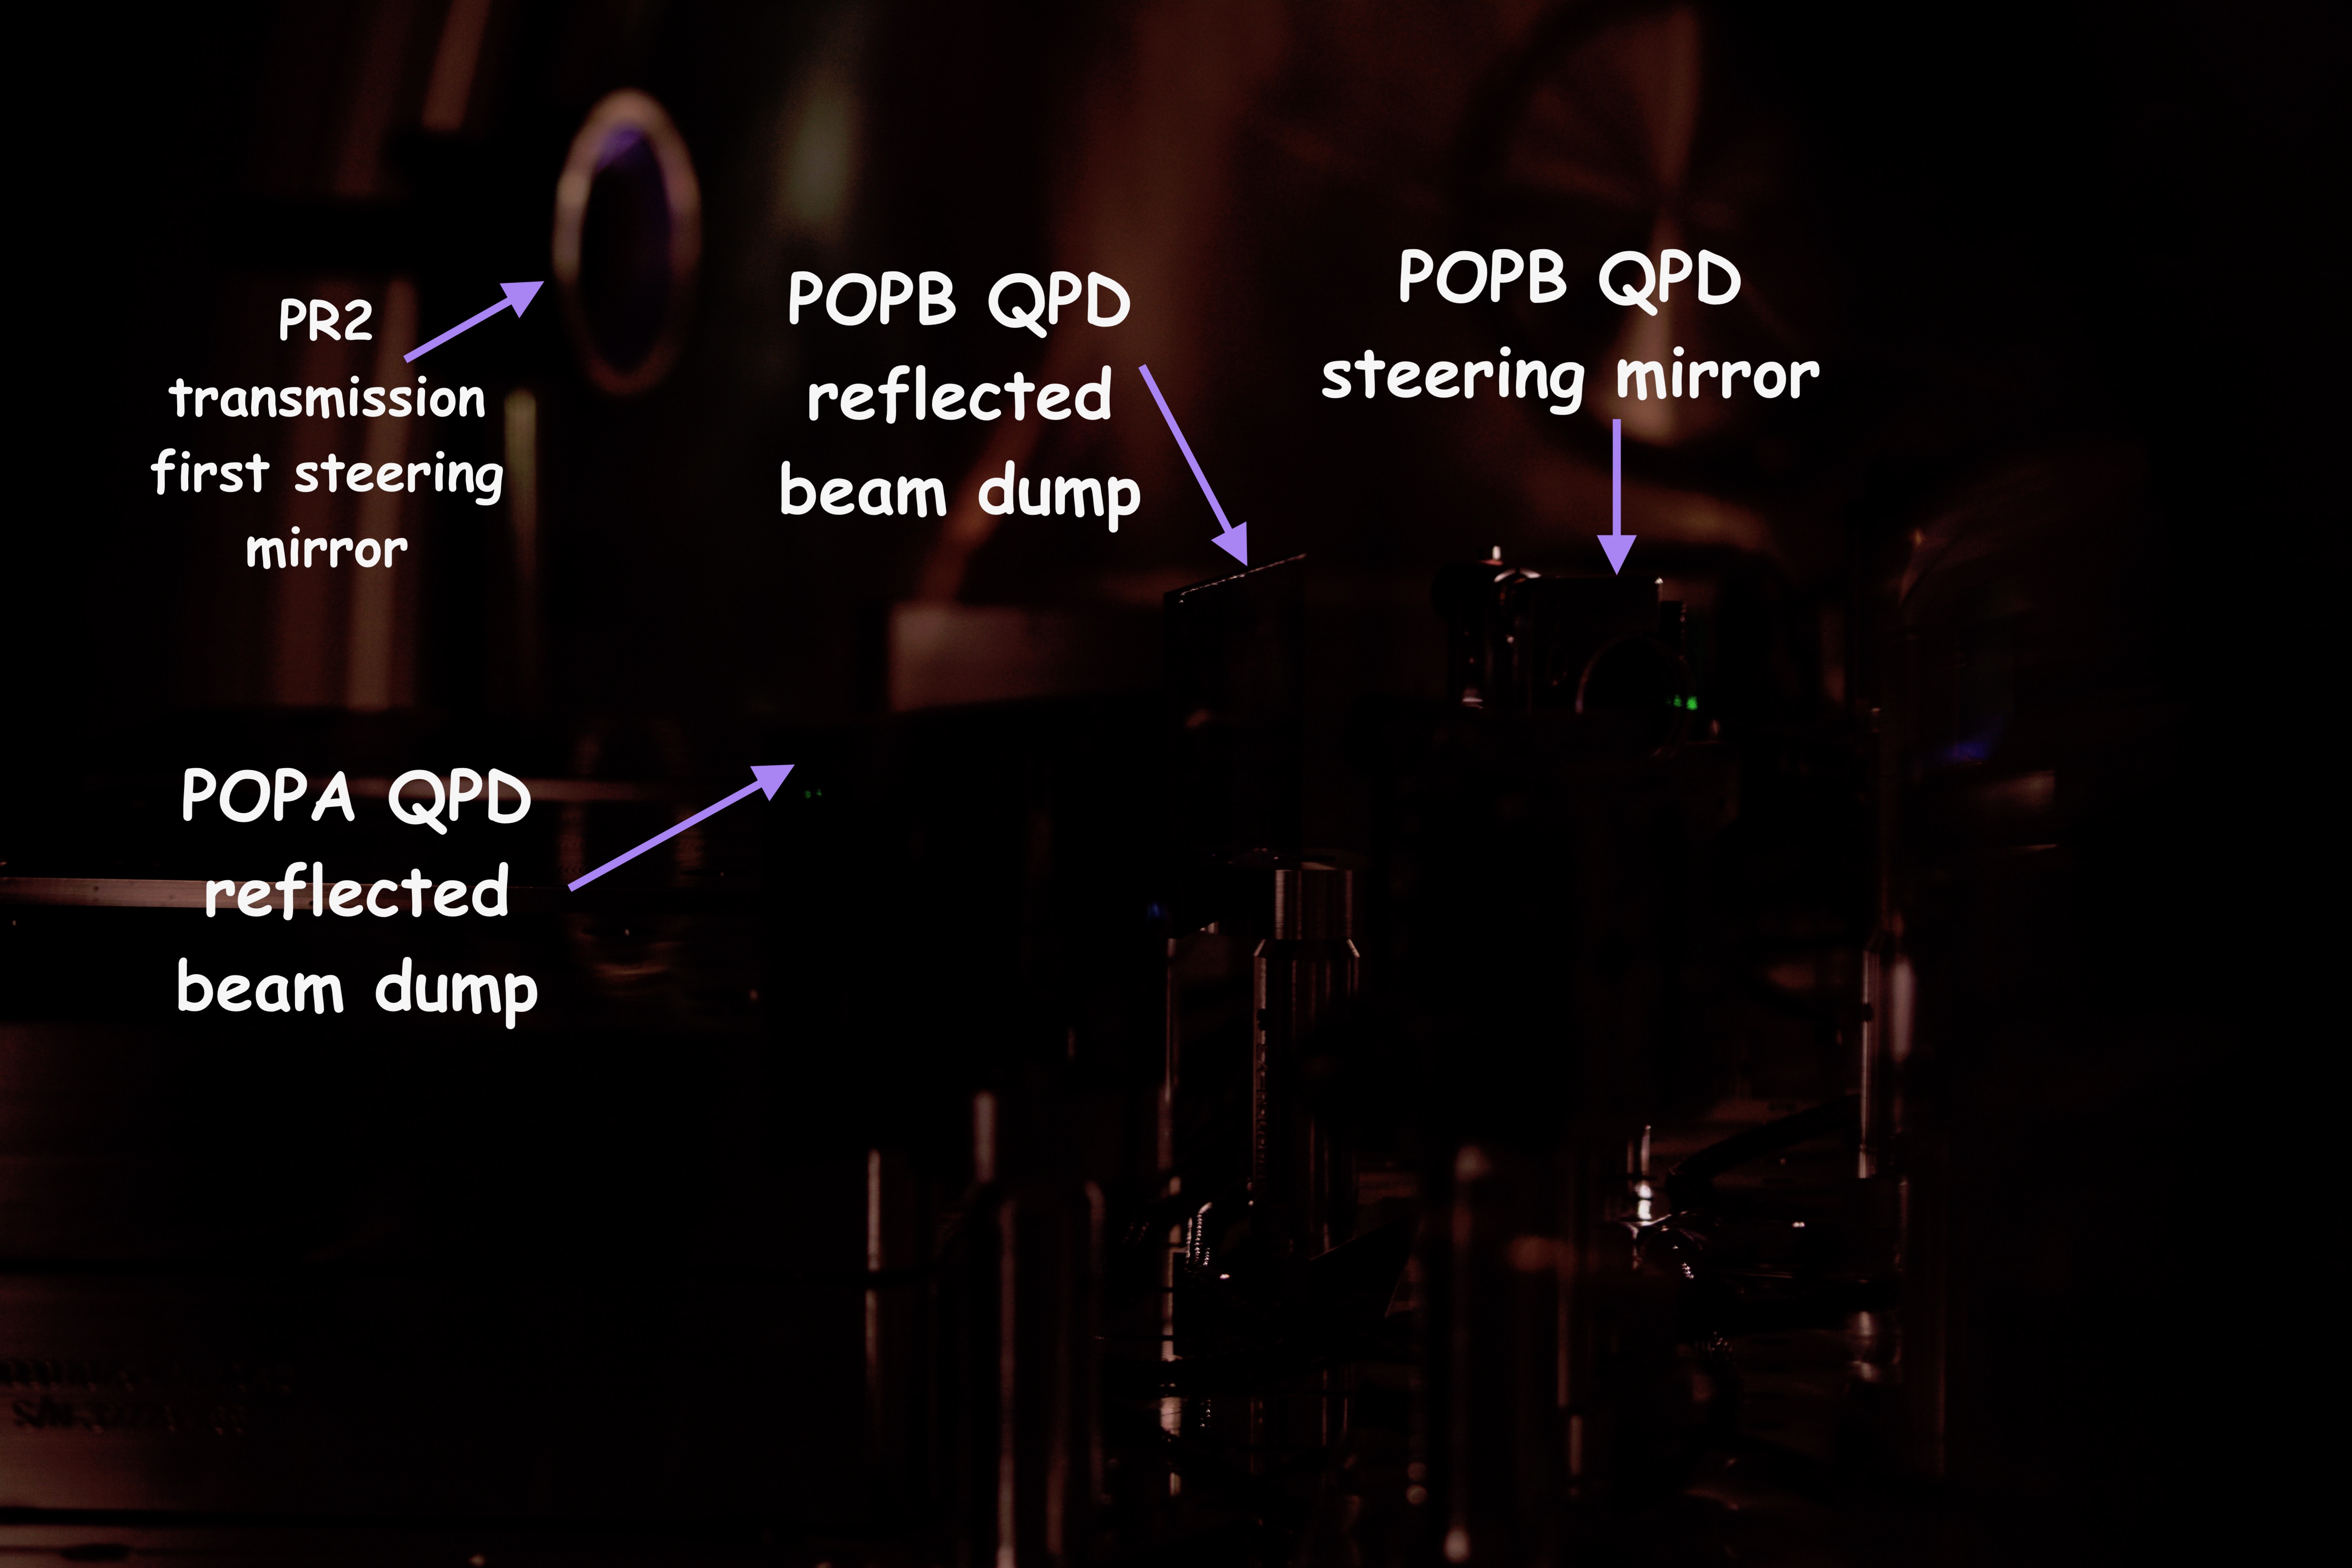
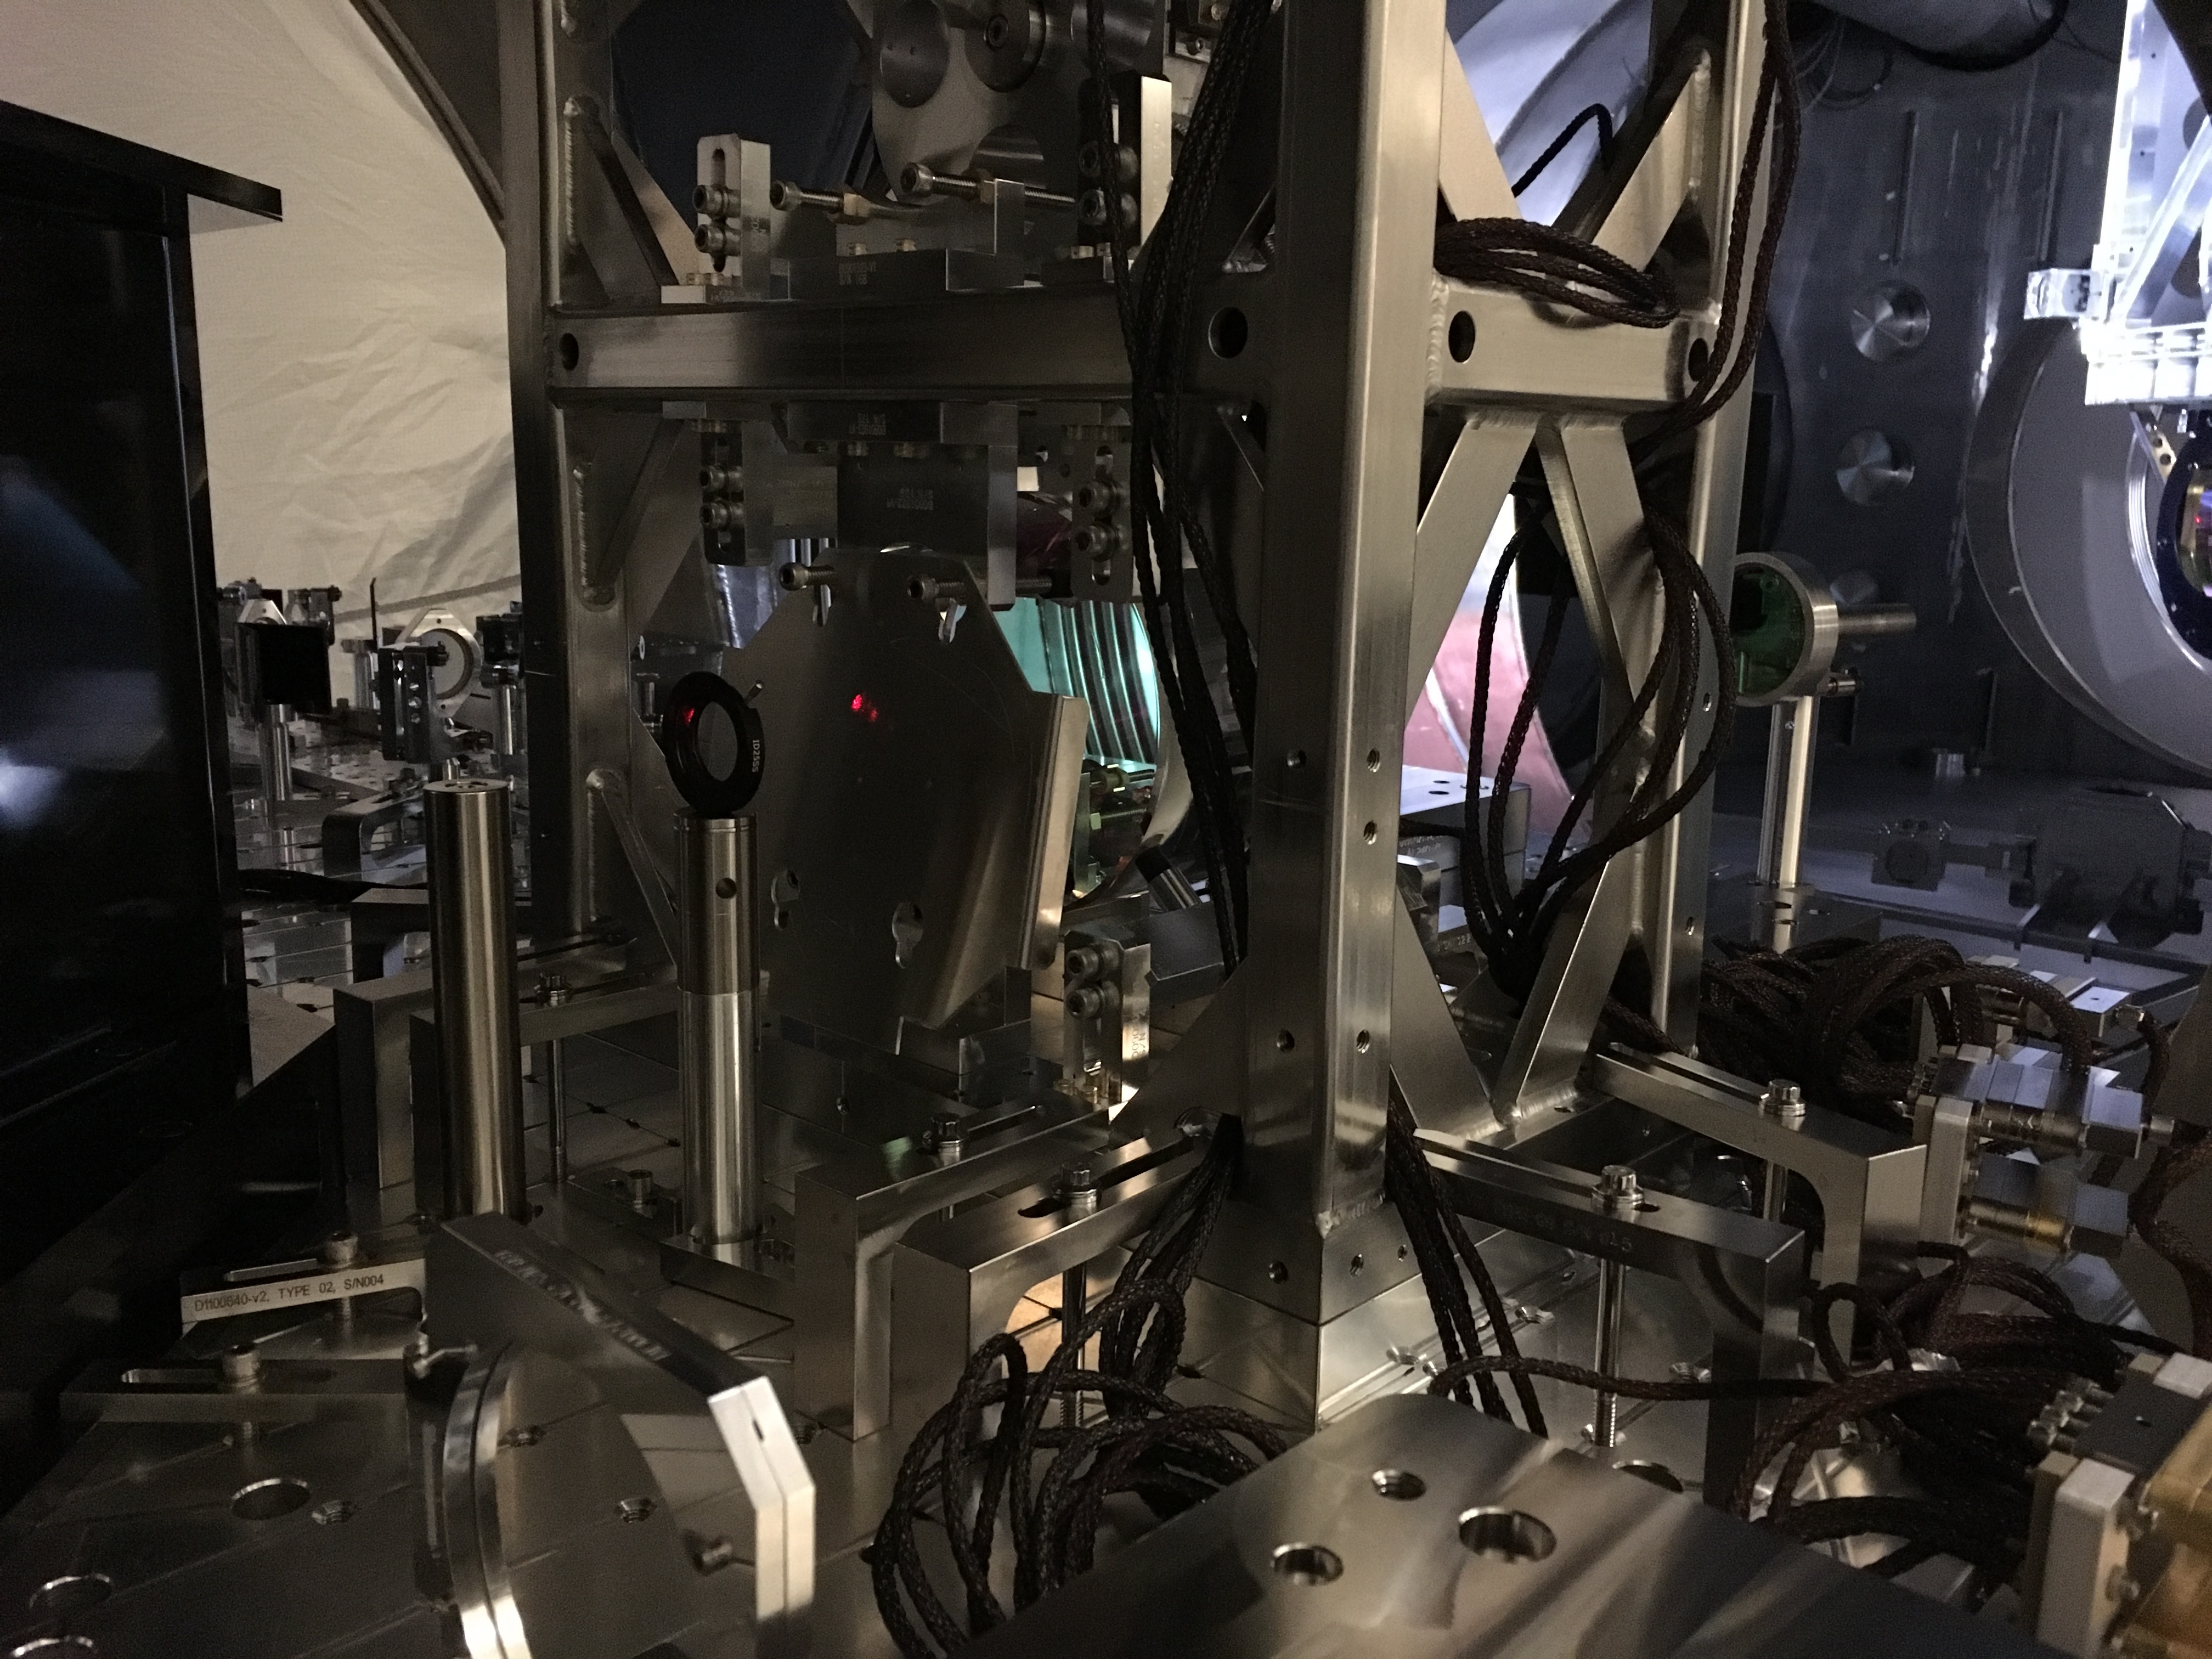
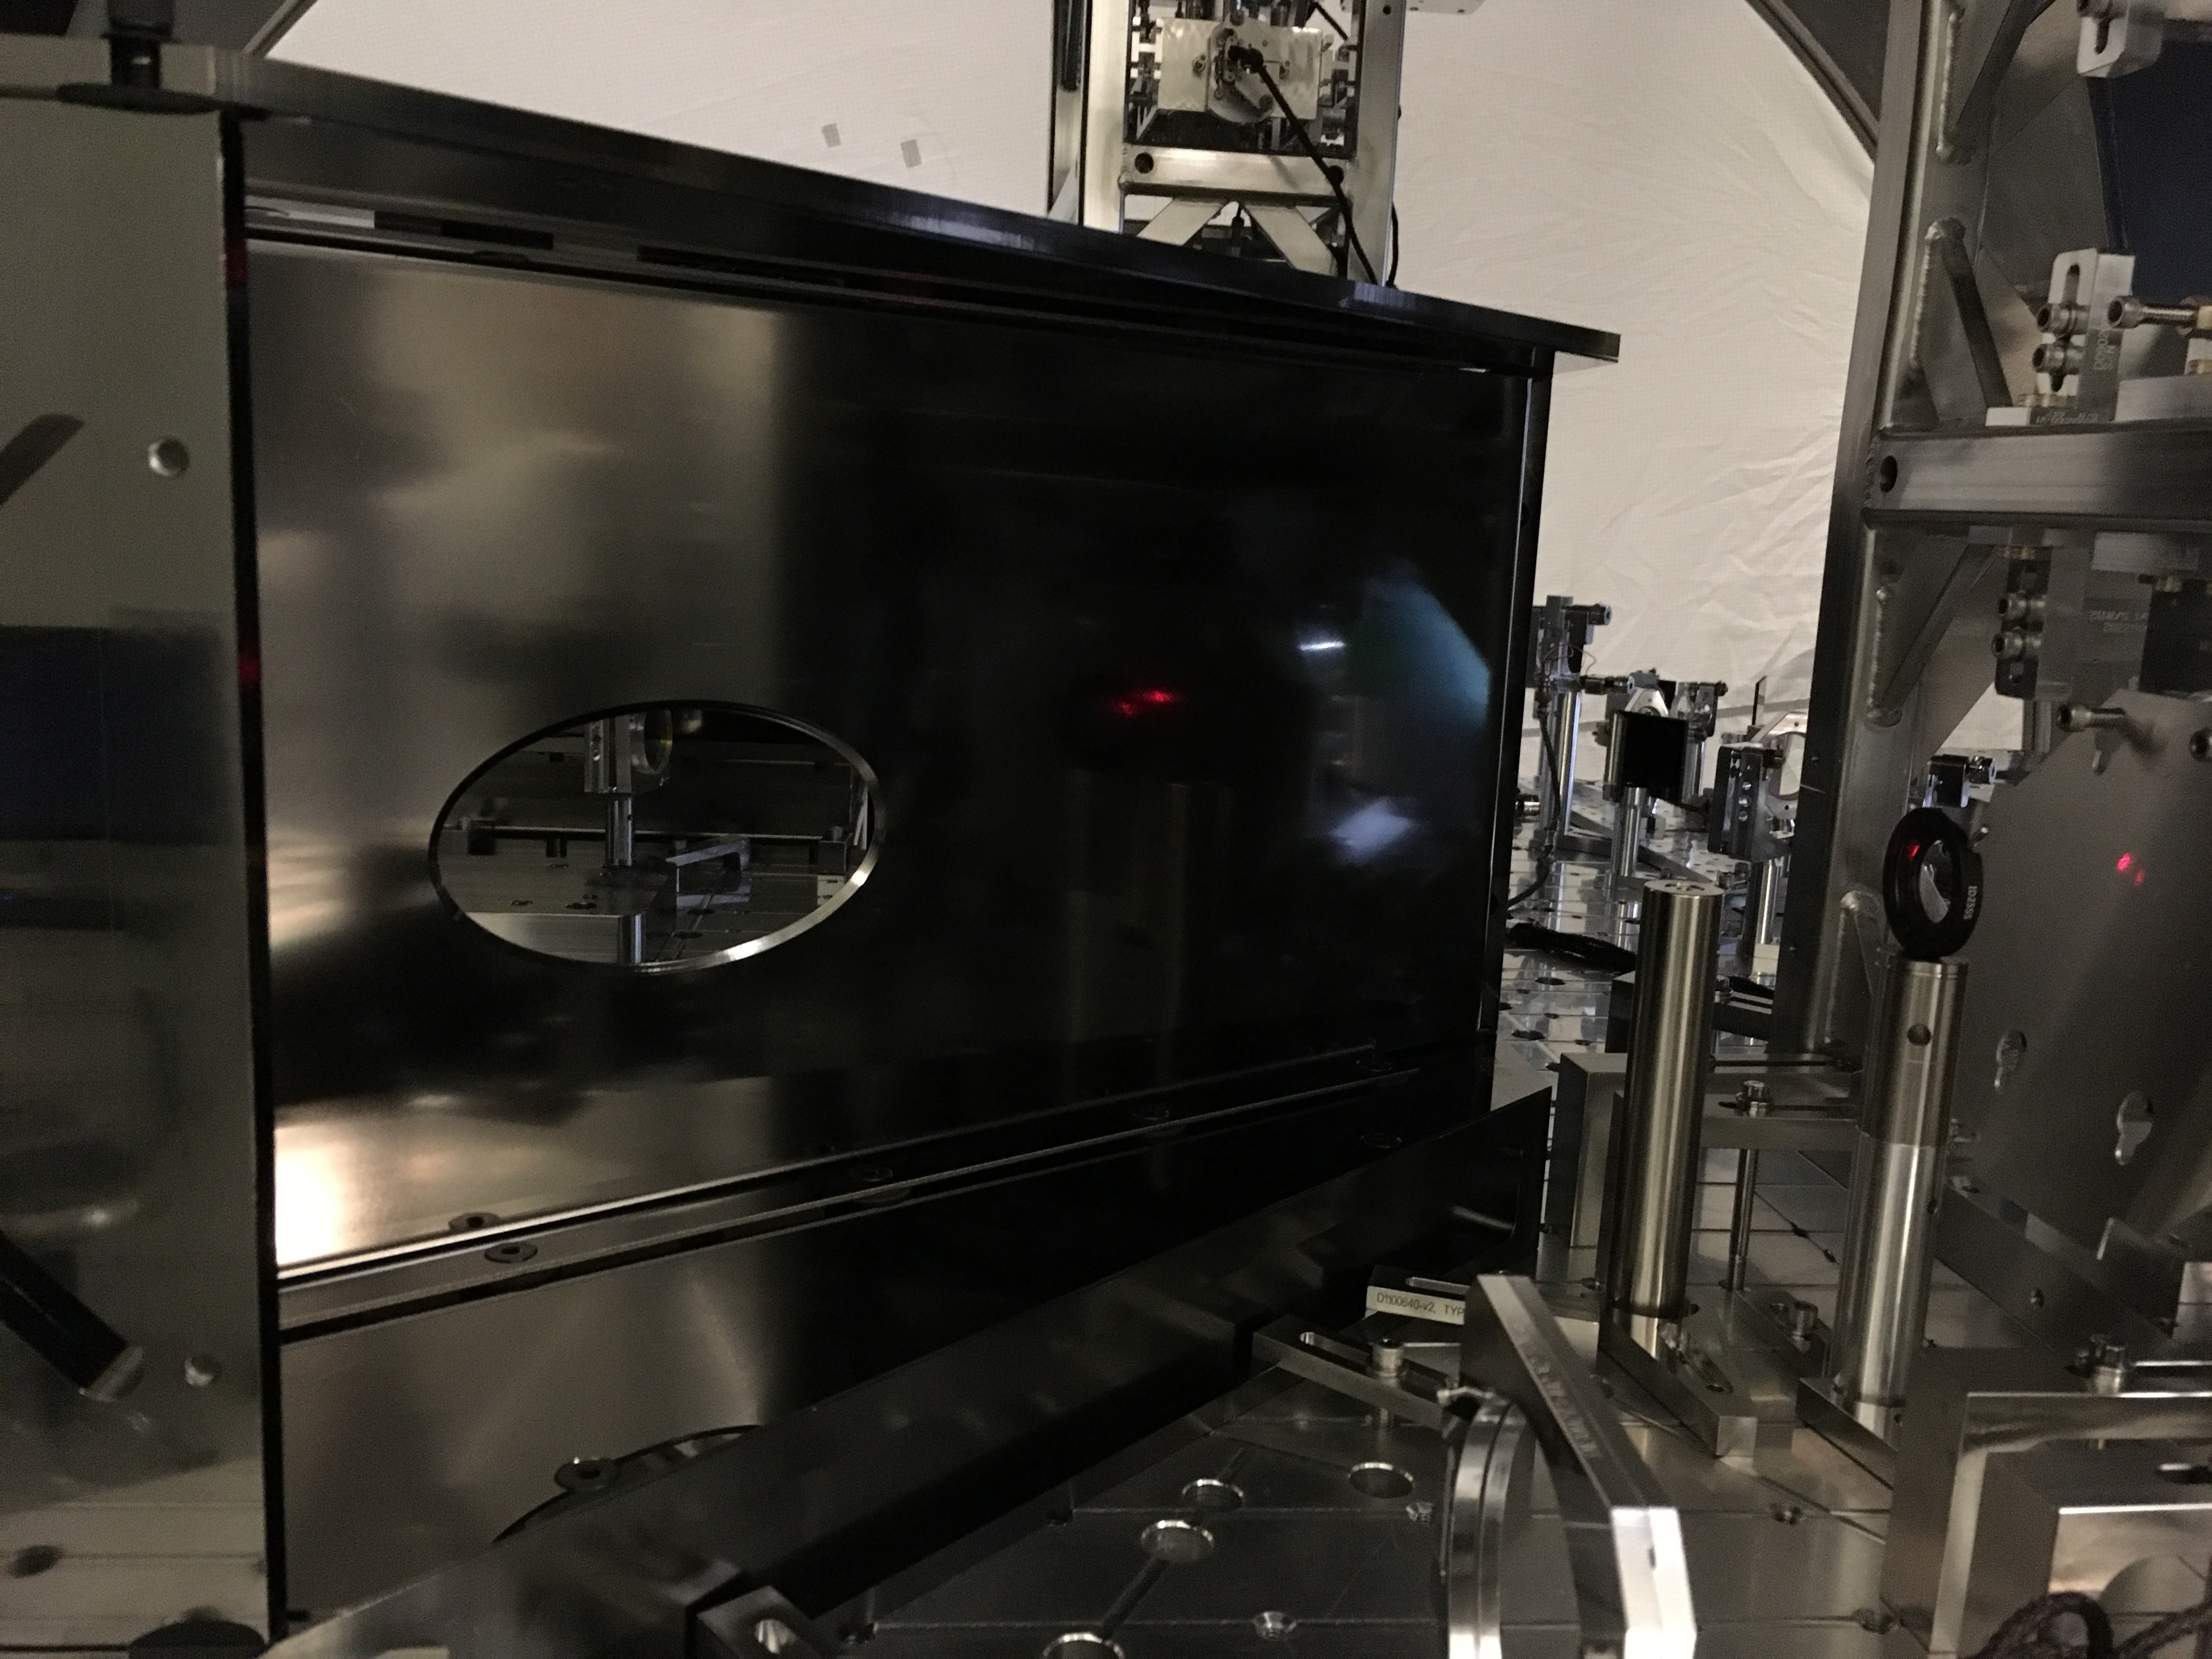
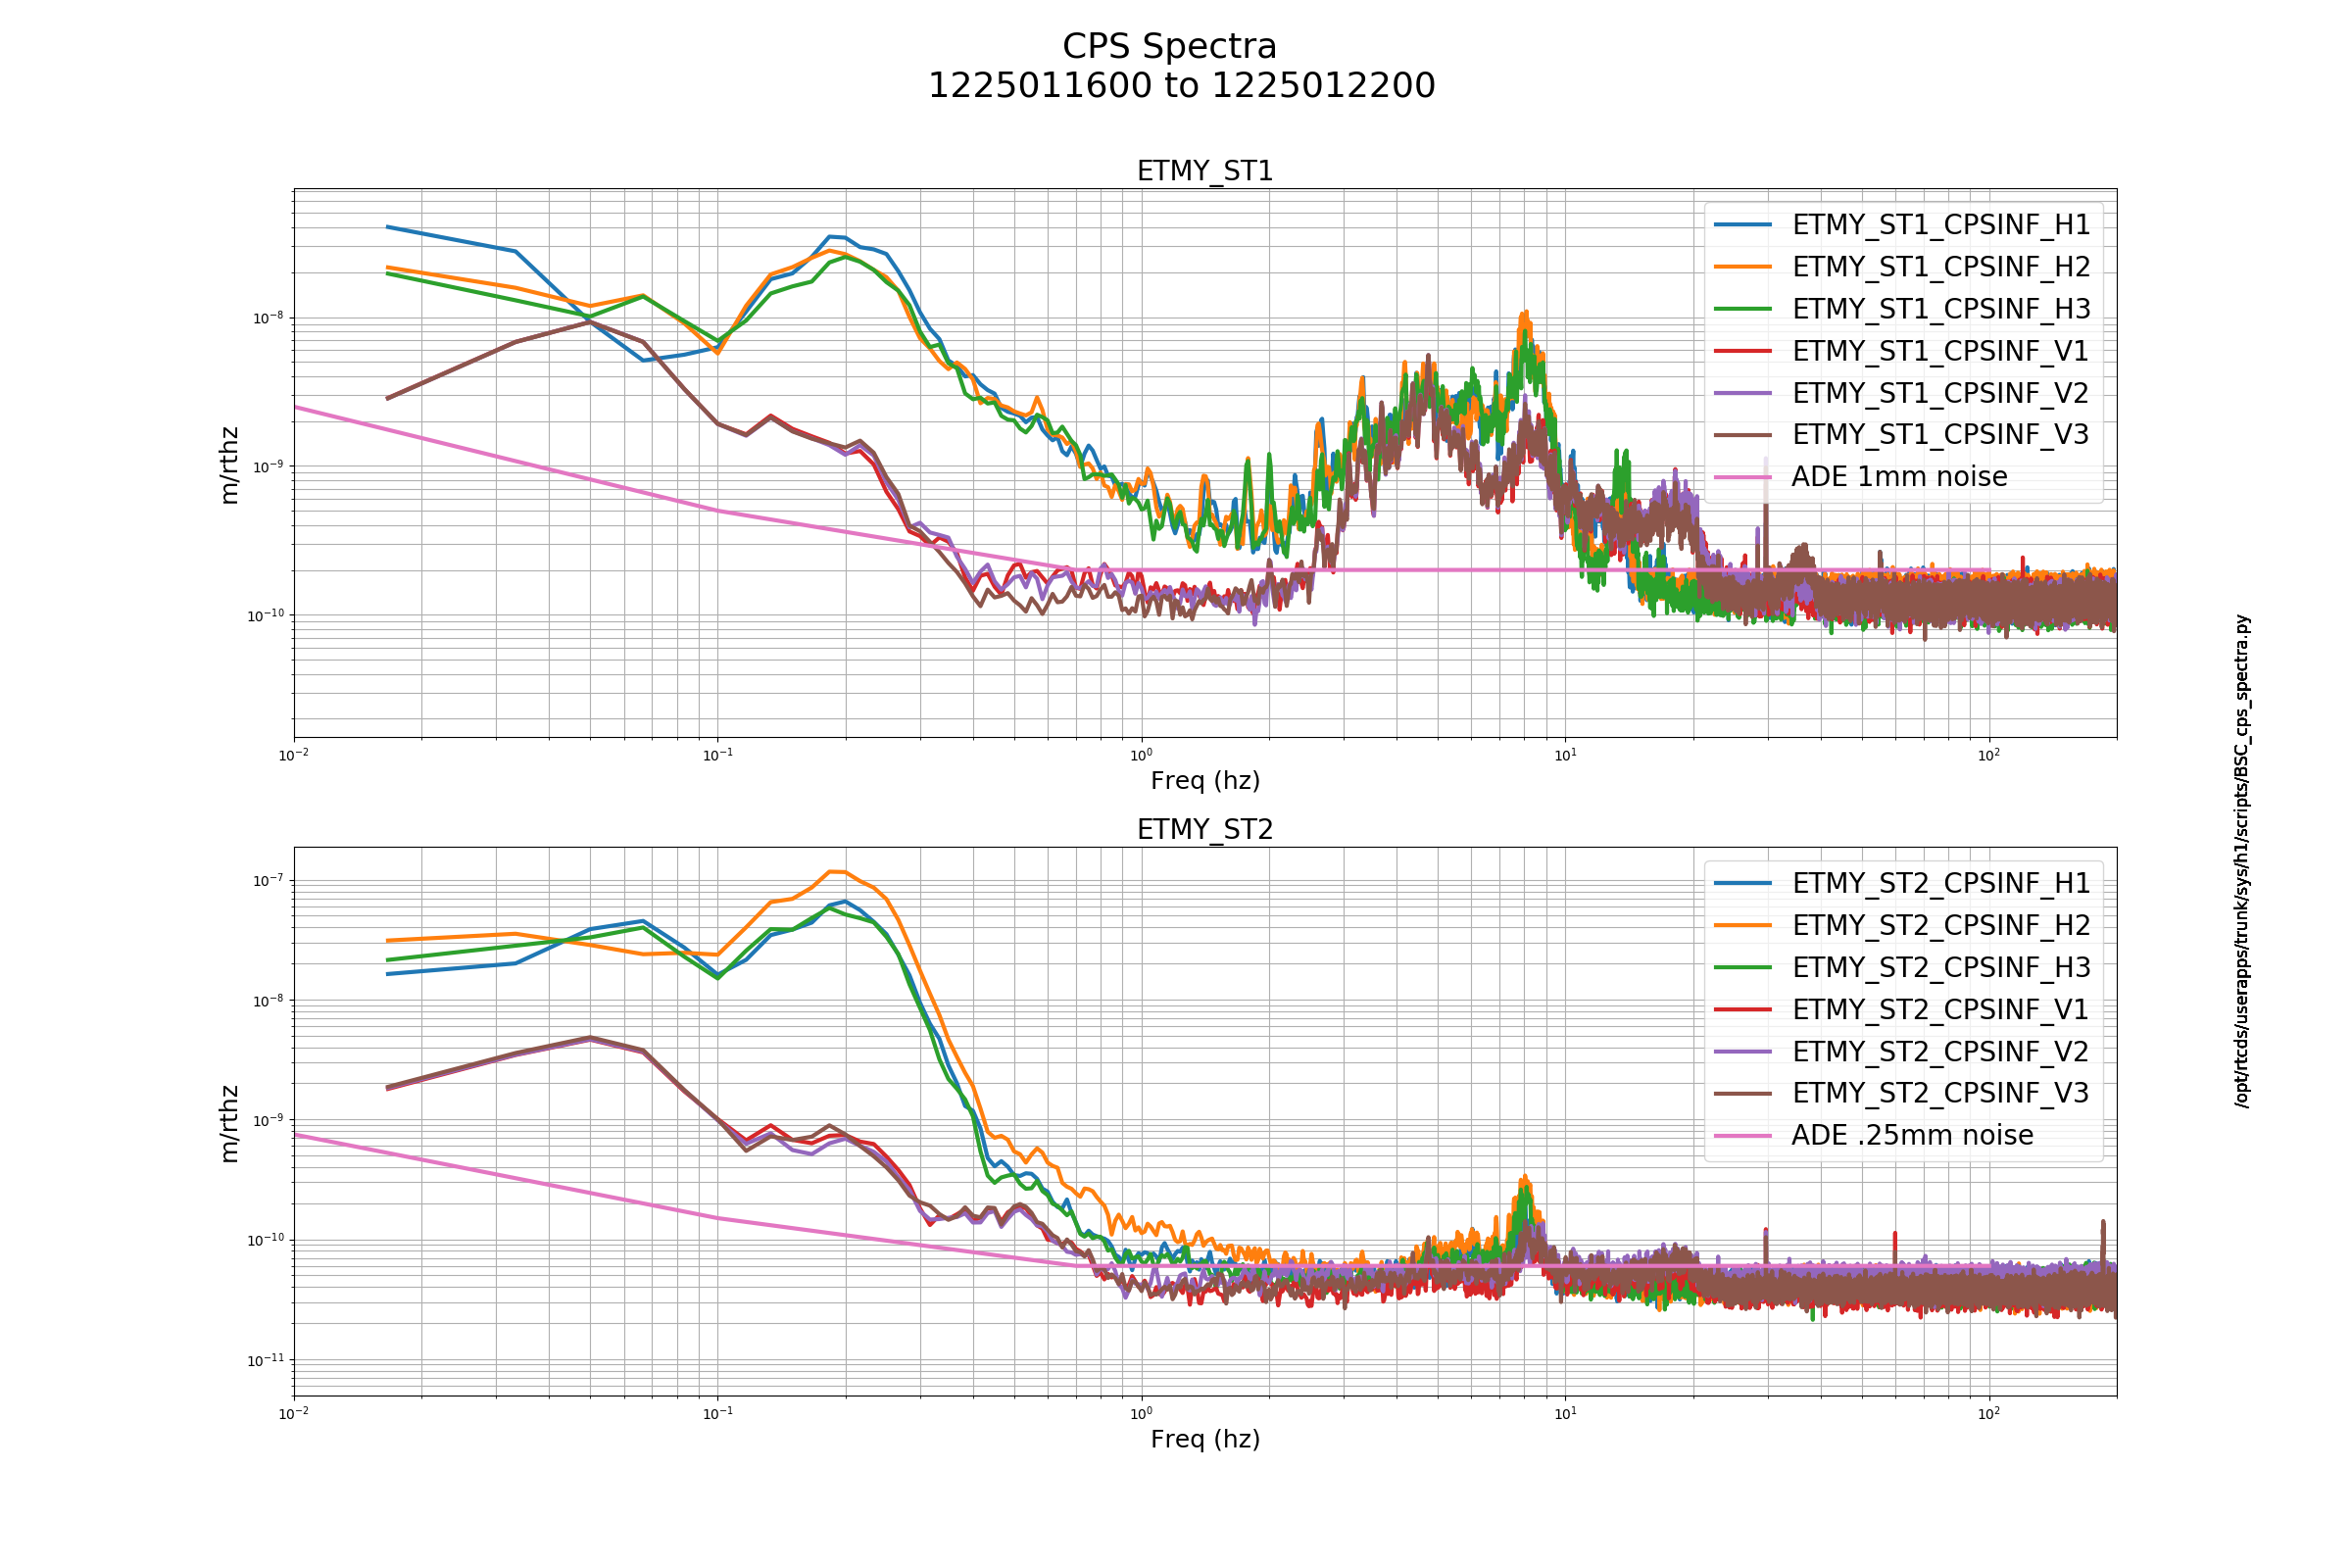
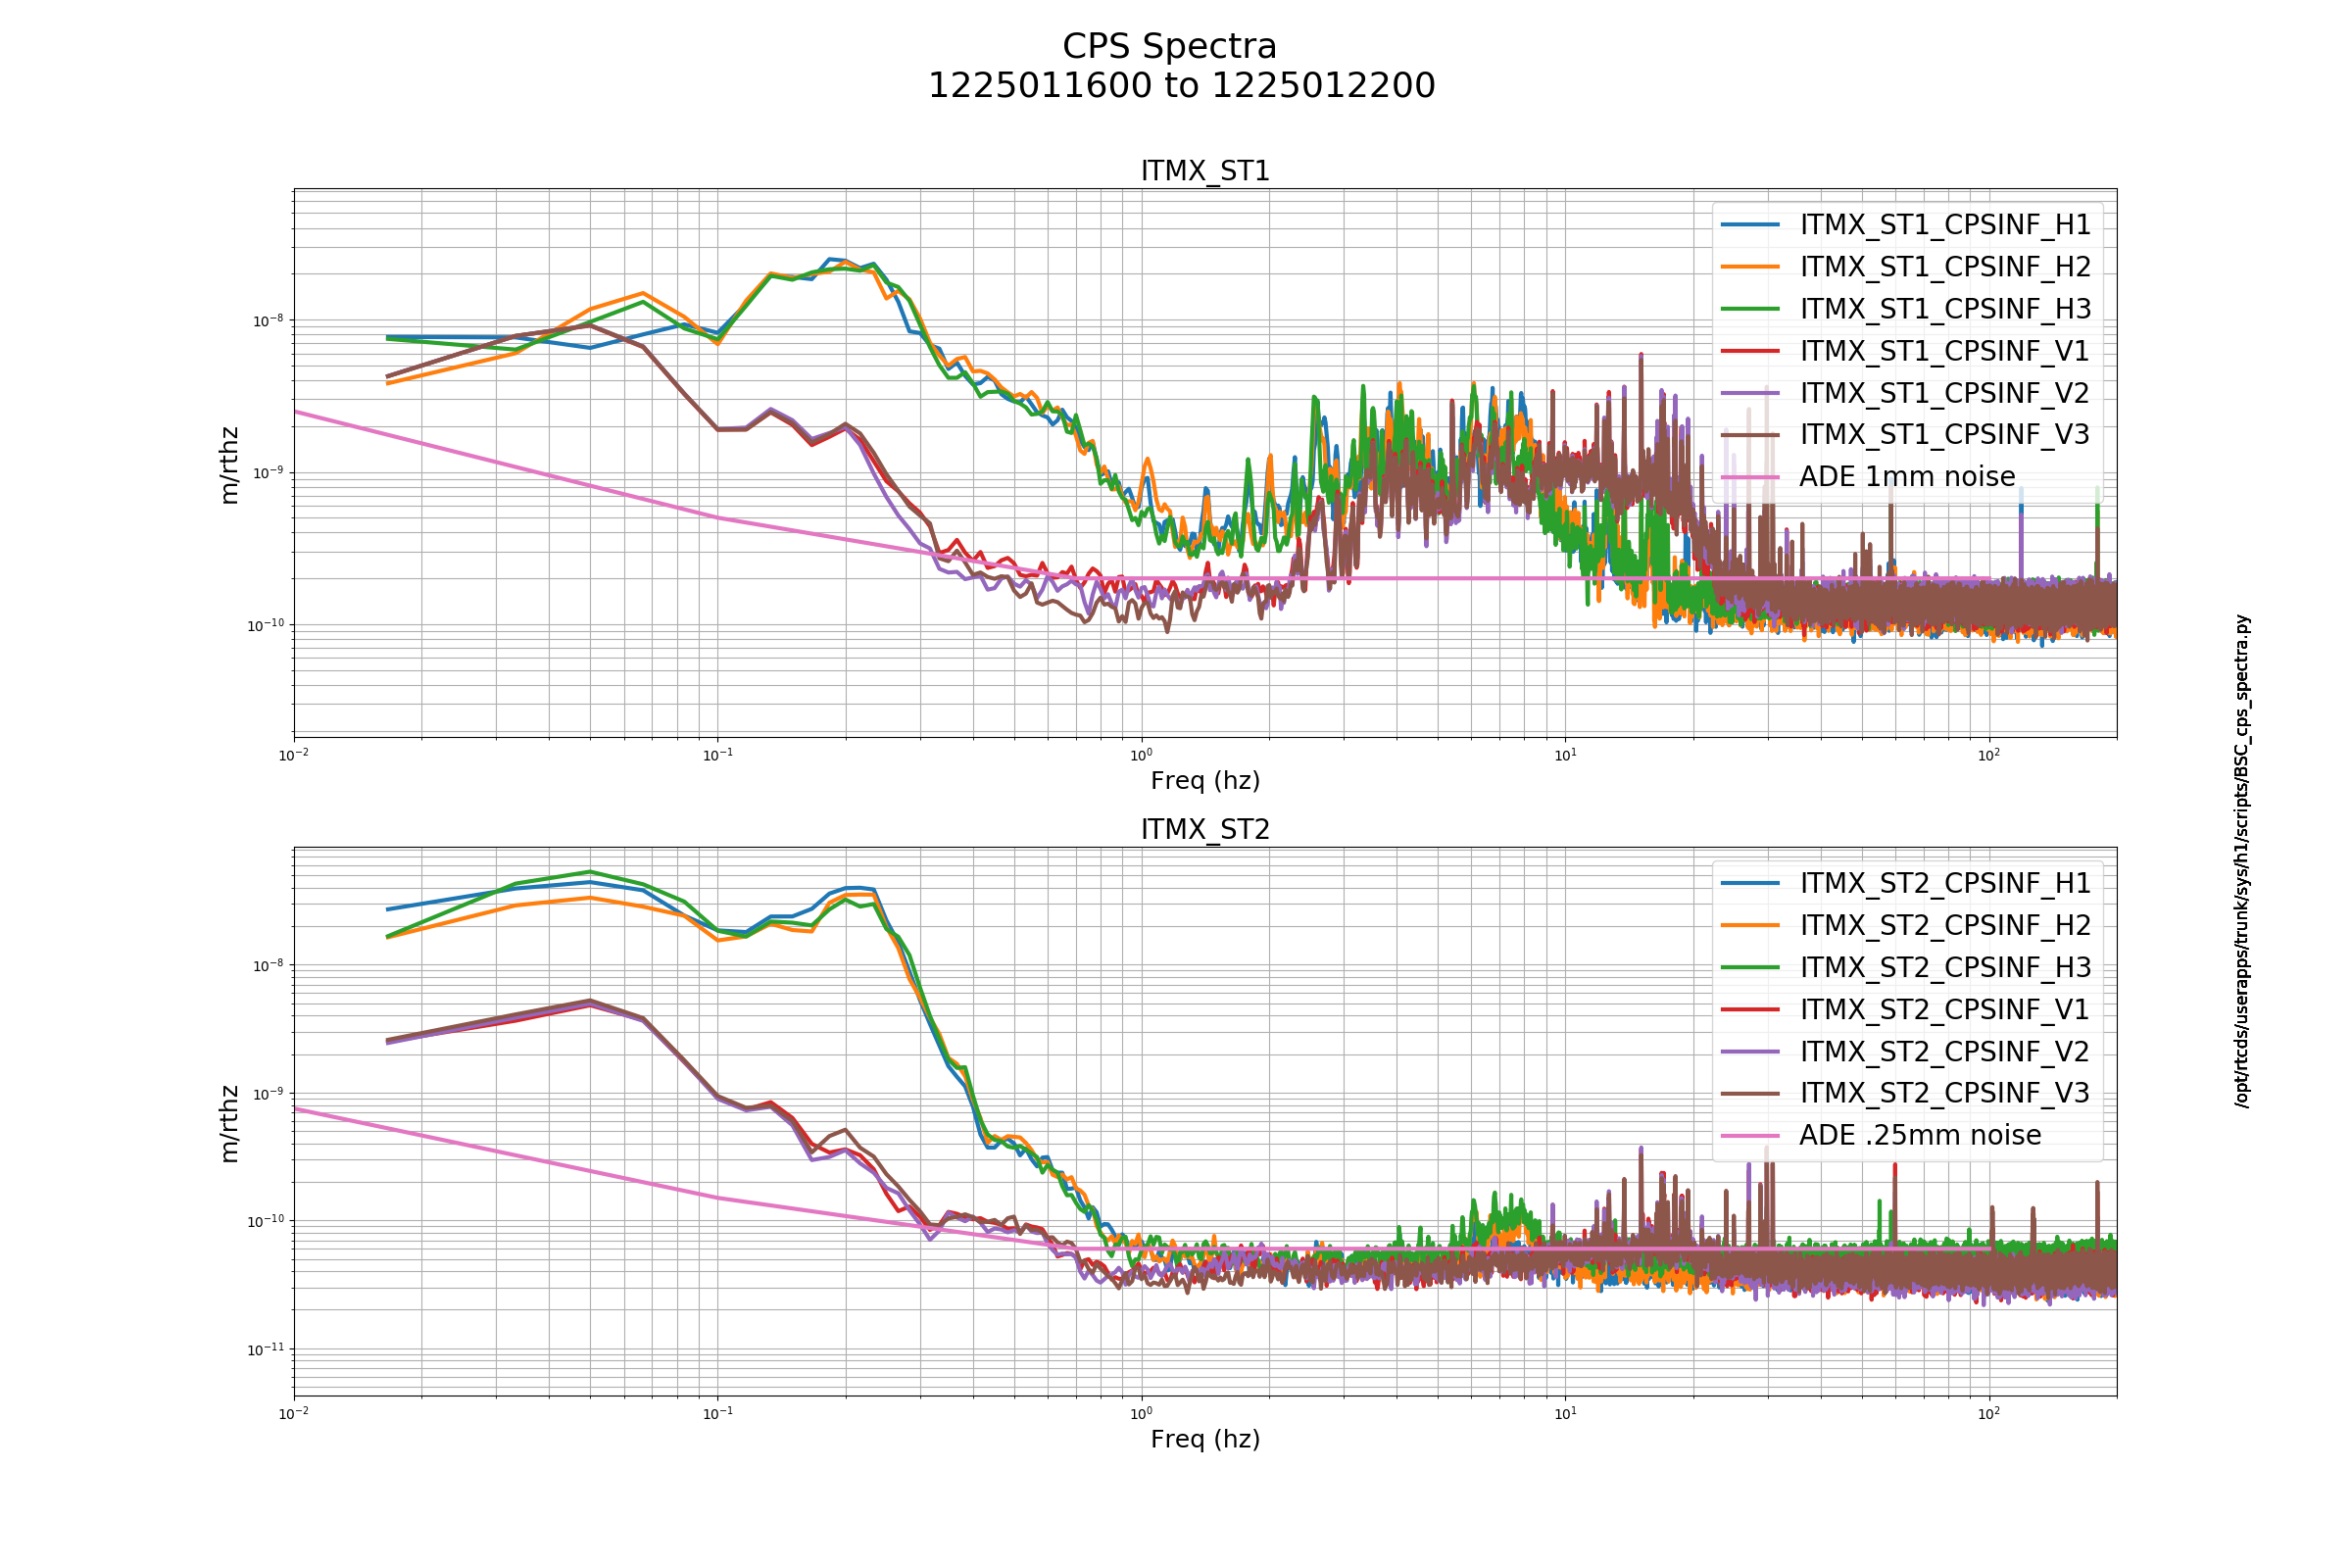
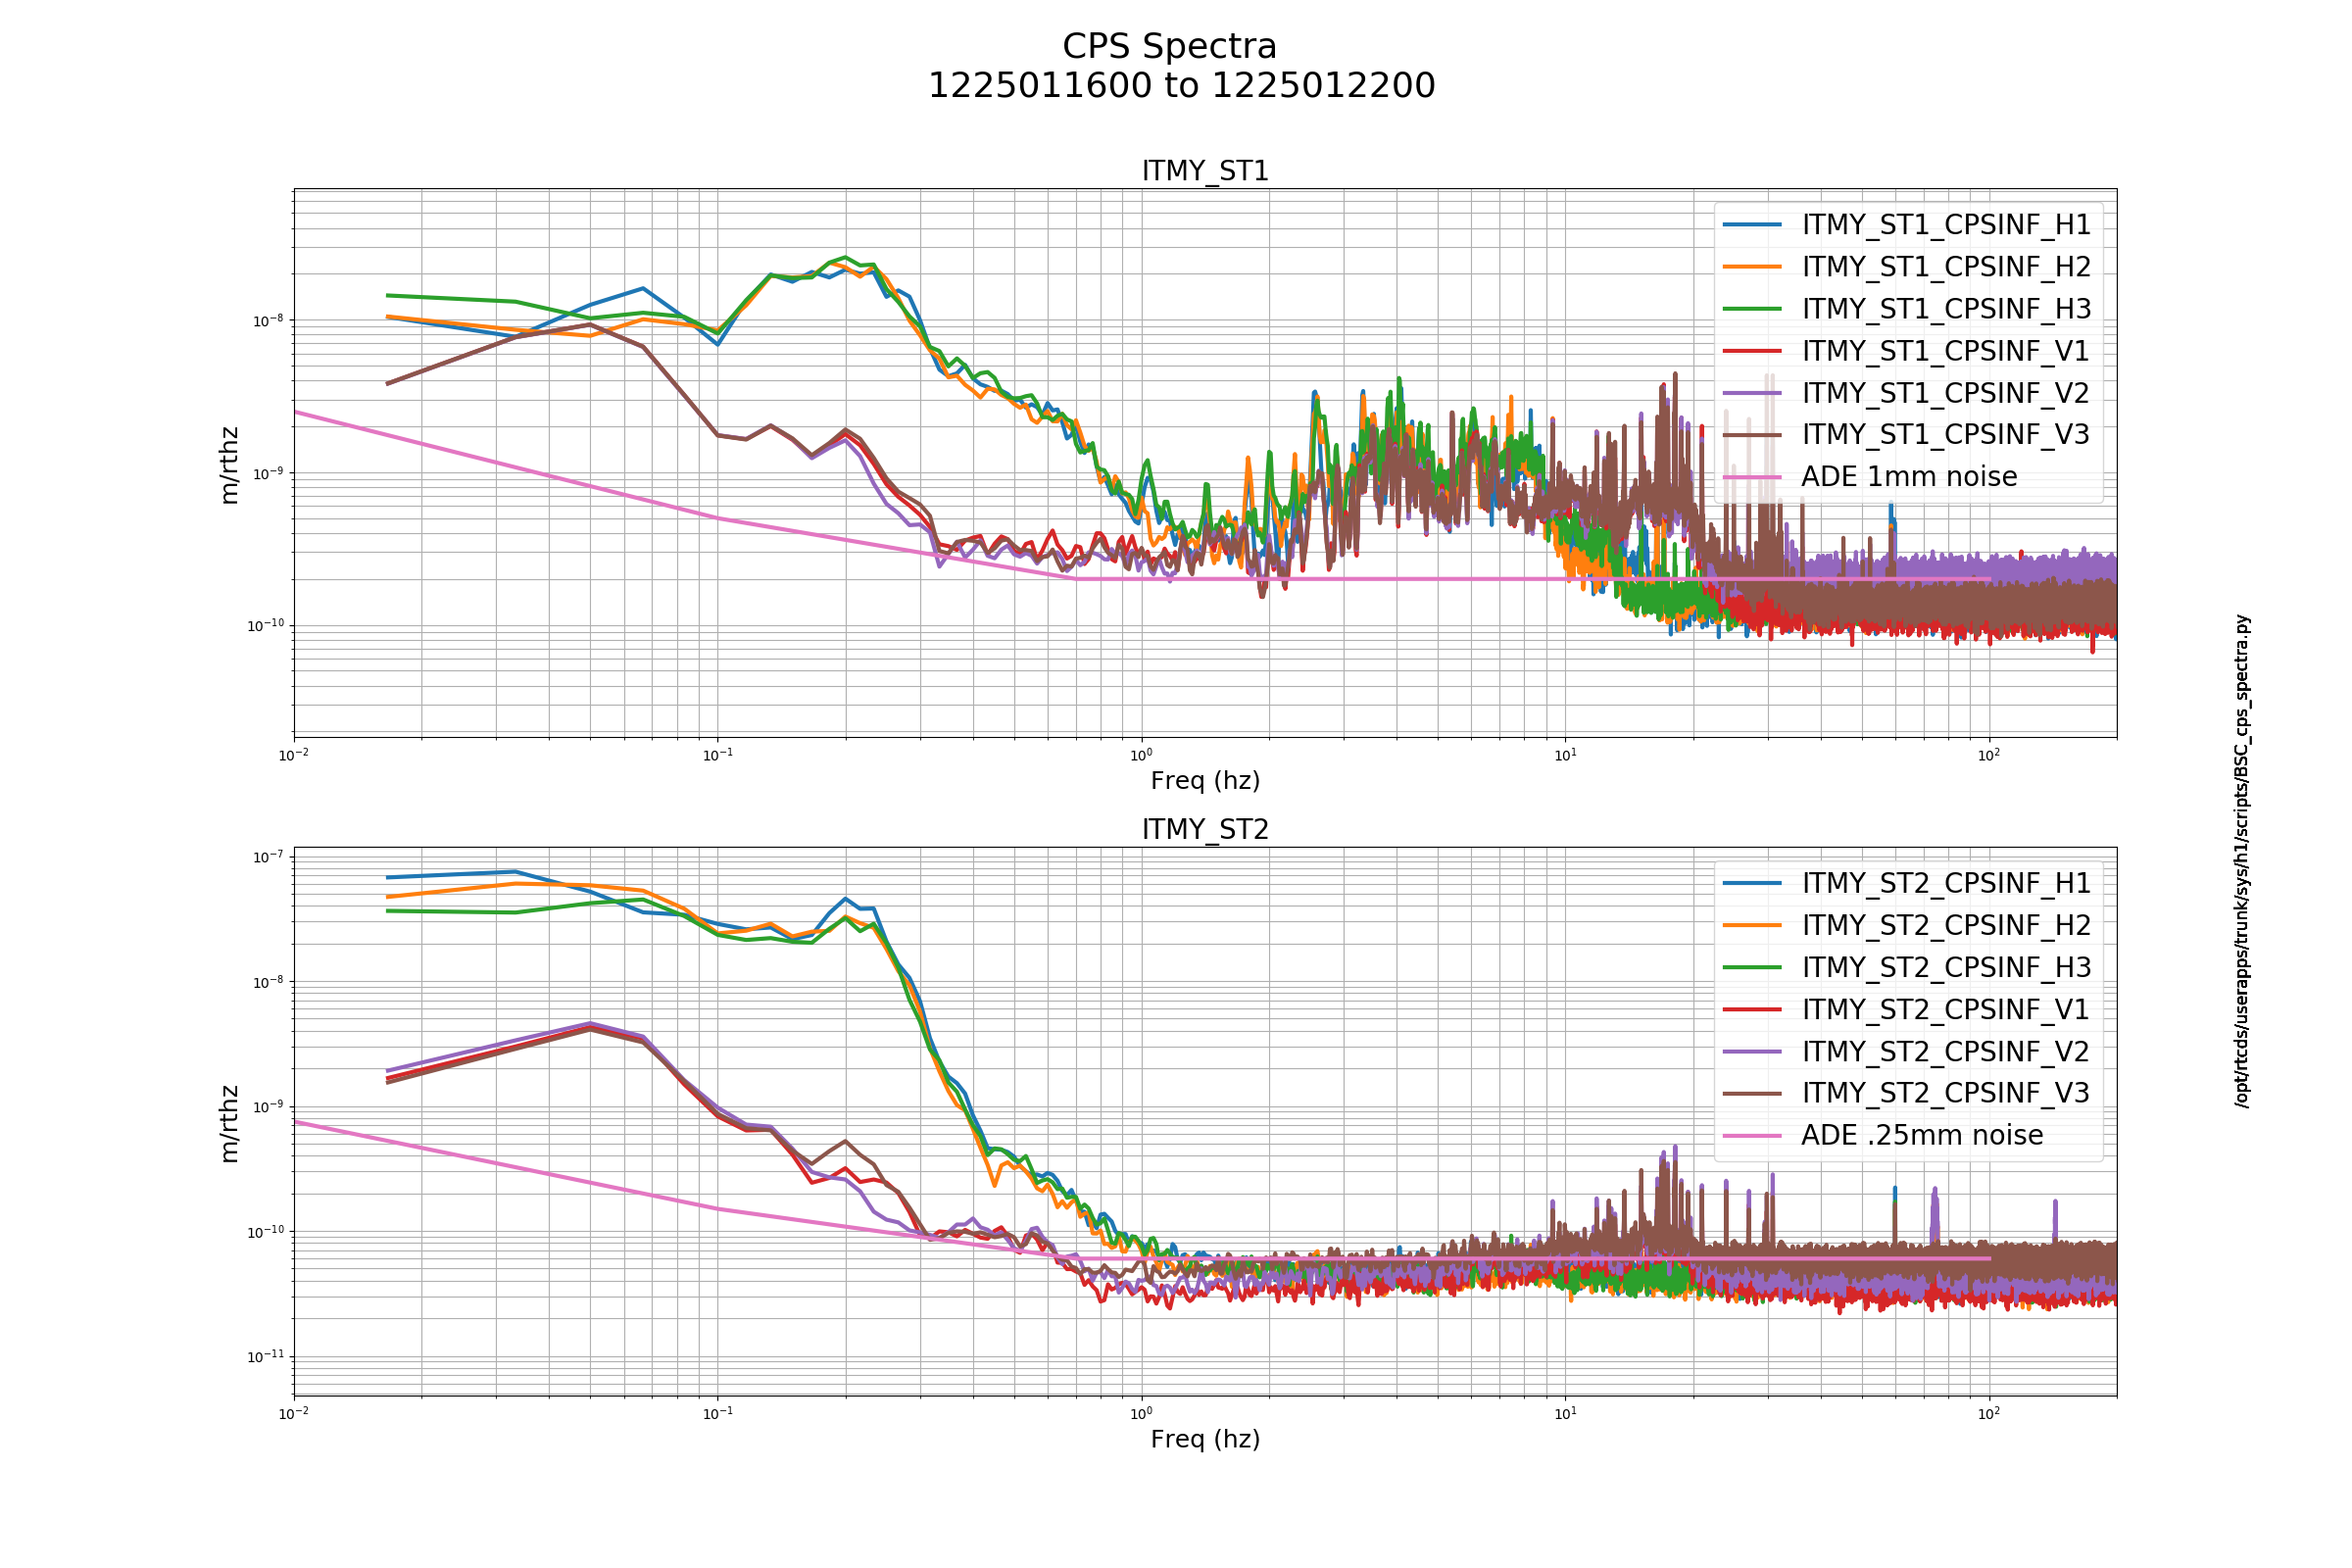
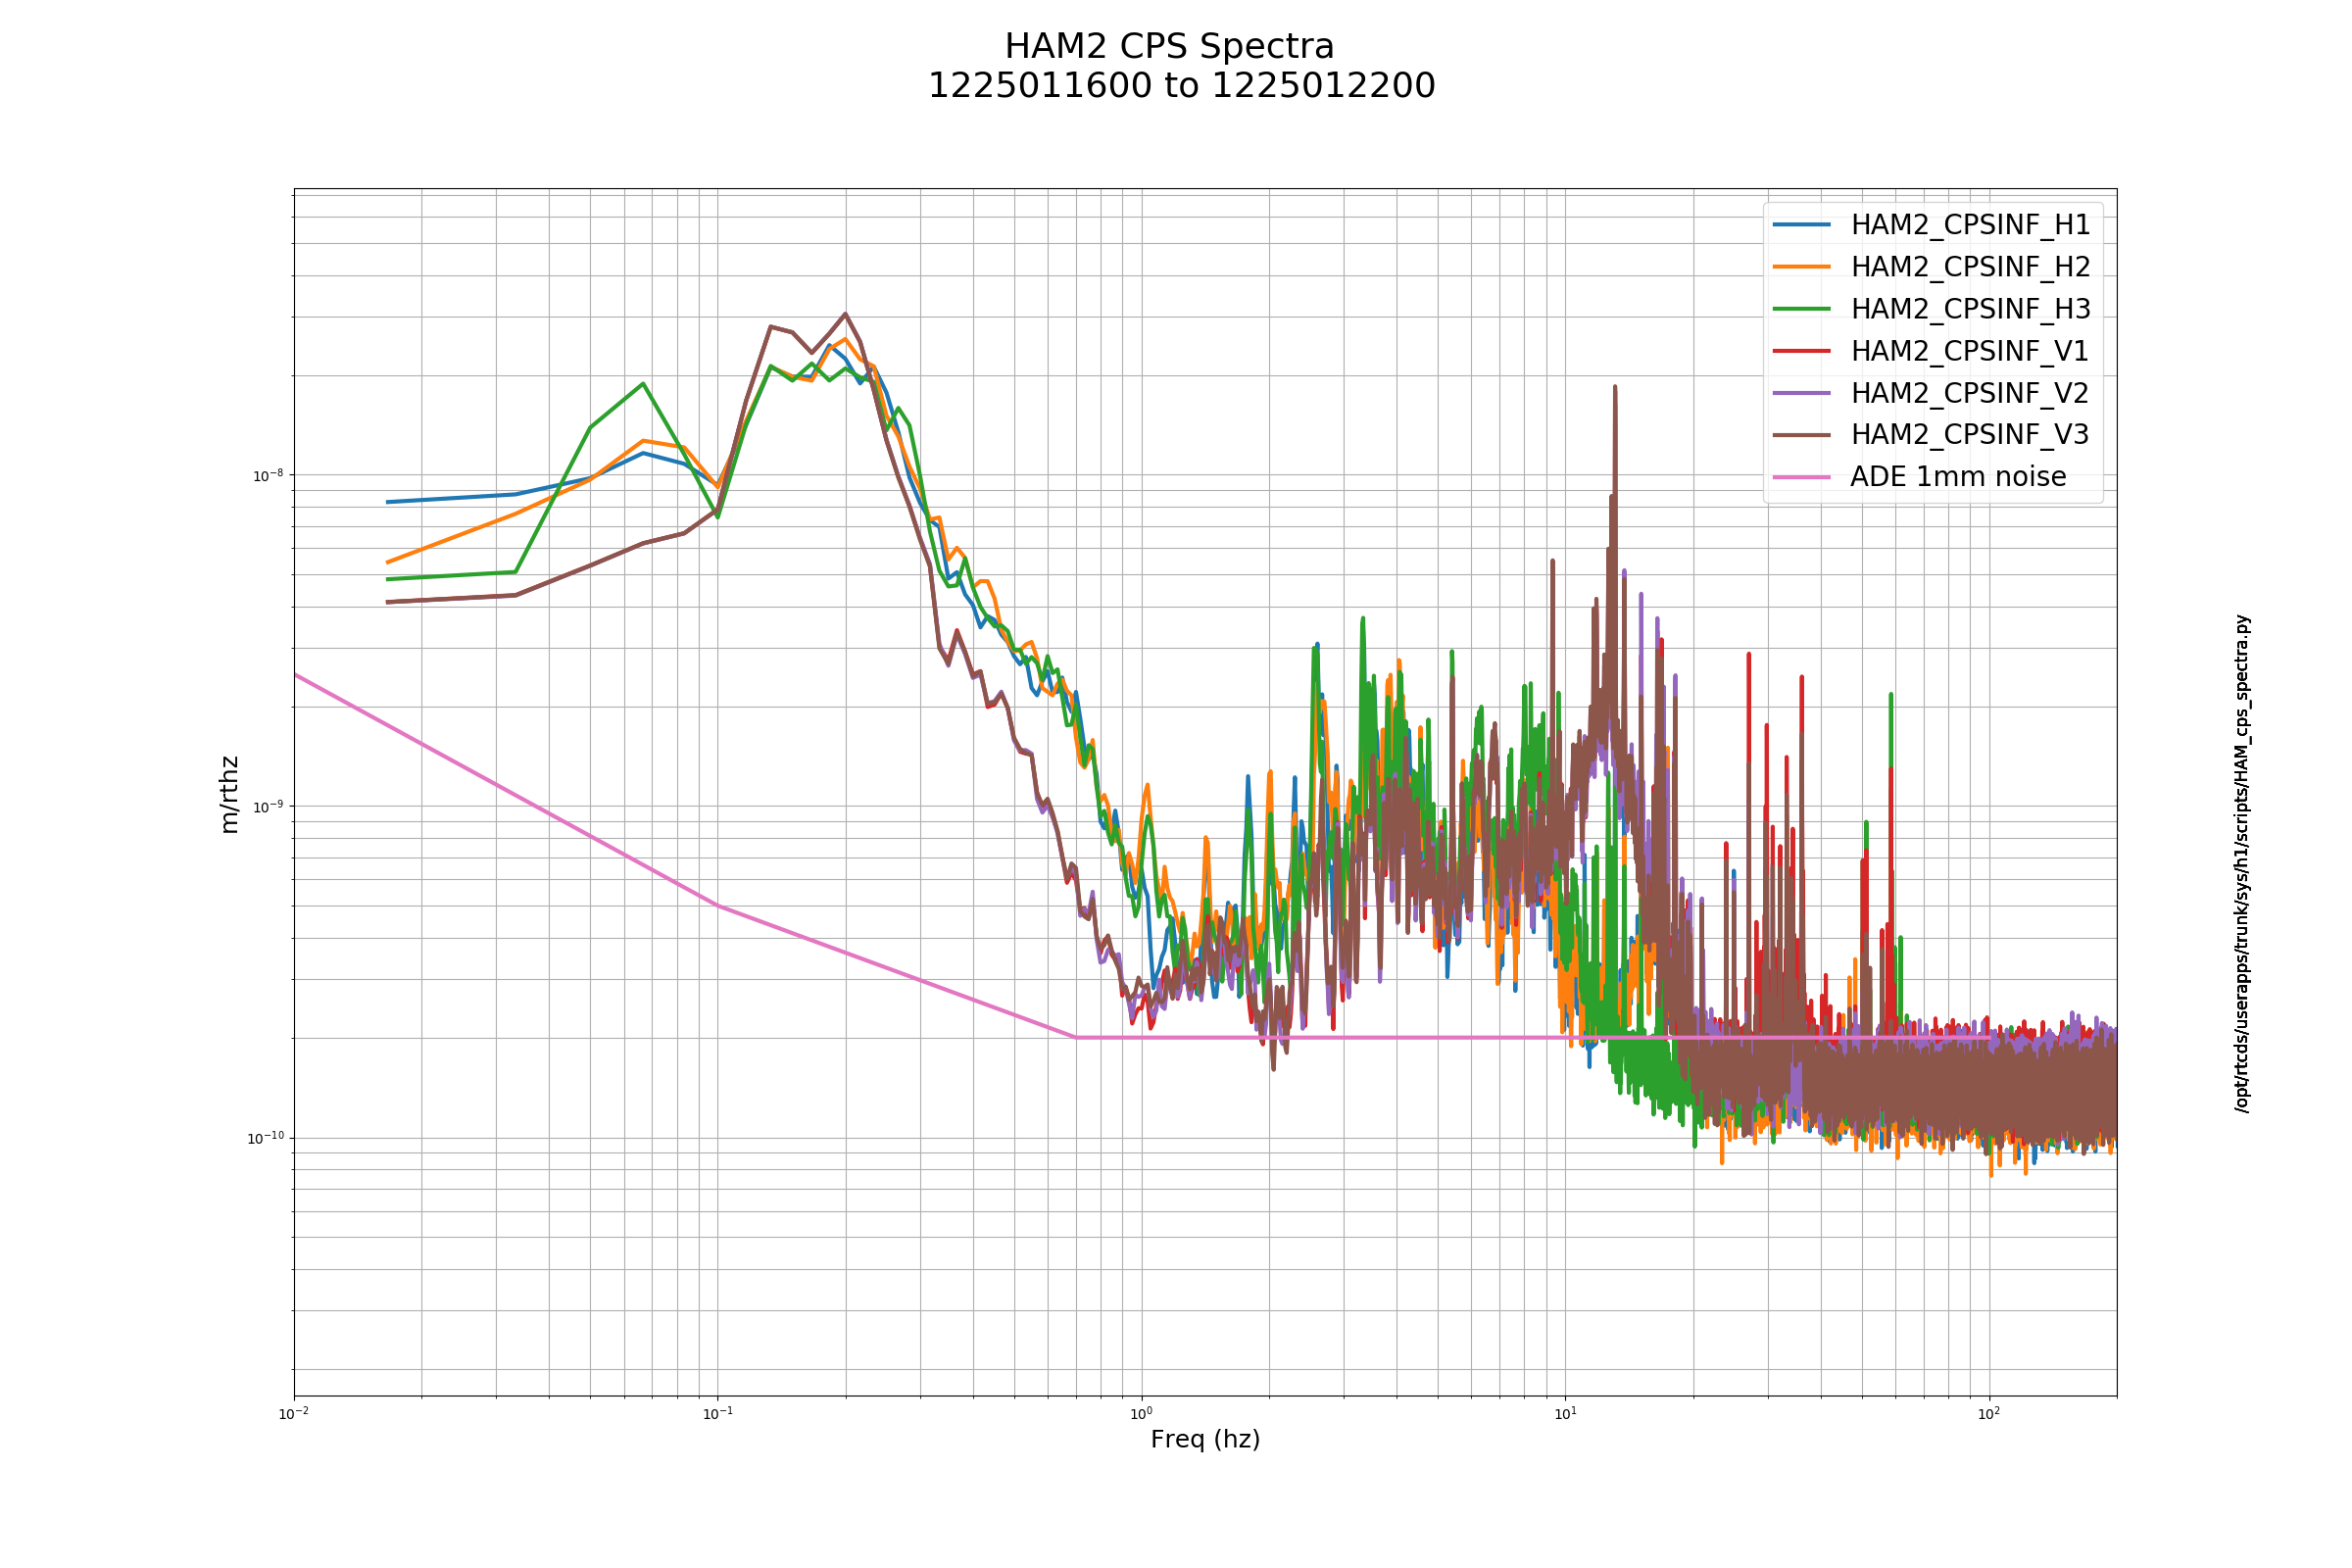
Sheila and I took a peek through a viewport into HAM3 to look for damage to a beam dump on the POP path, and to look for anything fishy (excess scattered light etc) (WP 7896). The best view we had was unfortunately looking at the back face of the beam dump but we did not see anything untoward.
The beam dump in question is blocking a beam which is picked off the POP QPD path, between AROM-RH6 and AROM-RH7 in this diagram. The viewport we were looking through is up above the QPD SLED in that diagram. We didn't get a good photo of this particular beam dump.
I'm attaching the only decent photos we took, of the beam dumps on the QPD SLED. The beam dump on the QPDB diode reflection looked a bit cloudy.
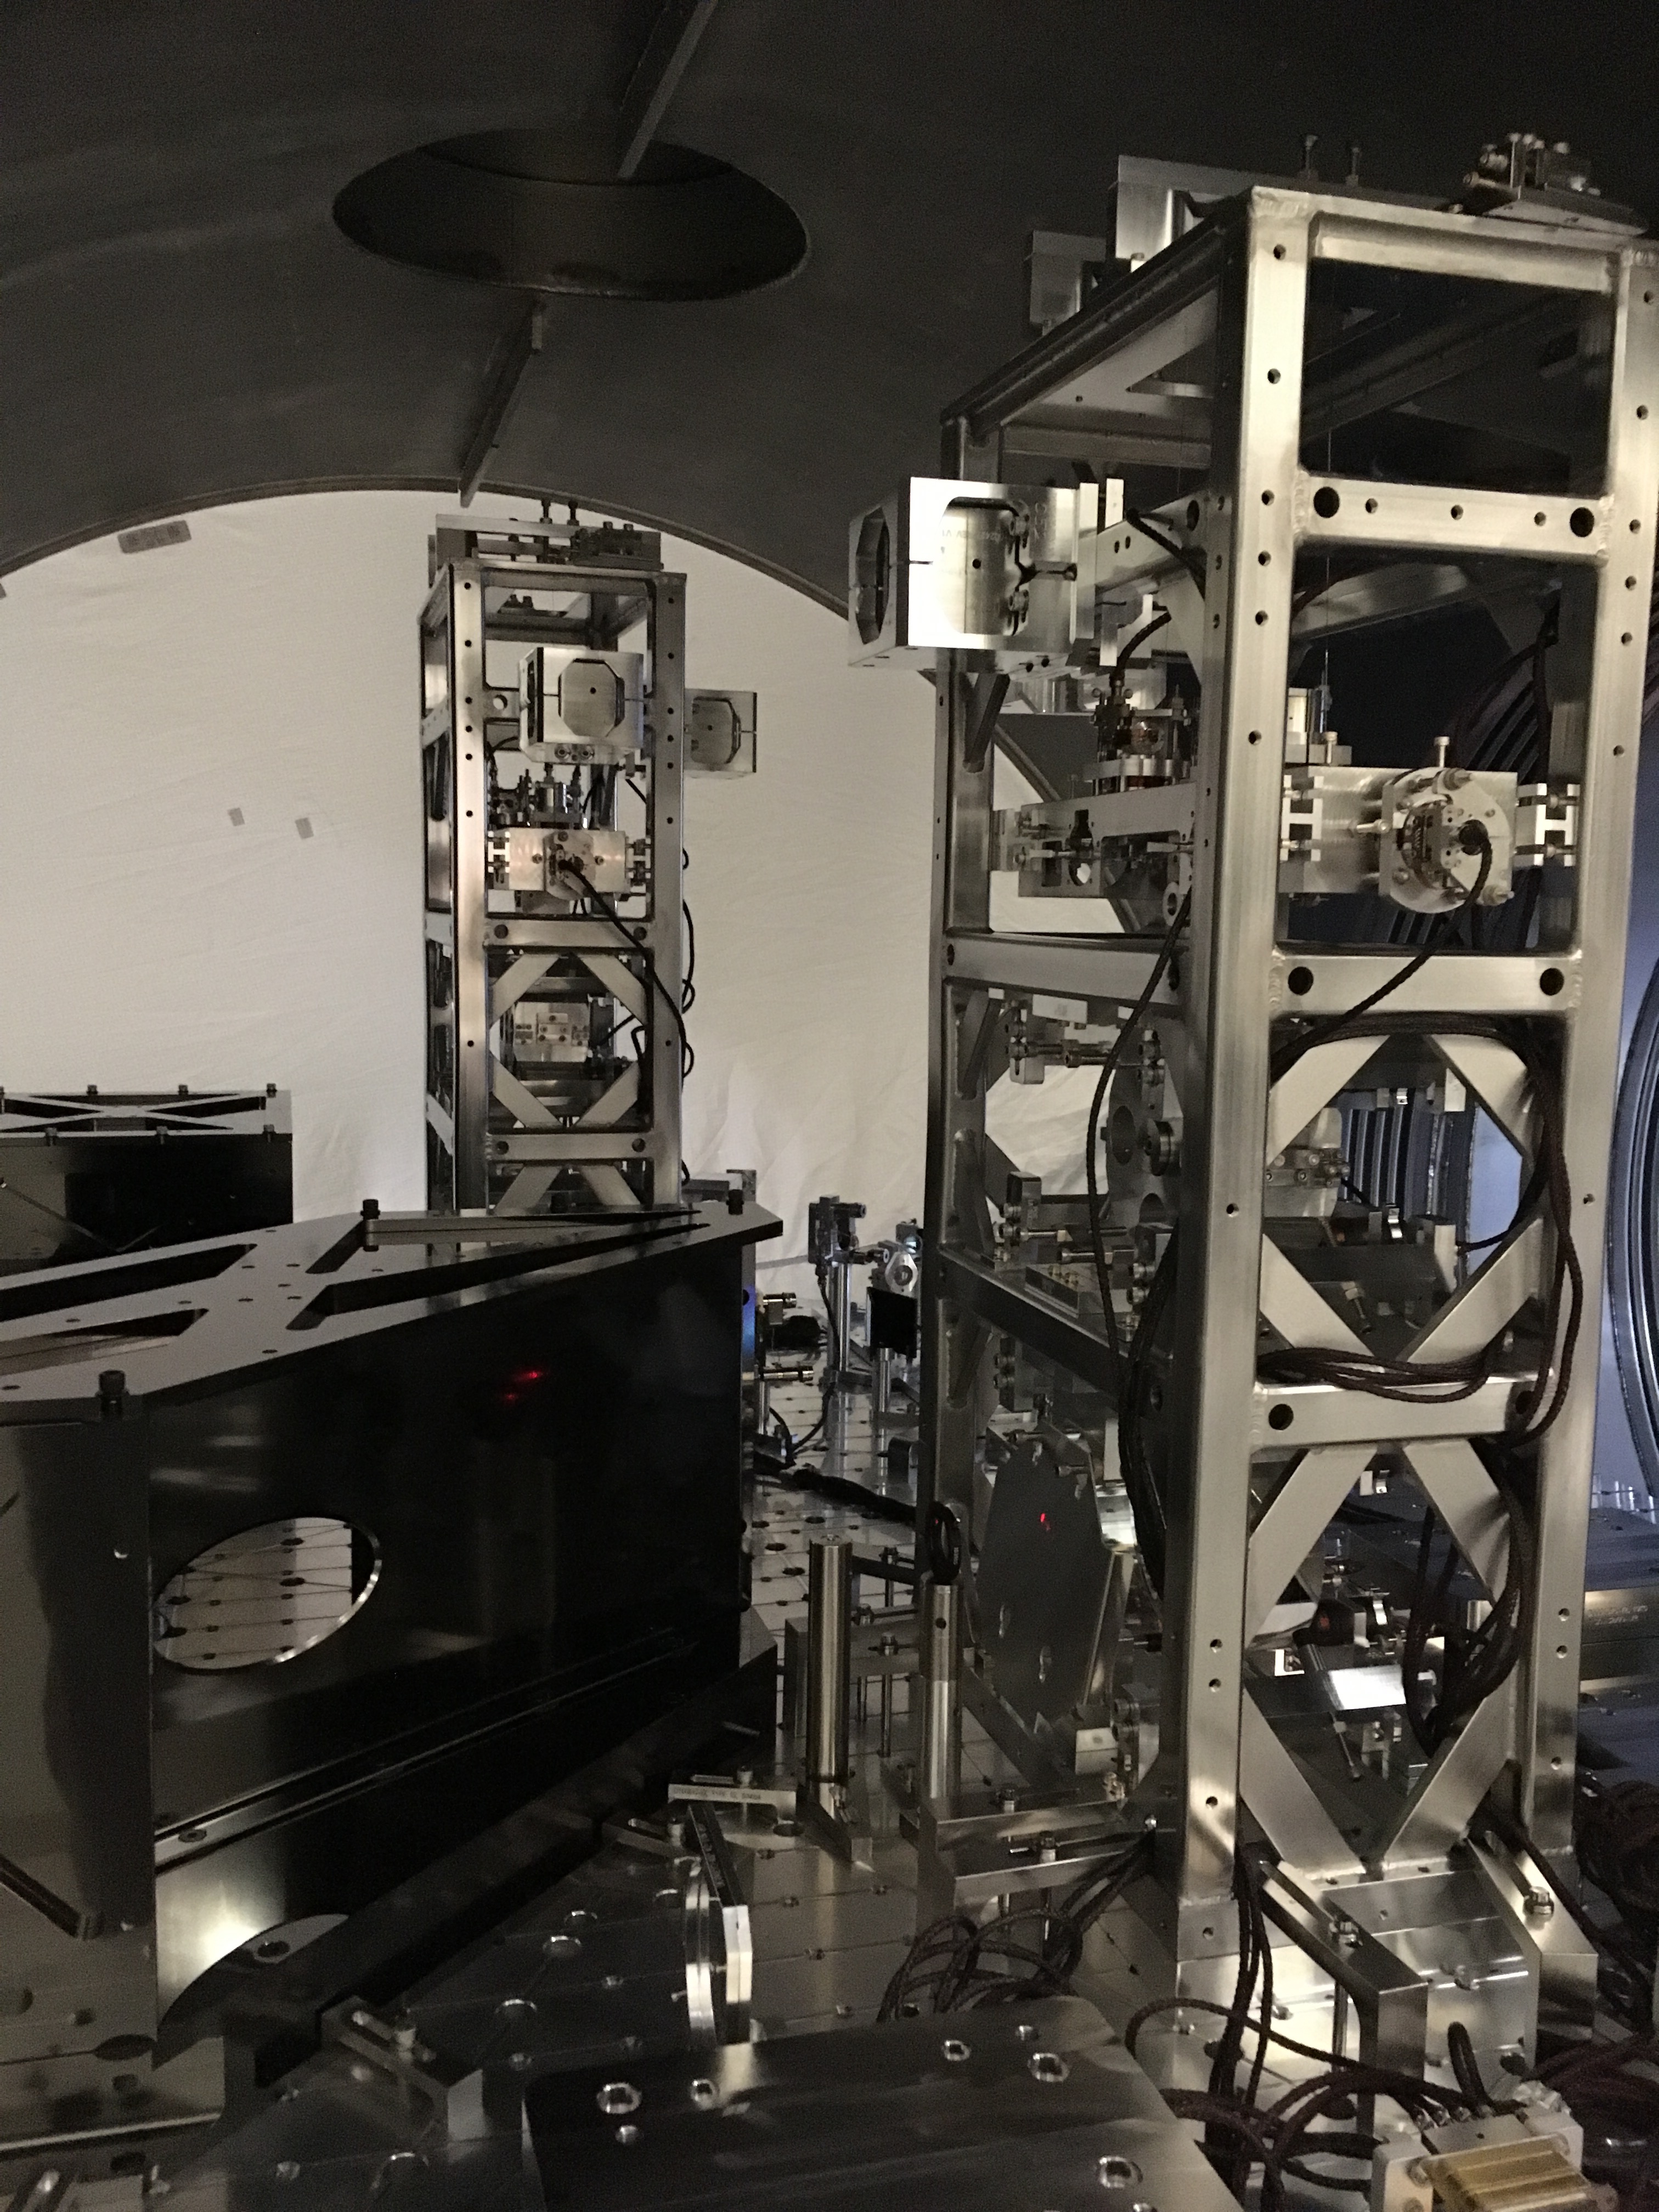
Here're some pictures of HAM3 during the Sept 2017-Feb 2018 vent that show this beam dump. It's a full V of black glass, not just one plate. This supplements the SolidWorks rendering of the camera view found in G1802144.
TITLE: 10/31 Day Shift: 15:00-23:00 UTC (08:00-16:00 PST), all times posted in UTC
STATE of H1: Commissioning
INCOMING OPERATOR: None
LOG:
16:27 TVo and Danny to LVEA HWS table
16:40 Kyle to HAM6 checking interferences
16:47 Terry to ISCT6
16:53 Kyle out
17:15 Ed to HAM7 plugging in microphone
17:53 Corey to cleaning area then optics lab
18:57 Ed done
19:55 TVo and Danny out
20:33 Nutsinee to ISCT6
20:38 TVo and Danny to HWS table
21:32 TVo and Danny out
22:09 TJ to LVEA HAM 1/2 racks
22:12 Chandra to HAM3
22:24 Chandra out
22:31 Sheila and Georgia out
22:33 TJ out
Dan B., TVo, Danny V.
Removed the AC/DC adapter connected to the ITMY HWS camera and disconnected the ITMX HWS camera from the HWS power supply chassis. Both are now replaced with a single 14V DC power supply that is not hooked up to the TCS rack.
Changed both corner HWS camera sync frequencies from 57 Hz to 50 Hz to see if there will be a line in DARM.
At 22W input with RC gain of ~50, we have
| Location | Light Level |
| LSC POP_A | 21.8 mW |
| LSC REFL_A | 9 mW |
| LSC POPAIR_A | 3.4 mW |
| LSC REFLAIR_A | 1.25 mW |
| LSC POPAIR_B | 2.0 mW |
| LSC REFLAIR_B | 2.8 mW |
| ASC REFL_A | 4.1 mW |
| ASC REFL_B | 4.1 mW |
| ASC AS_A | 2.9 mW |
| ASC AS_B | 3.1 mW |
| ASC AS_C | 0.15 mW |
| ASC POP_A | 10.2 mW |
| ASC POP_B | 9.5 mW |
| IMC REFL_A | 0.7 mW |
| IMC WFS_A | 0.33 mW |
| IMC WFS_B | 0.25 mW |
The LSC PDs have a calibration of 40V / 2^16cts / 200Ω / 0.76A/W = 0.0040 mW/ct.
The broadband PDs have a calibration of 20V / 2^16cts / 2000Ω / 0.15A/W = 0.001 mW/ct.
The WFS are RFEL have in low gain with 1kΩ transimpedance, whereas AS and IMC WFS are in high gain (10kΩ). WFS SUM calibration: 40V / 2^16cts / 1000(0)Ω / 0.76A/W = 0.000(0)8 mW/ct.
The QPDs have a calibration of 40V / 2^16cts / 2000Ω / 0.76A/W = 0.0004 mW/ct.
The POP beam towards the quads goes through a 90:10 splitter which dumps 90% of the light. The HAM1 POP beams goes through a 90:10 splitter which sends 90% of the light towards ISCT1.
The HAM1 REFL beam goes through a 90:10 and 1 50:50 splitter, which dump all but ~5% of the light. The next 50:50 splitter sends half towards ISCT1 and half towards the in-vacuum REFL path. The in-vacuum REFL path splits off 50% towards the LSC PD and 25% towards each of the 2 WFS.
The PR2 transmission is 229ppm,
See LLO equivalent table here.
This comparison was made to establish why it appears as though H1's REFL PD has higher light levels than L1, which may be a cause of some of the fast lock losses. Associated with FRS Ticket 11742. A proposed (though not yet approved) fix is put for in ECR E1800316 (associated with IIET Ticket 11724)
Here are plots of the RF power readbacks of the demodulator boards at the REFL port. The units are dBm at the RF input. The sum of the WFS signals are roughly equal to the LSC PD signal (WFS have about a 1.5 greater transimpedance gain). However, the RF levels are extremly variable on the WFS segments with a min-max fluctuation of ~30dB.
Plot 1 shows a 4 hour minute-trend of the last lock stretch. Plot 2 shows a 2 minute interval of full data, however these are only EPICS readbacks. The LSC PD shows some peculiar upwards spikes.
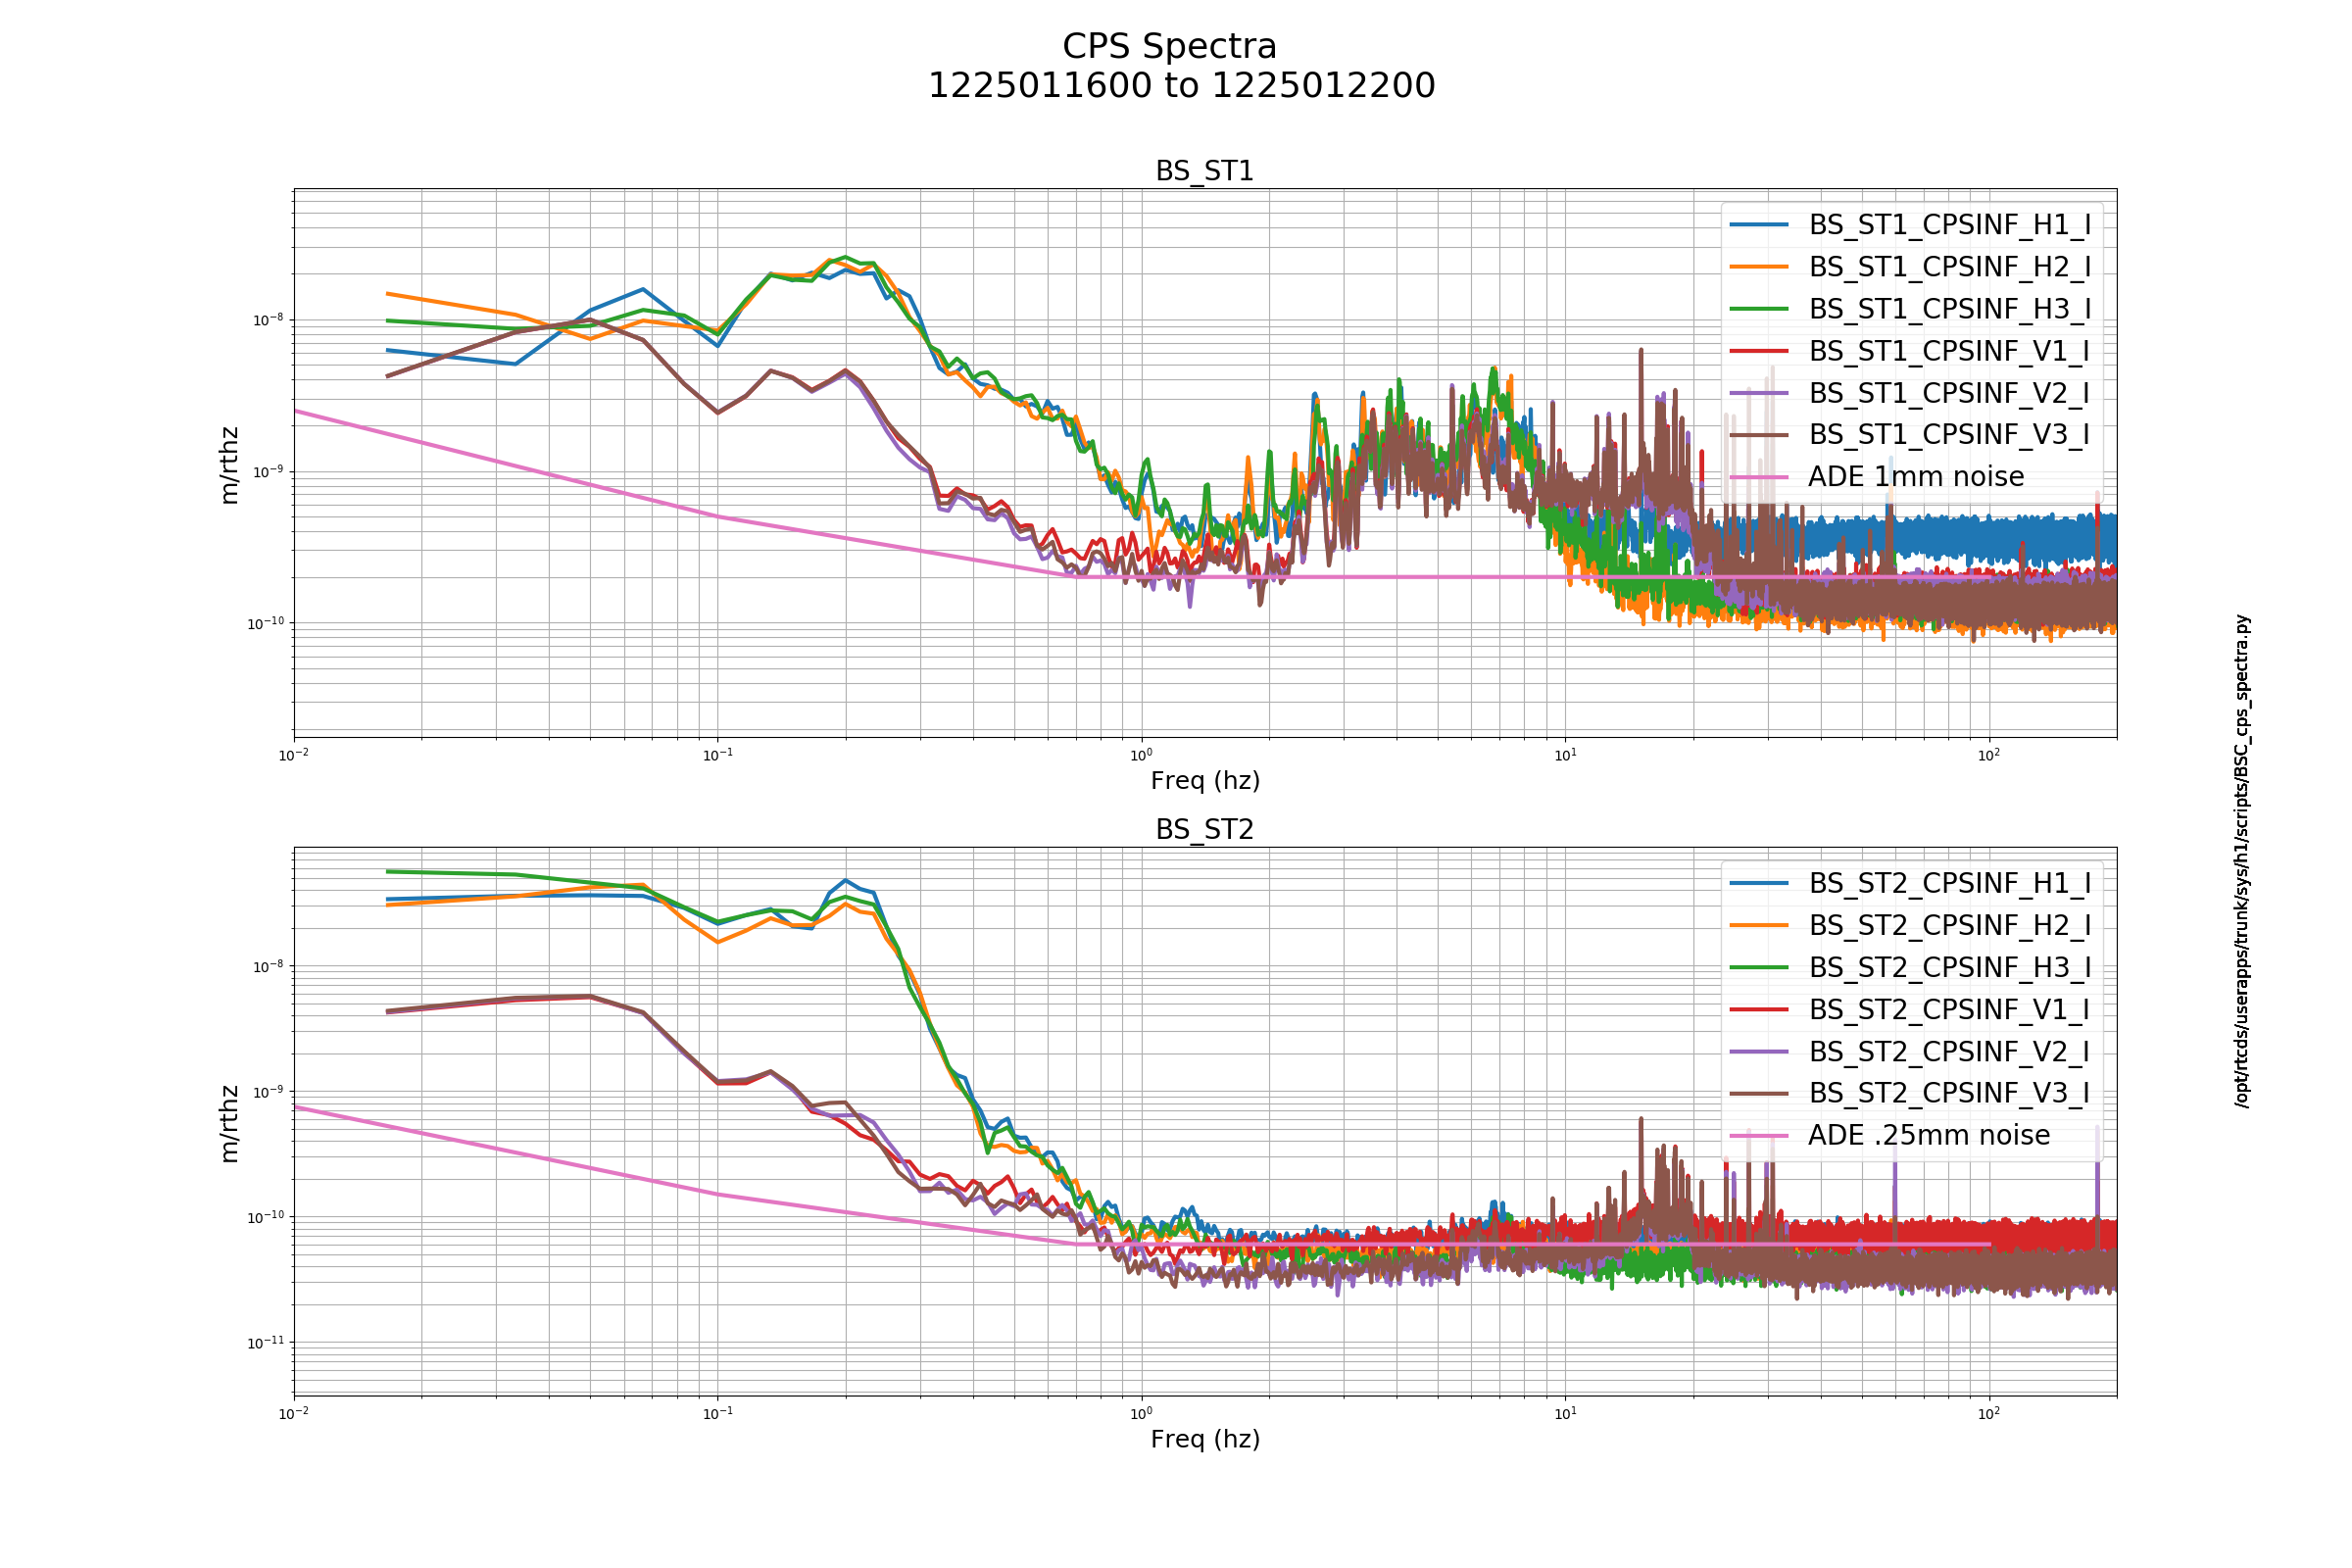
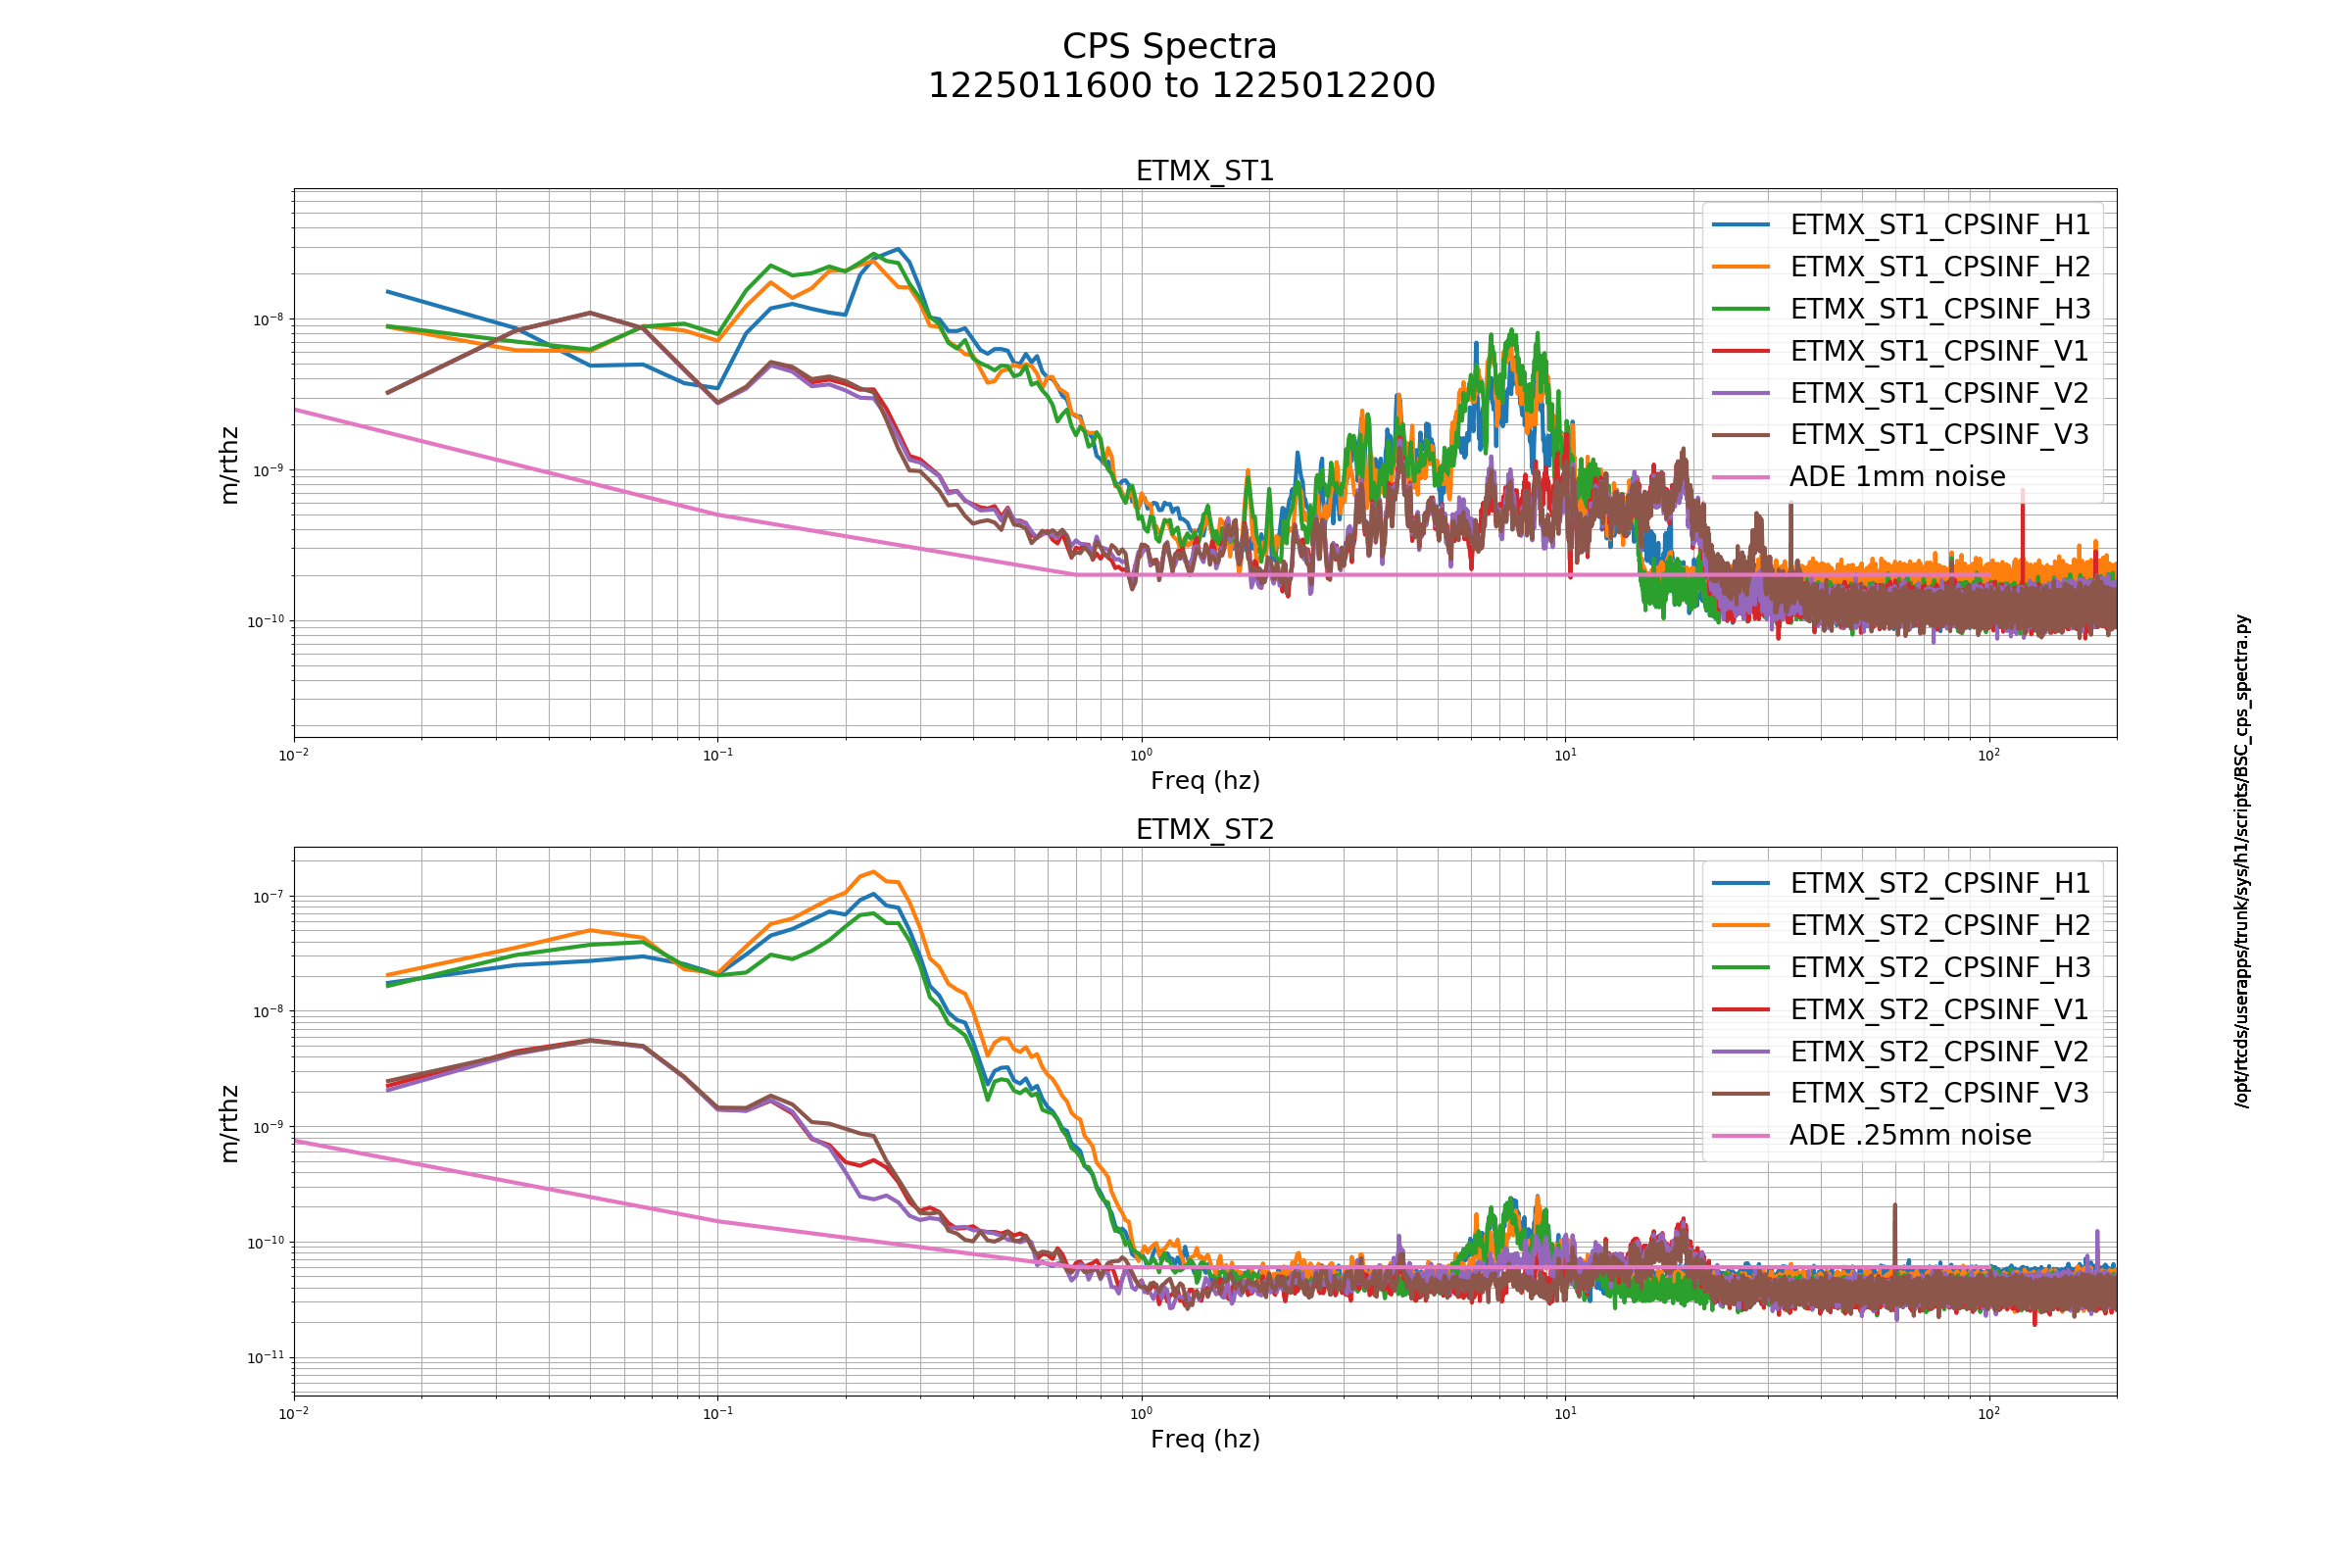
Most look OK to me with the exception of BS ST1 H1 which appears to be rather elevated.
Added 100 mL to the crystal chiller. Diode chiller and filter were good. FAMIS 10481.
IFO was very misaligned this morning, I had to put back the ETMs and ITMs to a position from the last lock. After that done an initial alignment
Tripped HEPI and ISI of end X while trying to switch off the LSC loops, but recovered without issues
Lock acquisition is fine up to ENGAGE_SRC_ASC. The engagement of the soft loops killed the lock twice: the soft offsets are not comaptible with the PRM and/or SRM pointing at 2 W. From the AS port, it seems mostly a DSOFT_P problem.
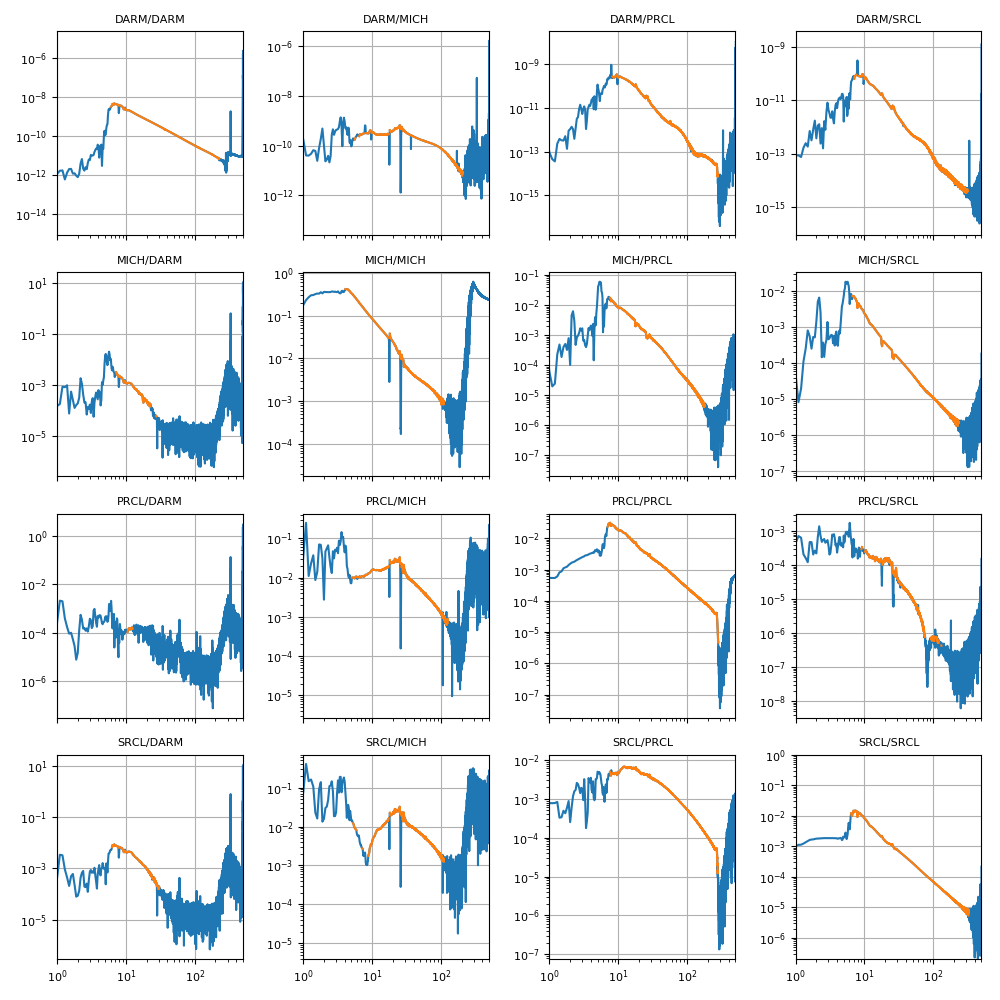
Using the noise injections described in 44868, with the LSC feedforward off, I computed the optical response (sensing matrix) of the LSC error signals, which is the calibrate response in cts/um of each of the XXXX_IN1 signals. I could get a good measurements for most of the elements of the 4x4 matrix, at frequencies between ~10 Hz and ~200 Hz.
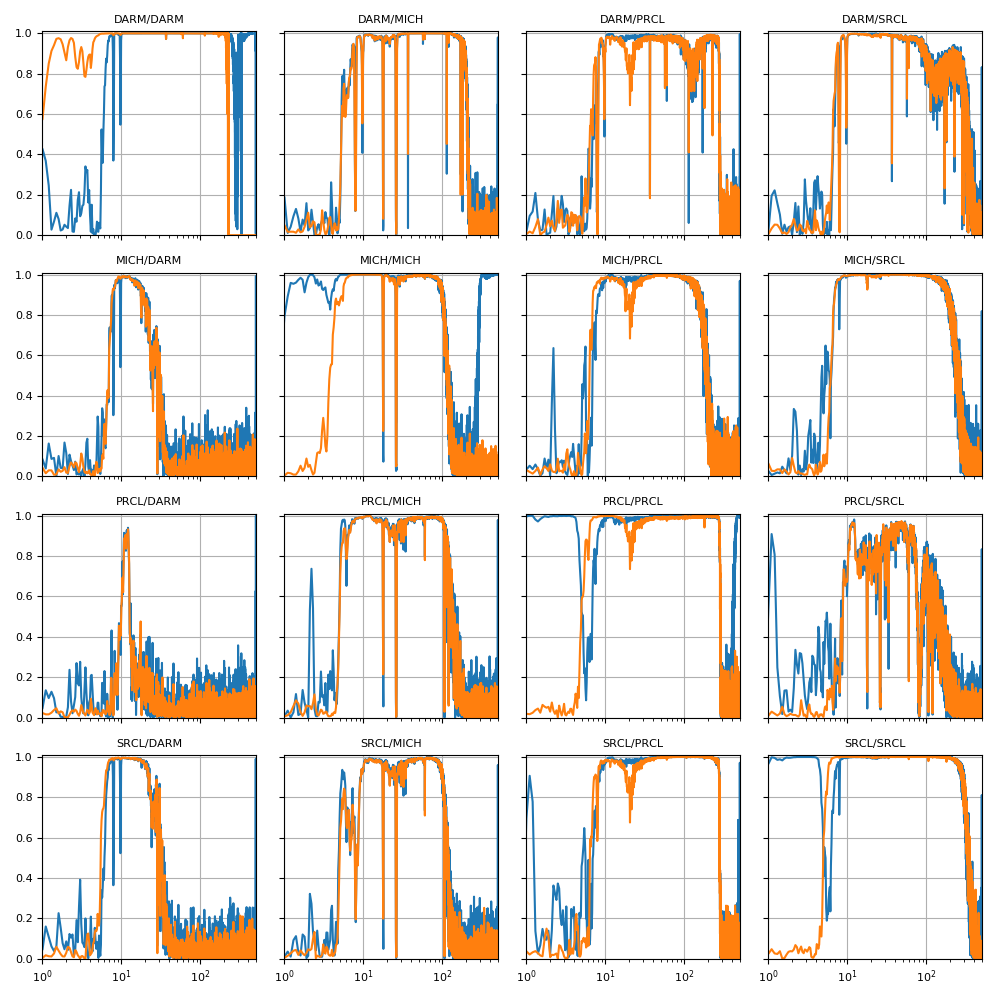
First of all, here is the coherence and transfer function matrices for the measurements. What is shown here is:
(left) coherence between injected excitation and input signals in orange (for example DARM_IN1 / DARM_EXC) and between the LSC control output and the LSC inputs in blue (for example DARM_OUT / DARM_EXC). This coherence matrix gives you a idea of where the measurements are good;
(right) transfer functions between the LSC output and the LSC input, in blue for all frequencies, in orange where there is coherence above 0.7.
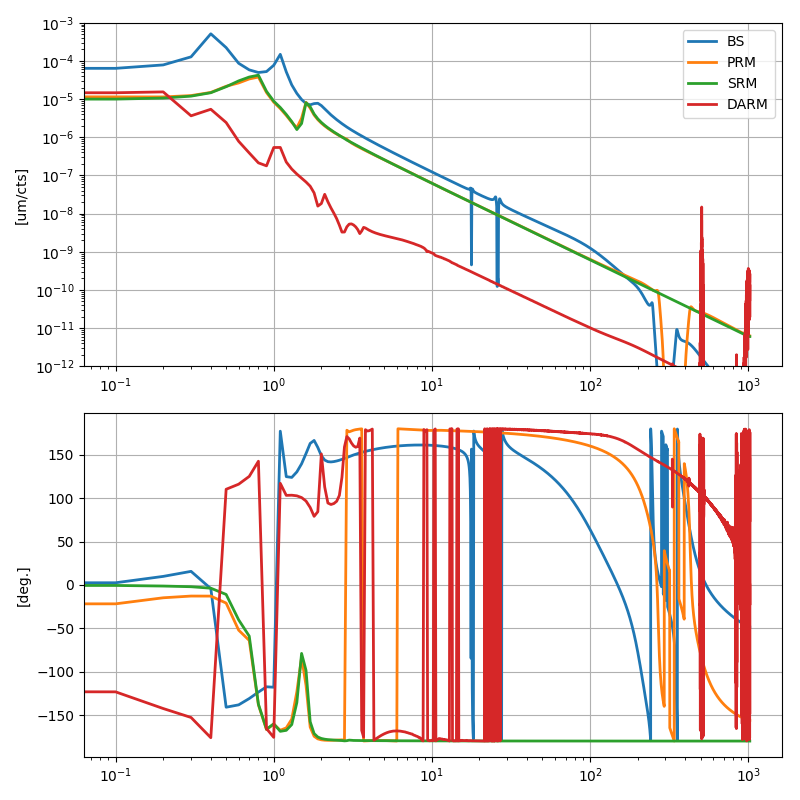
To extract the optical gain matrix (the response of input signals to actual d.o.f. motions in microns), I needed a model of the suspension response. Being lazy, I decided to cheat and use the model already implemented in the CAL system: for BS, PRM and SRM I copied the suspension model for M1, M2 and M3 stages from the CAL system. For DARM, since the model is much more complicated, I simply measured the transfer function between H1:CAL-DARM_CTRL_DBL_DQ and H1:CAL-DELTAL_CTRL_DBL_DQ while locked. To avoid numerical issues, I had to use 1000s long FFTs. As a by-product of this analysis, I updated the filters used in the CAL model, to match what is actually being used now in the SUS models (see 44891). Here are the suspension responses in microns over cts (at the ISC input point):
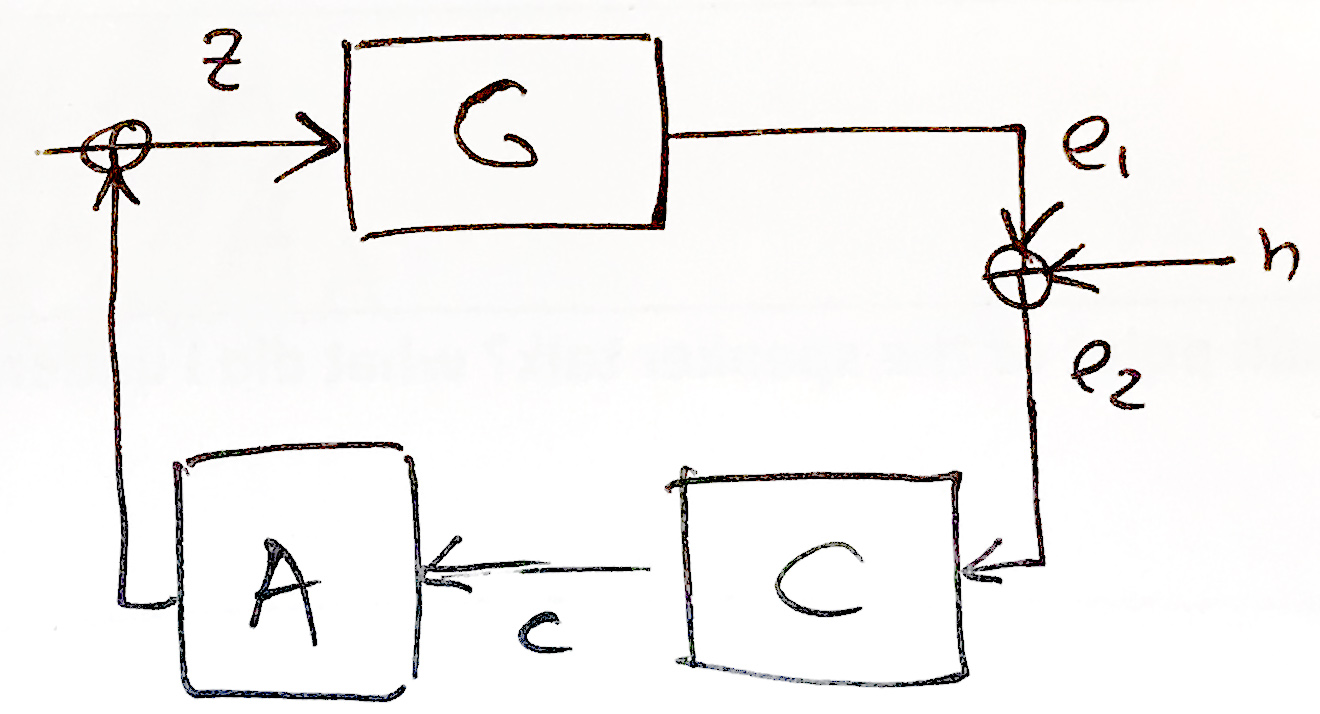
The transfer function matrix is measured between the LSC output and the LSC input. Where the signals are dominated by the injected excitation, the measurement is simply the product of the optical matrix (G) and the actuation matrix (A). In the scheme below, C is the control filter matrix. Here it is important to note that our MICH actuation is actually going only to the BS, so it is really a mixture of MICH, PRCL and SRCL actuation.
The resulting sensing matrix is shown below, in cts/um.
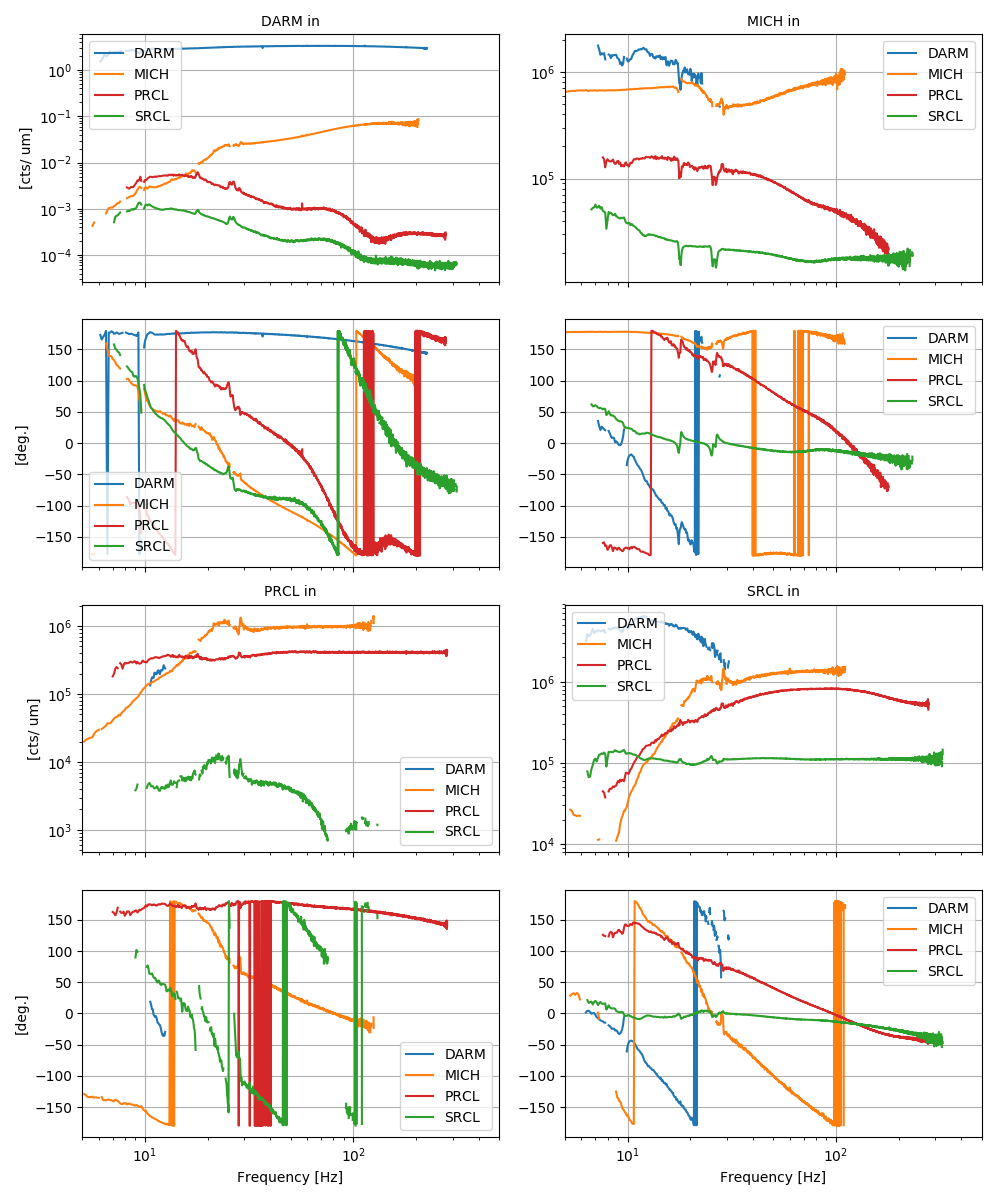
Each panel shows the response (magnitude and phase) of one of the LSC error signal, as noted in the title. For each panel, each trace then is the contribution coming from one of the LSC d.o.f.s (noted in the legend).
The response of each error signal to the "main" degree of freedom is more or less as expected. I updated the CAL error signal calibration with the new numbers, and as noted in 44891 the differences are small.
Some things are as expected, some other are a bit surprising. For example:
Finally, the plot below shows a table of the open loop gains, computed at the displacement point, i.e. each panel show DOF_Z_before_noise / DOF_Z_after_noise. The diagonal terms are as expected the open loop gains of the loops. The off-diagonal terms should be small in a ideally diagonalized MIMO system. However, here it's clear that some of the contributions are quite large: the MICH/PRCL/SRCL matrix has quite large elements at low frequencies (below 20-30 Hz). Also the DARM contribution to some d.o.f.s is much larger than expected. I am not sure how to interpreter this.
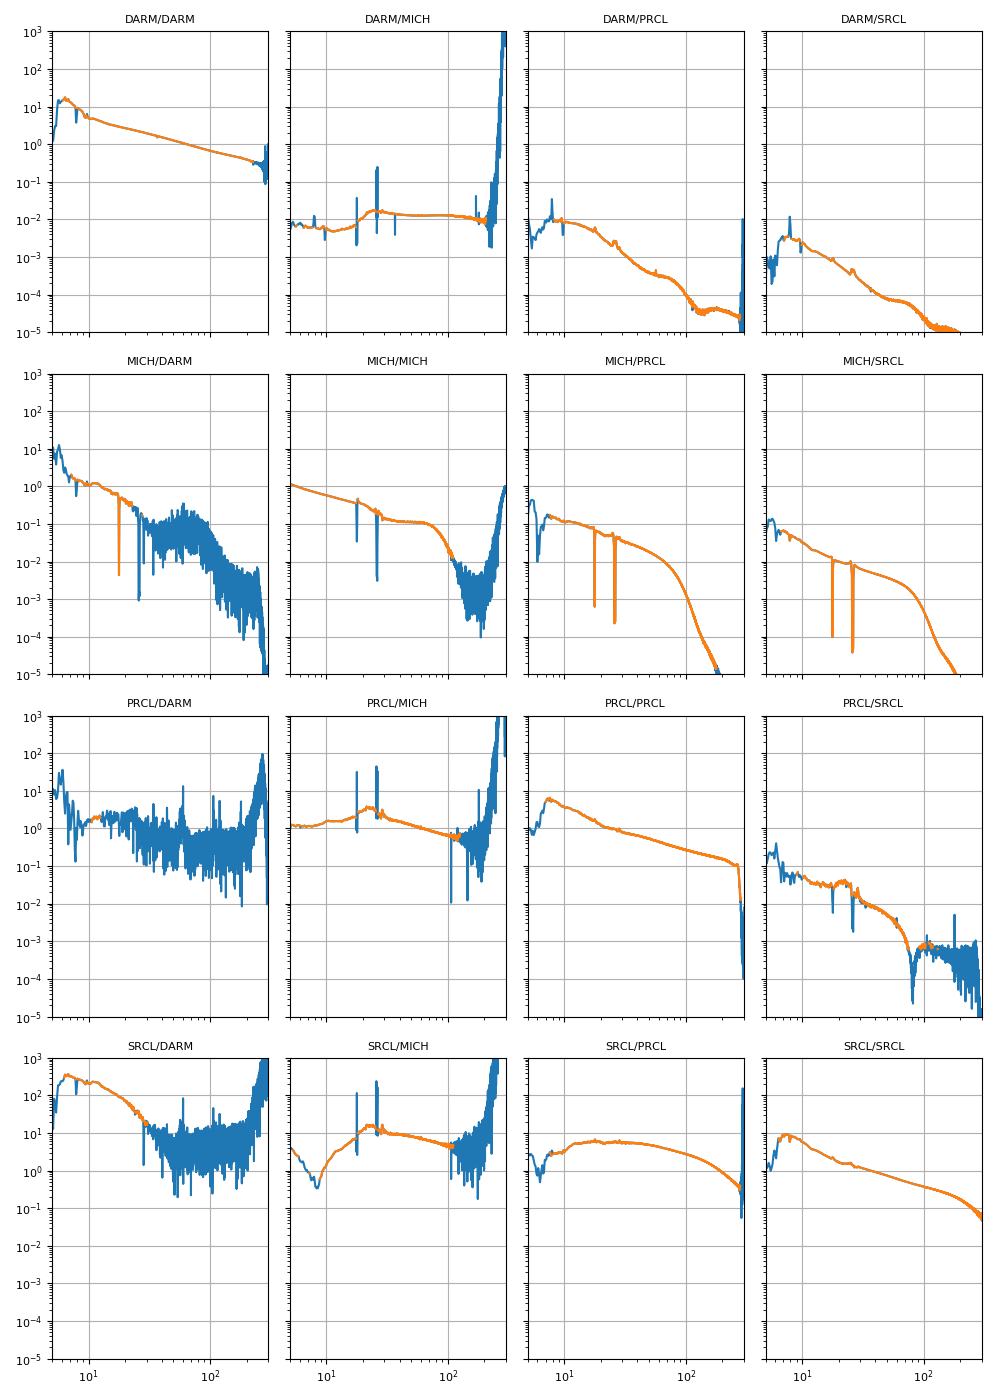
As before, blue are all points, but orange are only the frequencies with coherence.
Sheila, Georgia, Craig, Jamie, Keita
Summary:
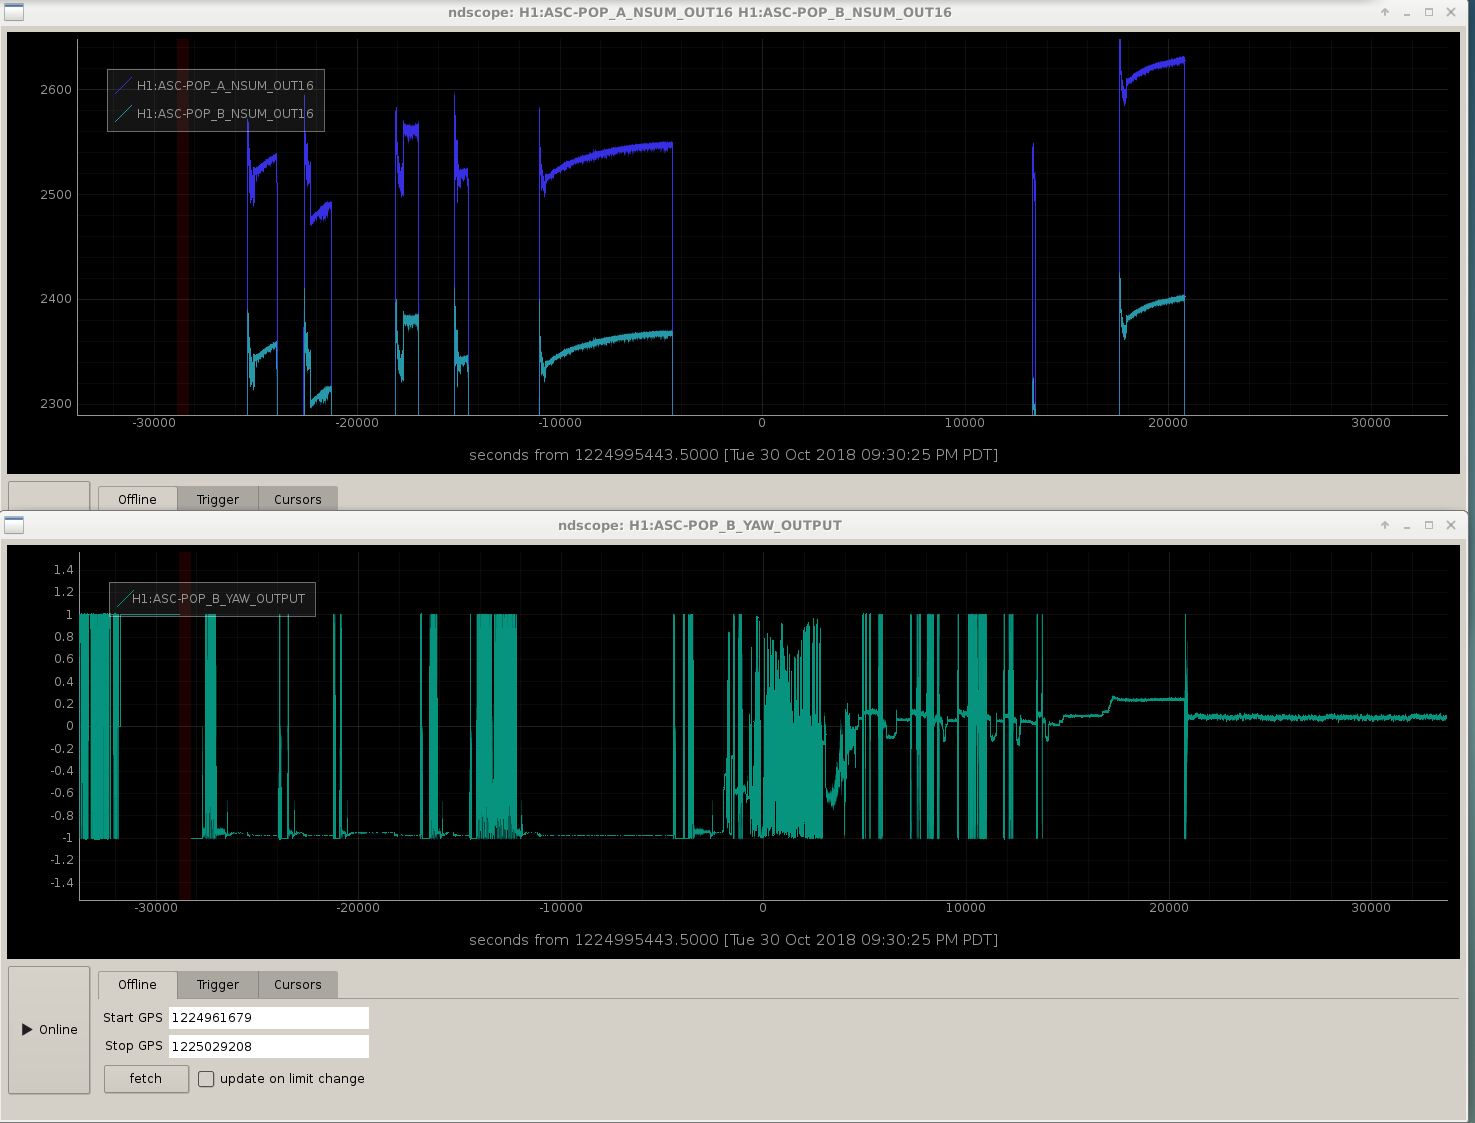
We picomotored the POP QPDs so that we are now on both QPDs, we had some difficulties doing this but we think that we have recovered and reset the QPD offsets to a reasonable place.
Details:
After we saw the coupling of HAM3 motion to PRCL and DARM that Georgia is writing about, Keita pointed out that scattered light in the POP QPD path could easily couple to the LSC POP path. Since the beam was falling off POP B which we don't use in loop, I attempted to use the pico's while we were locked at low noise.
Side note about PRC2 cut offs:
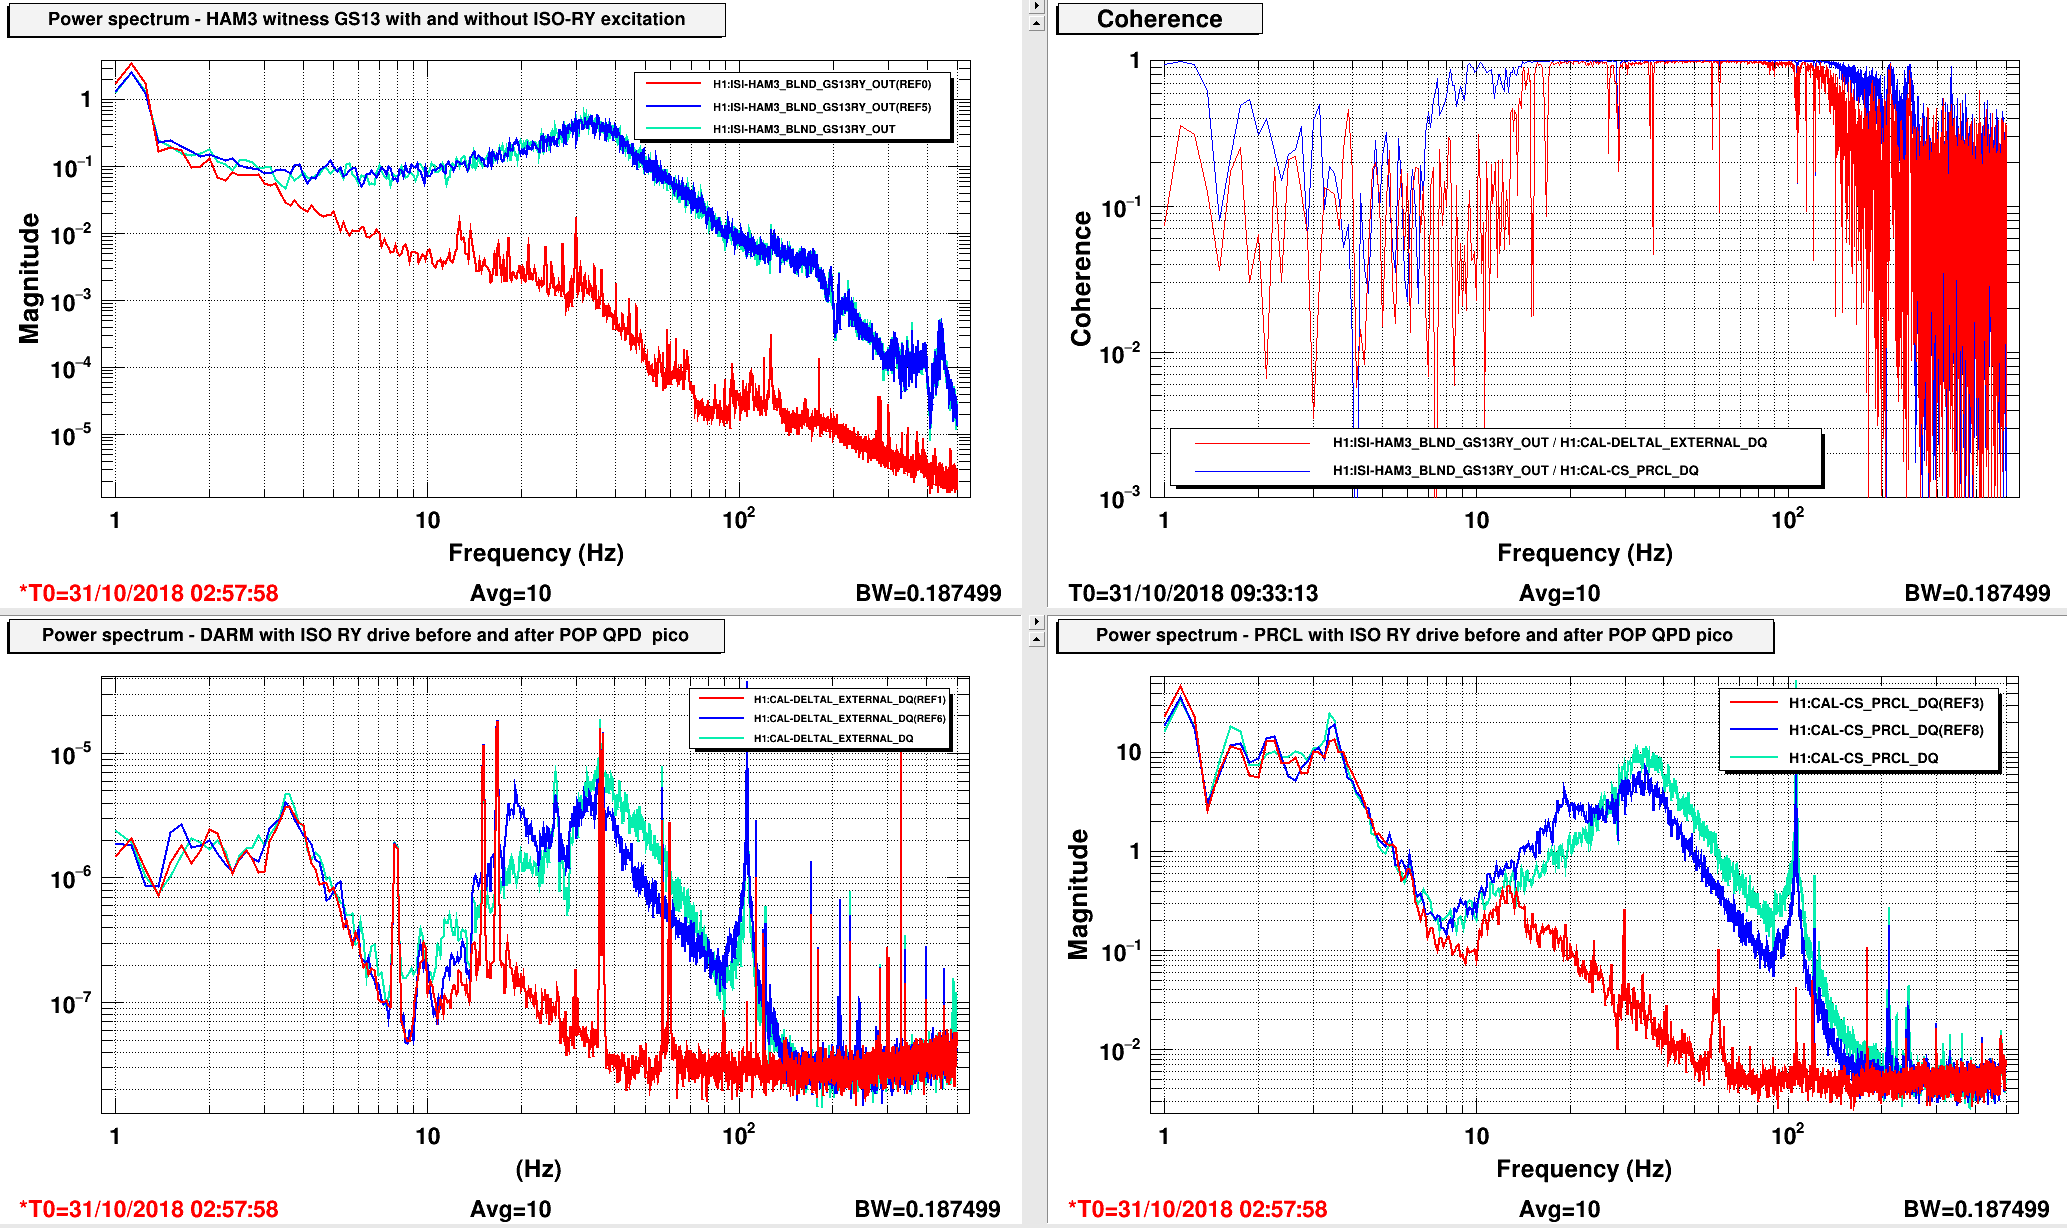
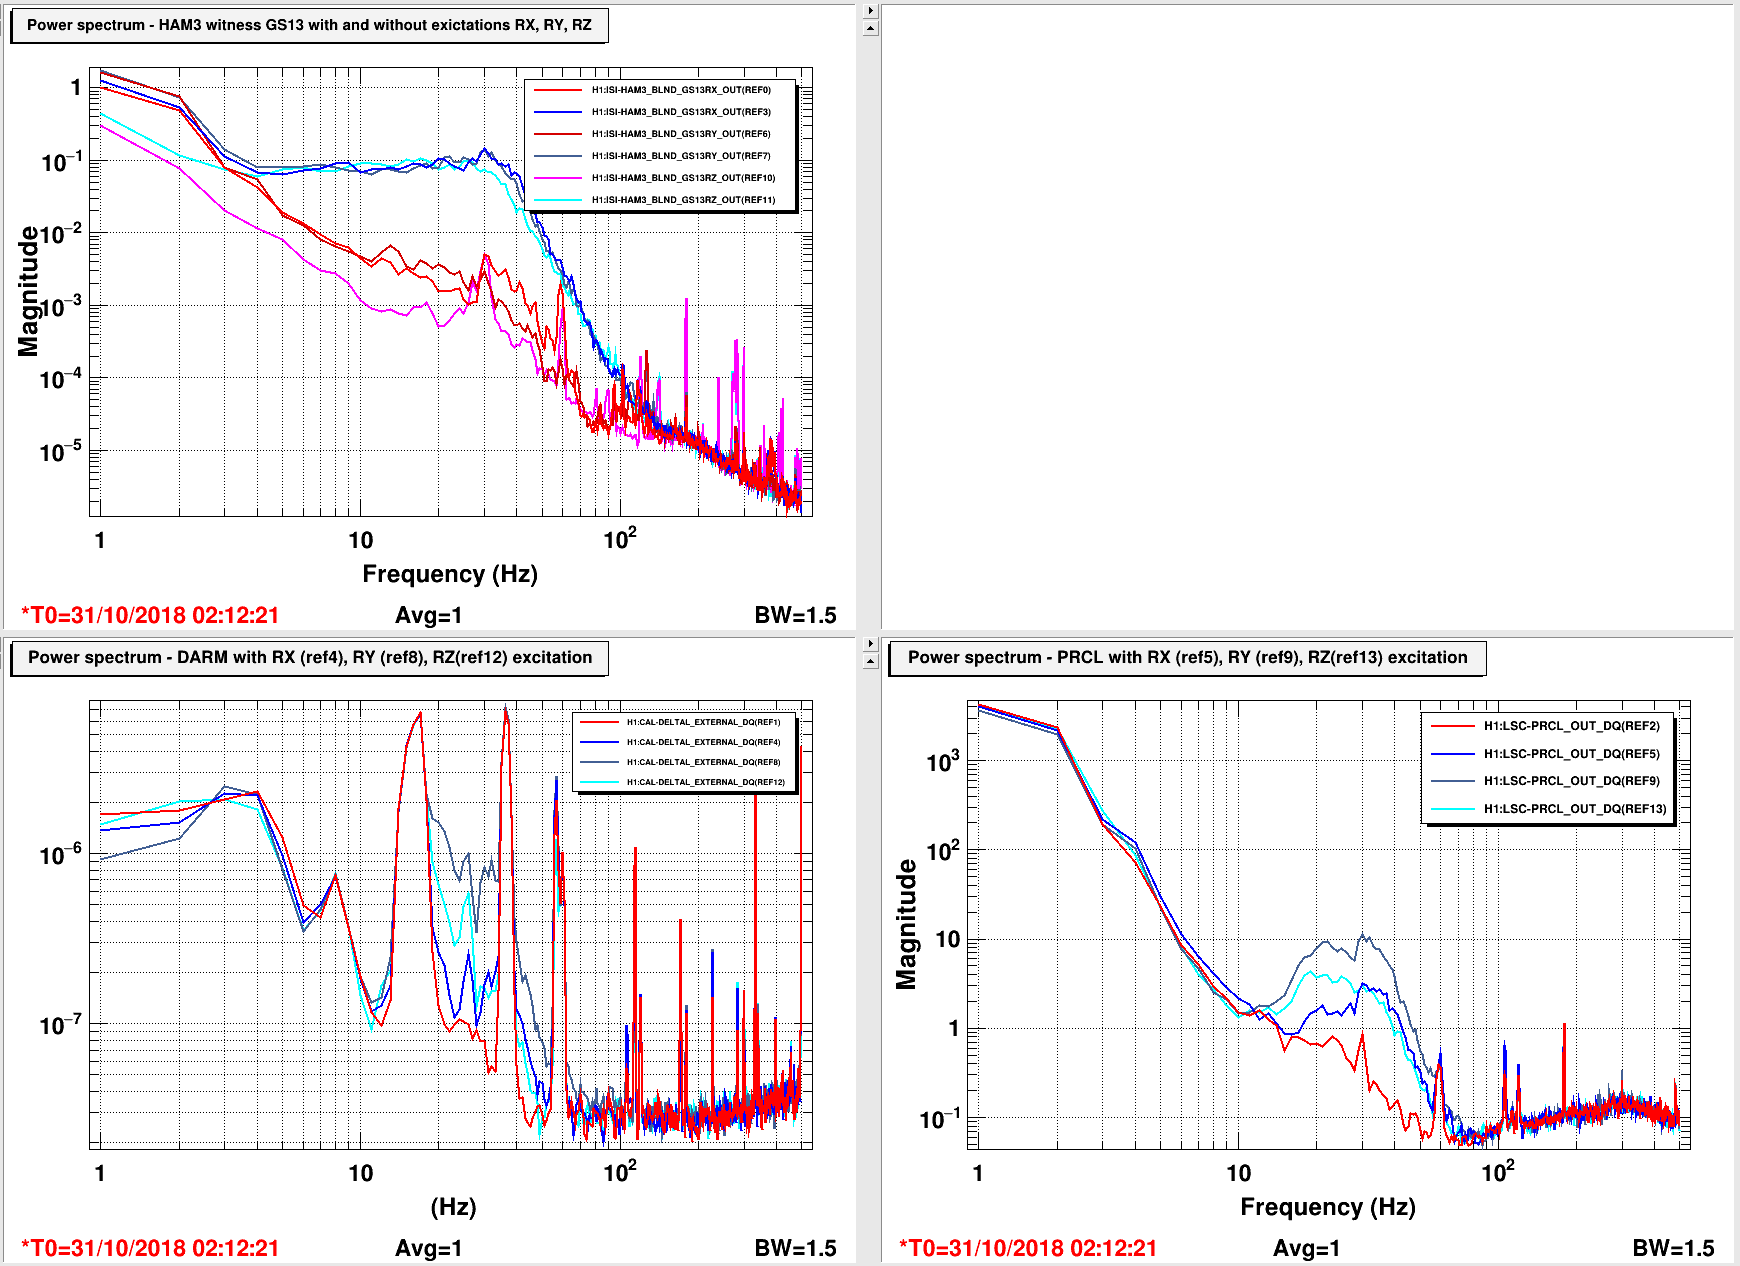
Attaching spectra of DARM and PRCL while HAM3 ISI RY is driven (bottom left and right plots). Dark blue is earlier tonight, before pico'ing onto the POP QPD. Mint green is later tonight, after pico'ing - note the IFO alignment changed between these measurements, we don't know the origin of the change in coupling. More details on this measurement in alog-44939.
After pico-ing, POPA SUM increased by about 3%, POPB about 1%.
Sheila, Georgia
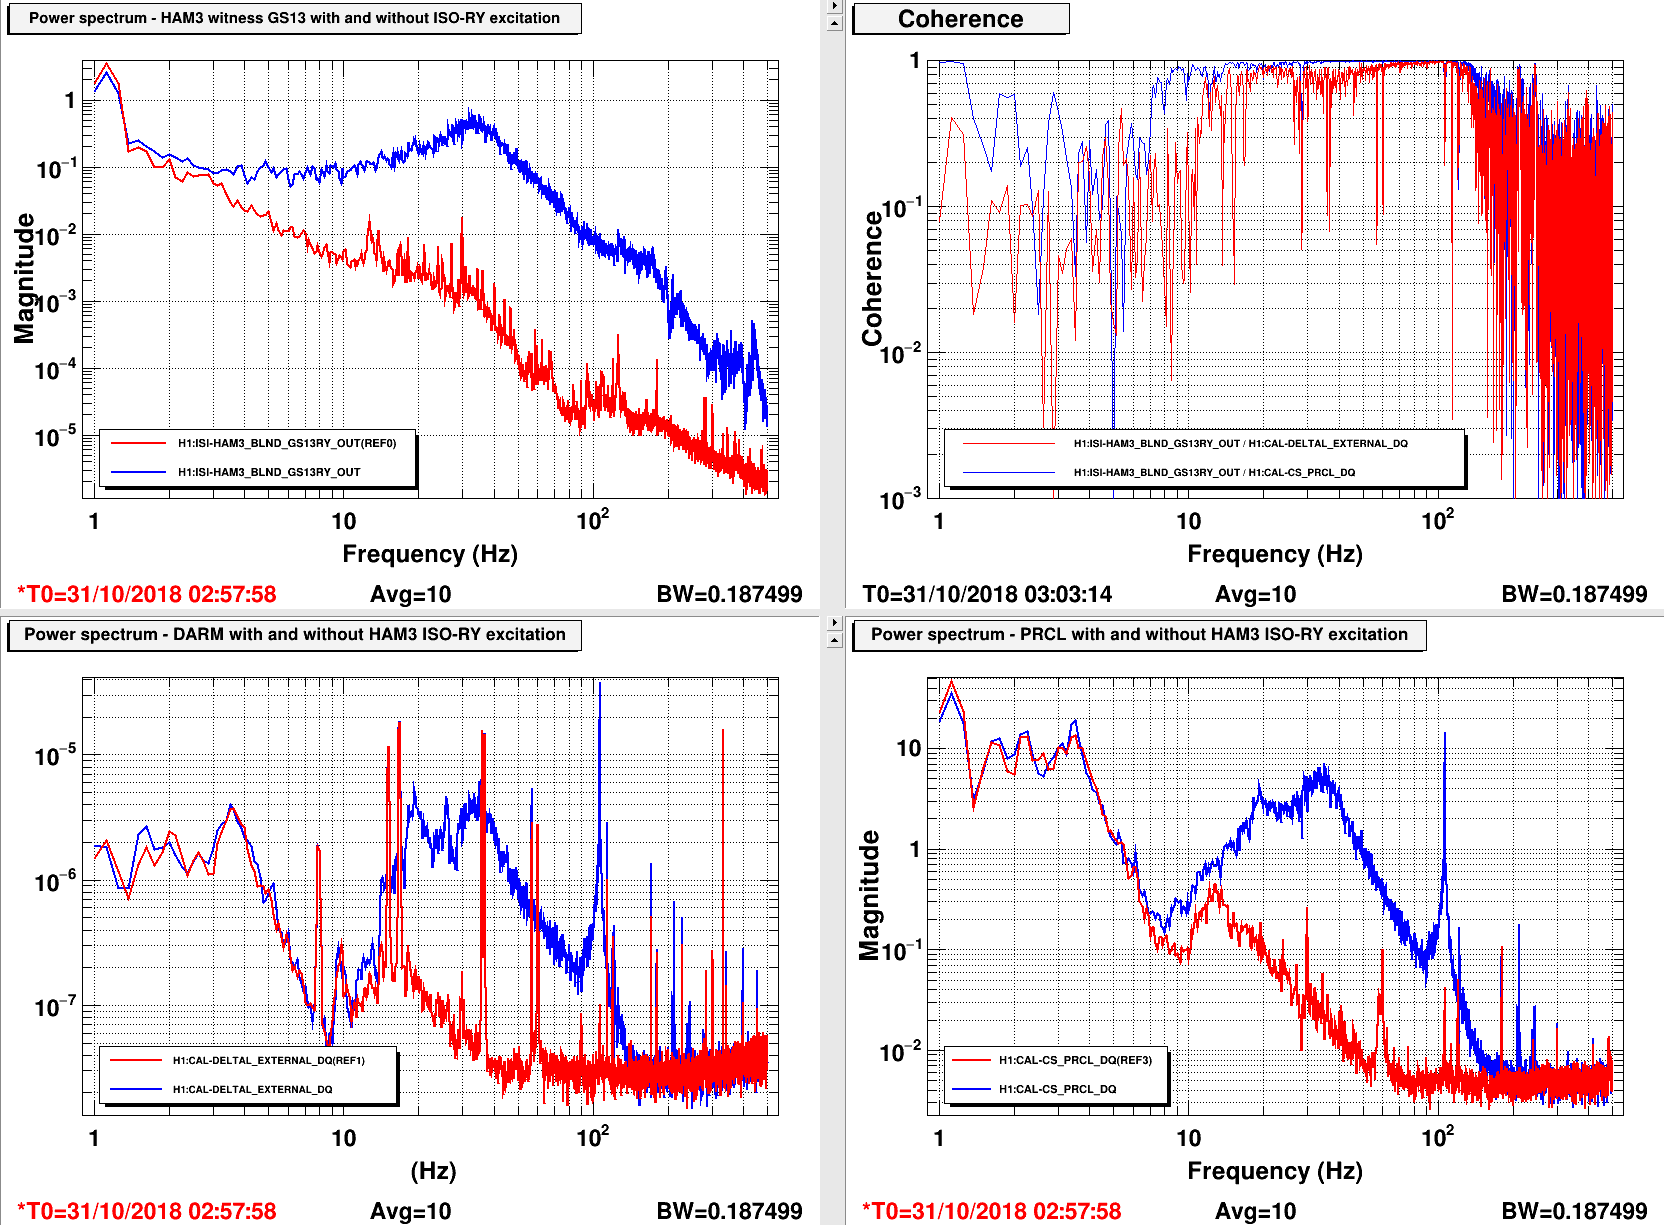
We ran a similar to test to what Sheila did last week to check for HAM1 coupling to DARM, but this time on the HAM3 ISI. The coupling of HAM3 ISI motion to the length degrees of freedom is significant, and is possibly the limiting noise source for PRCL around 30-40 Hz. We're not sure yet whether this coupling is due to clipping or backscatter or something else.
---
We ran a band-limited white noise excitation to the RX RY and RZ degrees of freedom at the ST1-ISO stage of the ISI. The excitations had ~2 orders of magnitude clearance over the ambient noise of the GS13 blend signal, which we used as a witness sensor. The coupling was seen when driving RX RY and RZ, but most strongly for RY. The driven noise was seen in MICH, PRCL, SRCL, and DARM.
The first attachment shows RY GS13 signal with and without the excitation (top left), showing the magnitude and frequency of the excitation; DARM noise (bottom left); PRCL noise (bottom right); and coherence between DARM and the GS13 signal, and PRCL and the GS13 signal (top right). I'm not 100% sure, but I think the peak just above 100Hz was unrelated to the excitation.
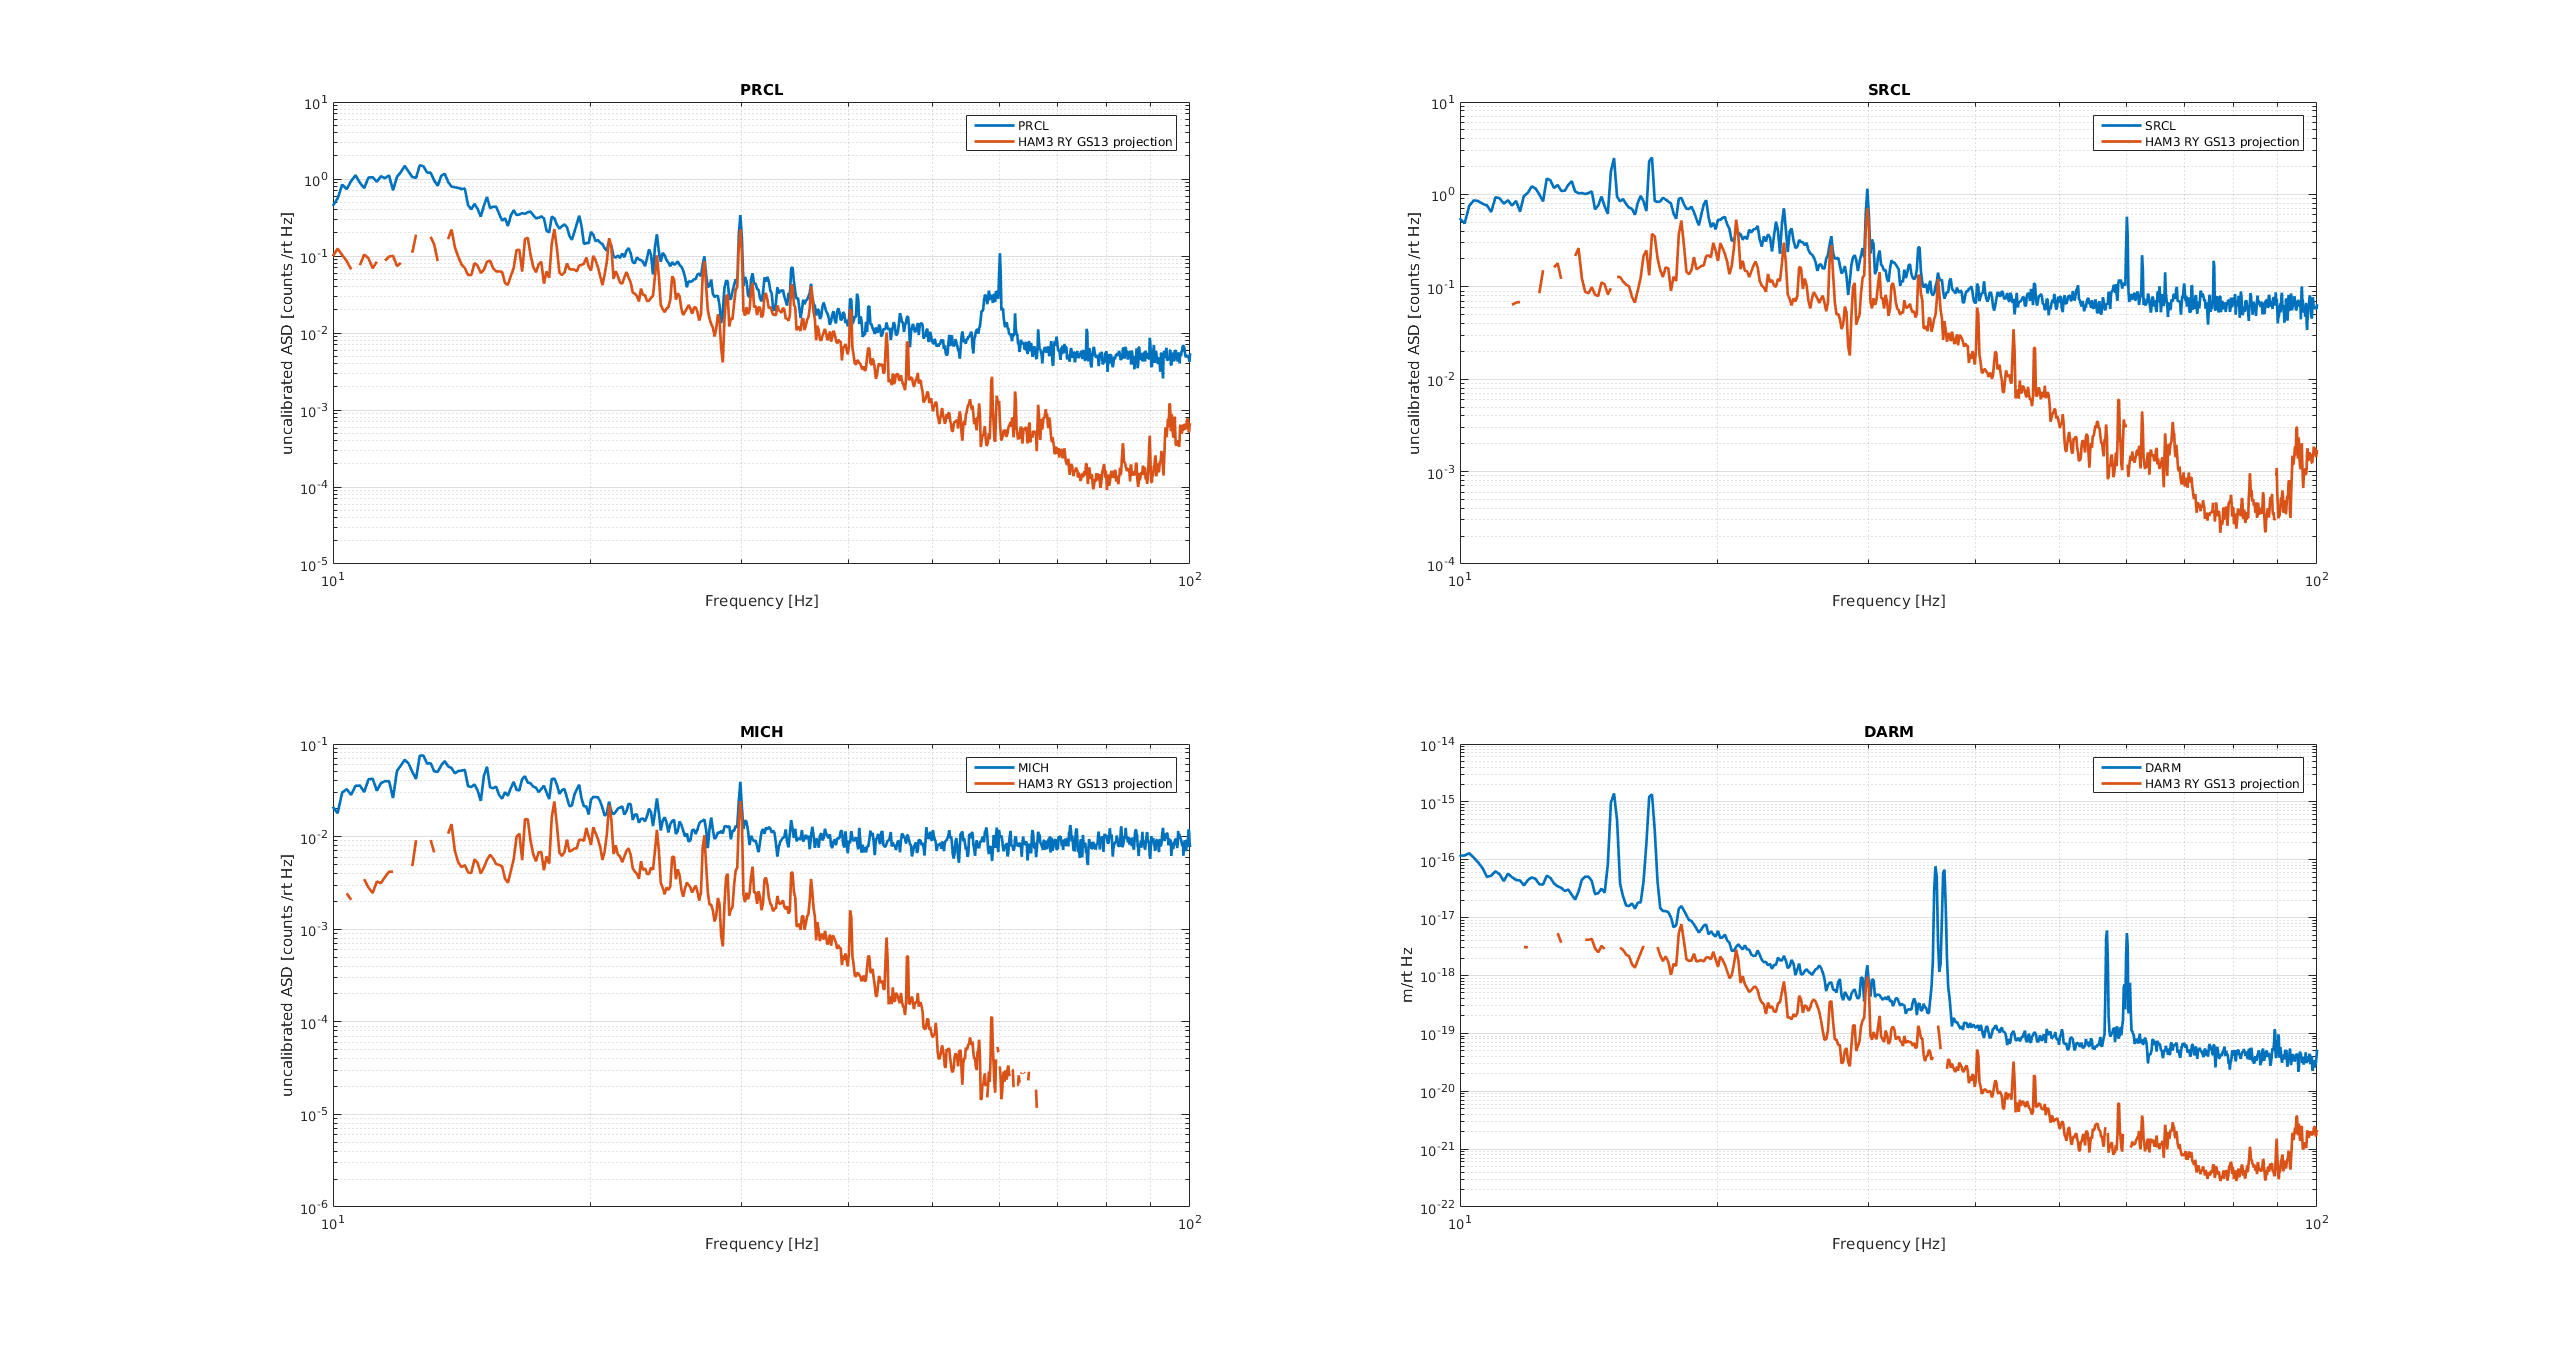
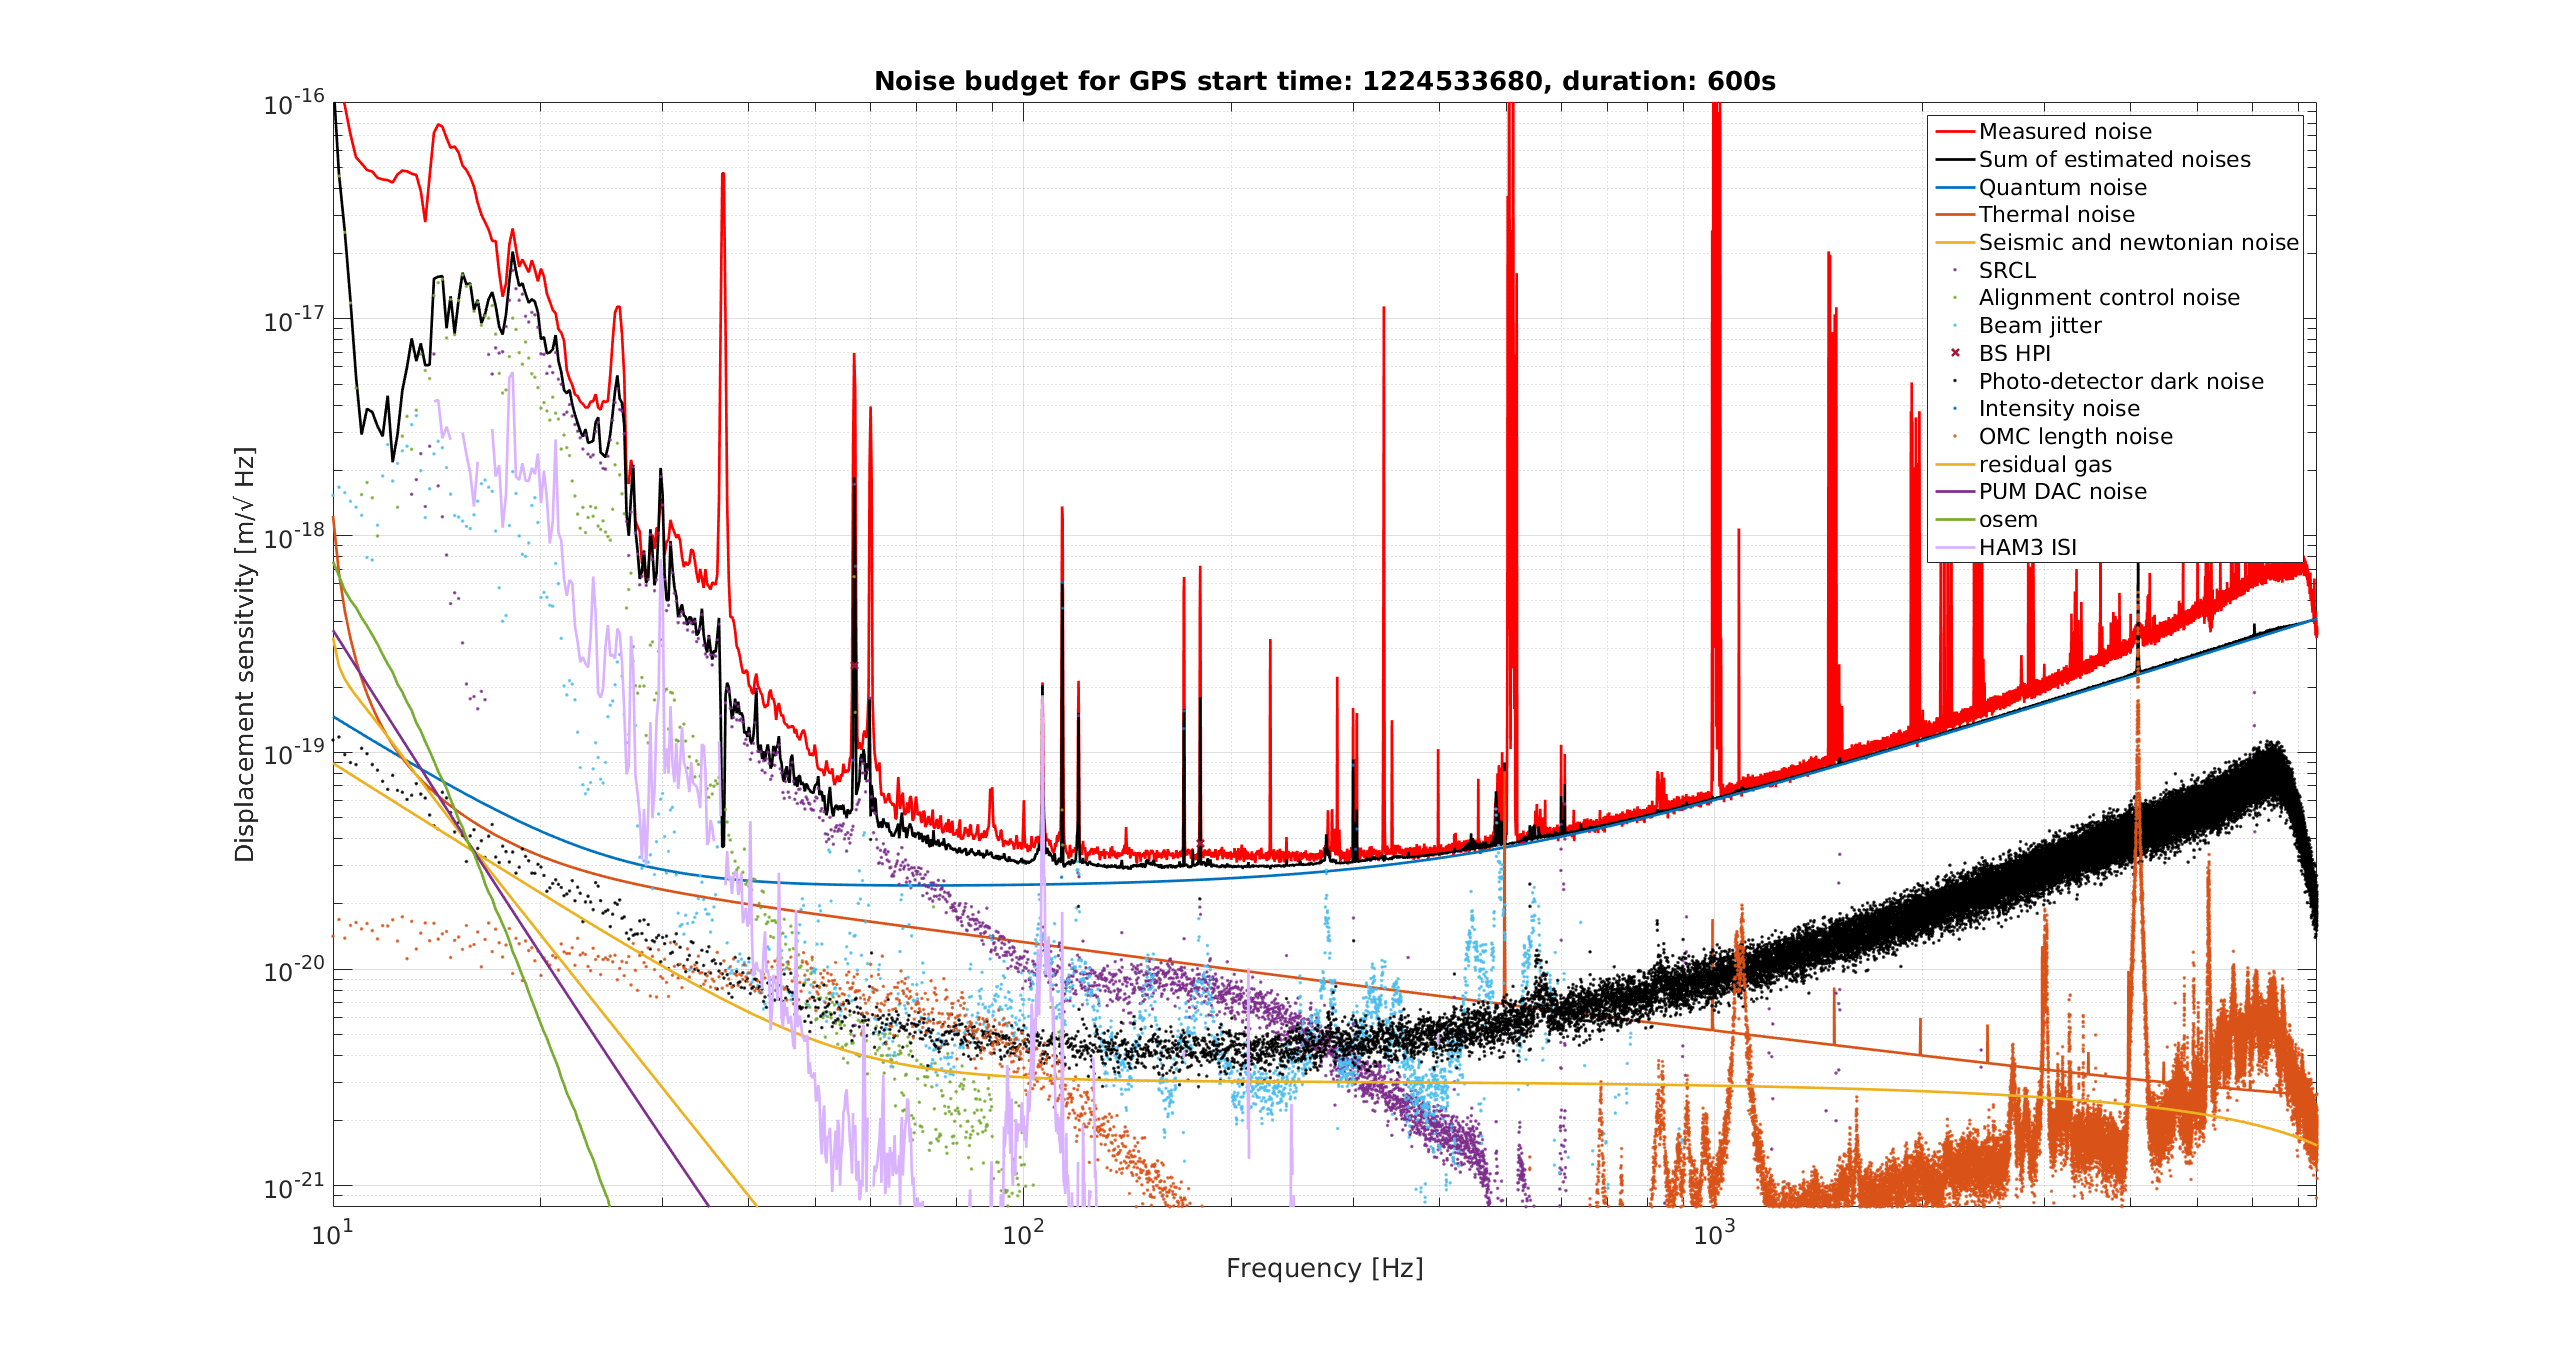
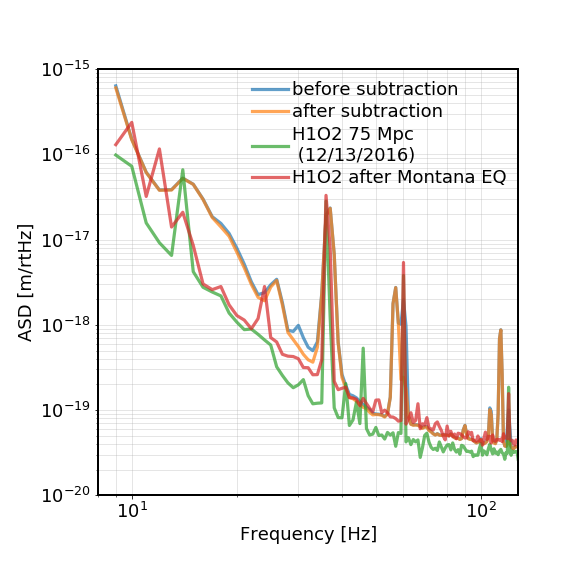
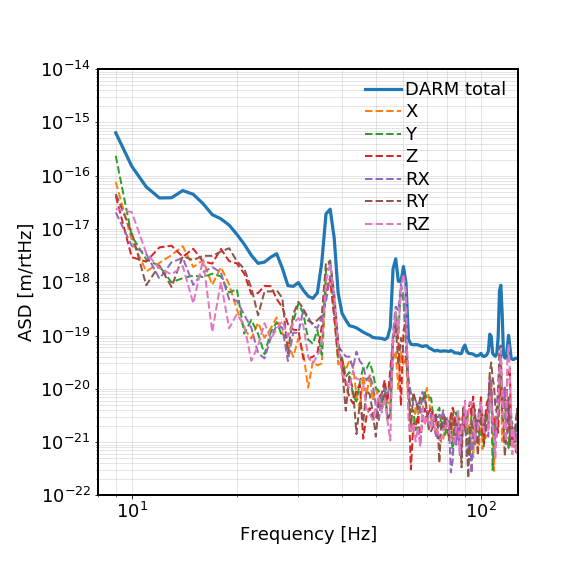
I used Sheila's noise projection script to project the ambient HAM3-ISI noise into DARM, SRCL, MICH, and PRCL, (attachment 2), the noise projected into PRCL is uncomfortably close to the actual PRCL noise. For fun we also added this to the noise budget (attachment 3).
Attachment 4 shows the result of similar drives to RX RY and RZ, with the coupling to DARM and PRCL, showing the largest coupling for RY.
We did a similar test on HAM2 ISI RX, and did not see significant coupling to DARM or PRCL, but we didn't try driving the other degrees of freedom.
Georgia, Sheila -
FWIW, there are some channels you can use which are probably simpler. You probably know this, already, but I'll put it here in case a Fellow or someone from Detchar is able to help you out. The Blend input calibration is useful for debugging control, but to look at the motion, it is simpler to use the Calibrated Cartesian channels:
H1:ISI-chamber_CAL_CART_dof_OUT_DQ,
eg, 'H1:ISI-HAM3_CAL_CART_X_OUT_DQ' or 'H1:ISI-HAM3_CAL_CART_RY_OUT_DQ'.
These are the same GS-13 signals, but are calibrated as 1 nm/count at frequencies above 10 mHz.
Details of the low frequency rolloff are in LHO aLog 4553.
These are used to make the Suspension point motions for each optic, eg 'H1:ISI-HAM3_SUSPOINT_PR2_EUL_L_DQ' (see T1100617)
These SusPoint channels are then used to make the IFO-basis version of the relative motion at the top of the suspensions (see T1500610),
eg. 'H1:OAF-SUSPOINT_PRCL_OUT_DQ'. In the ongoing OAF model cleaning/ reorg, these names may have been updated, Jeff K knows all, and put much of it into G18001962.
PS It's odd that Ham3 - RX has such a large coupling.
Associated with FRS Ticket 11740.
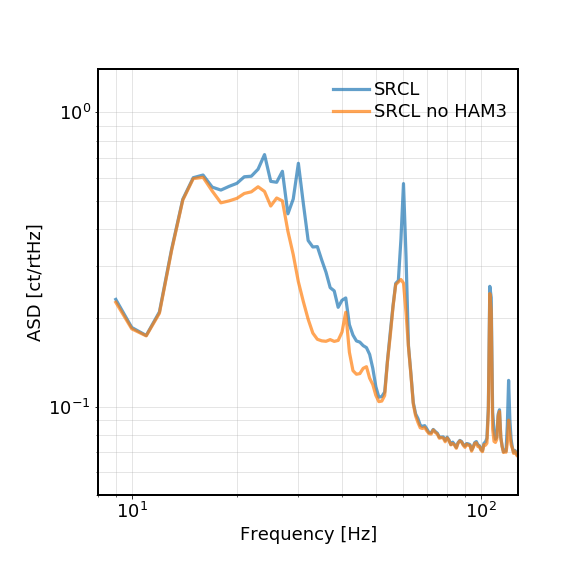
We also looked at the HAM3 coupling using the MISO coherence method. This method takes the correlations between different HAM3 channels into account when doing the projection and thus allows us to see the total HAM3 noise projection. On the other hand, the coherence only captures the linear part of the coupling. If the noise is mostly from scattering, and the relative motion is on the order of um, then we could not see the coherence due to the loss of linearity.
In the first plot we show how much does the HAM3 motion projects to SRCL. The blue trace was the total uncalibrated SRCL and the orange one is the HAM3 MISO coherence removed. This seemed to be consistent with the excess power projection that the HAM3 motion is mostly significant in the 20-50 Hz band but not much above 50 Hz.
In the second plot we show how different HAM3 dofs projects to SRCL.
In the third and forth plots is the HAM3 projection to DARM. We only saw a small amount of difference based on the linear coherence. However, if it is scattering we might not be able to capture a complete picture from linear analysis alone.
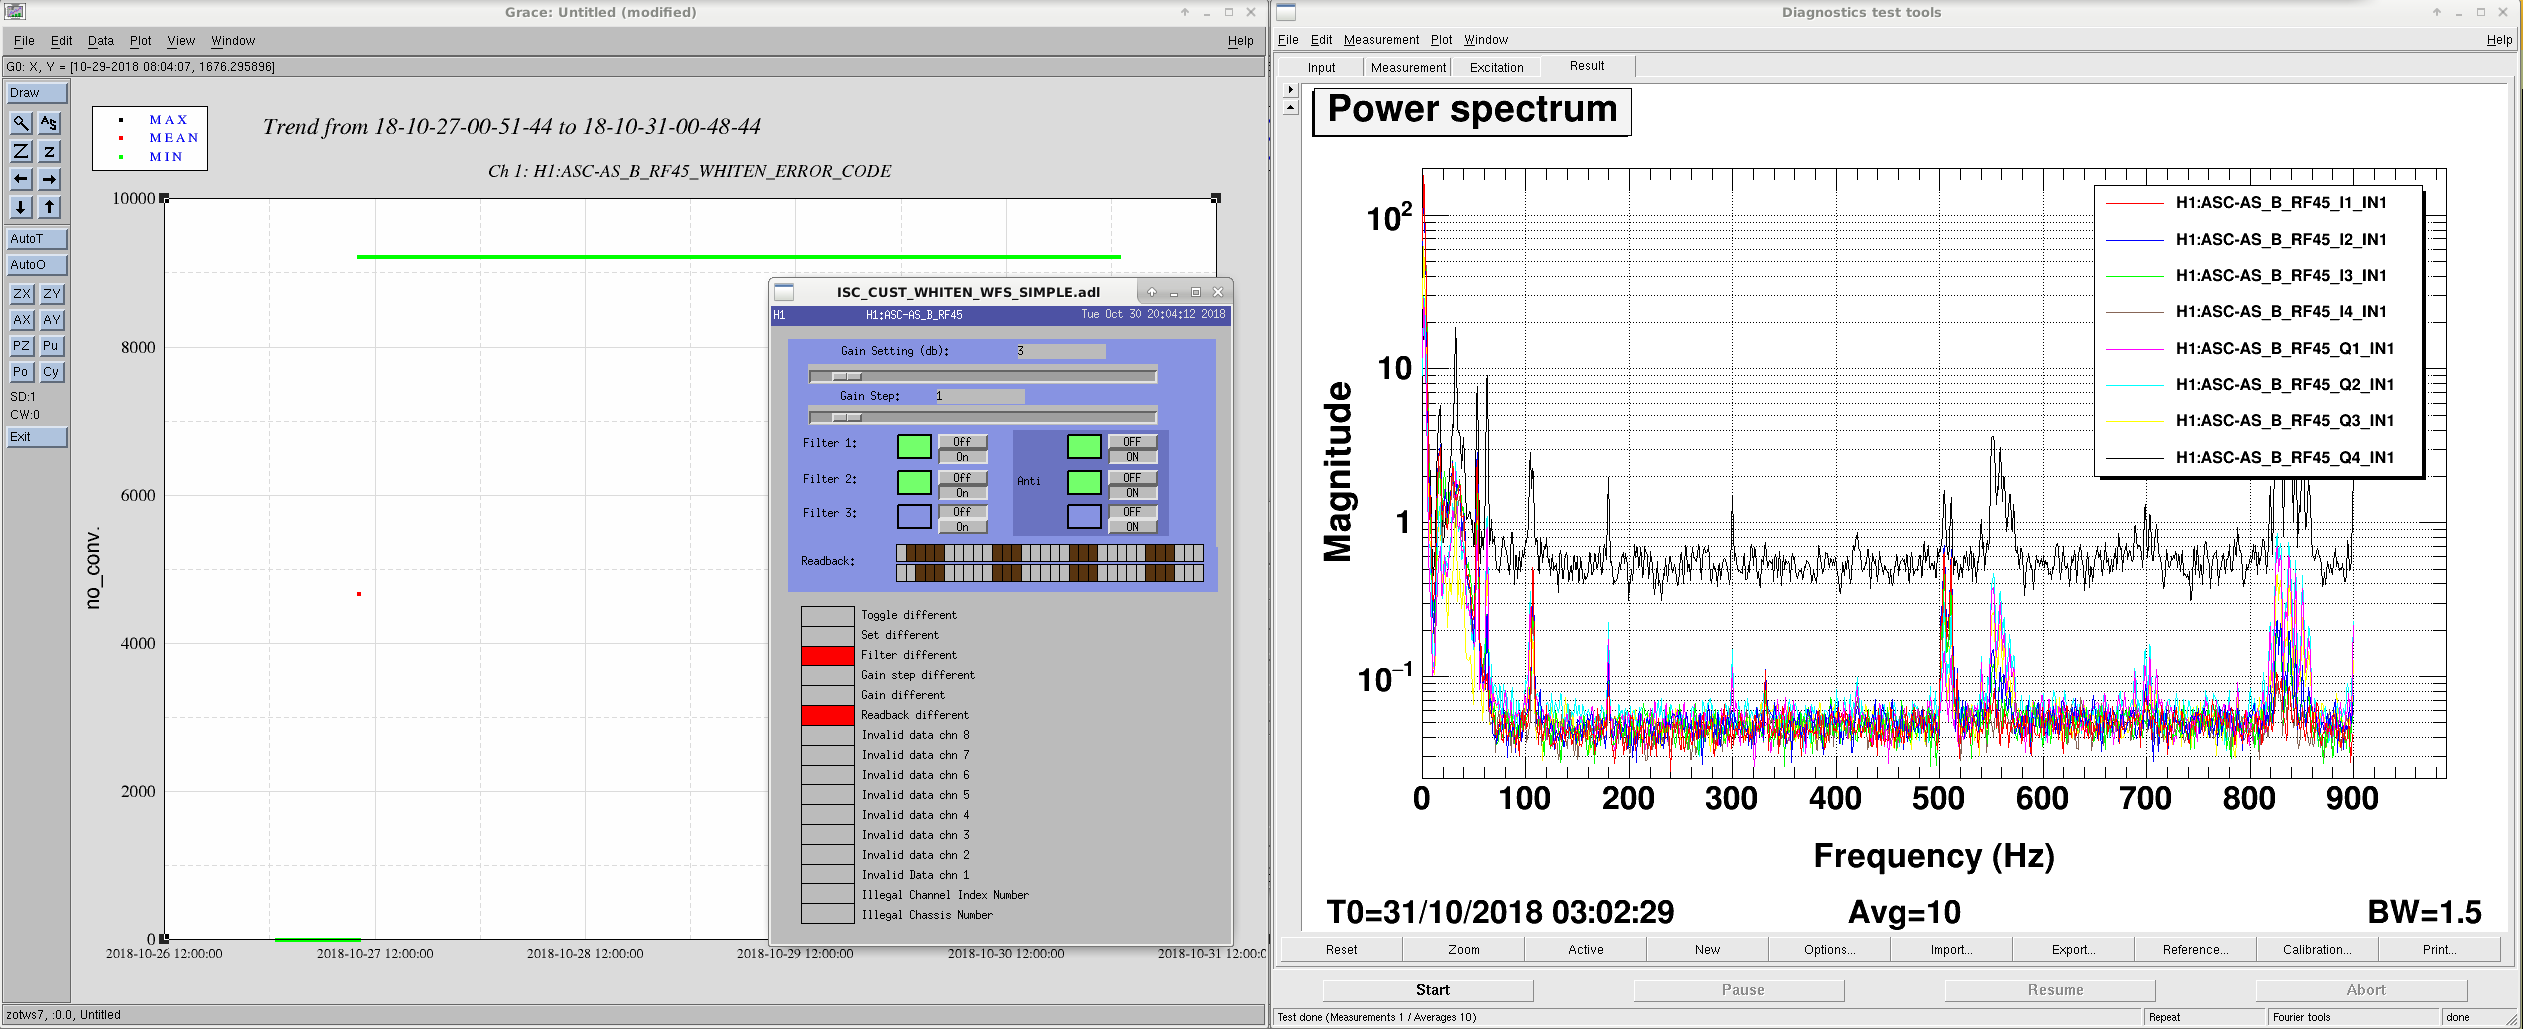
AS_B is not used so no serious consequence but we started getting error about ASC-AS_B_RF45 whitening at about Oct/27/2018 10:00:00 UTC, that's 3AM local time on Saturday. The third 1:10 analog whitening for Q4 channel seems to be ON regardless of what BIO tells it to do, maybe a BIO cable/connector problem (again)? See attached.
Since I don't like to leave it totally broken I disabled the second whitening and enabled the third whitening and confirmed that all quadrants both I and Q made sense. But we need to remember that this BIO is not fully functional.
Is this the same one that Marc fixed a few weeks ago? If so, maybe there's a deeper problem that keeps coming back.
Same bat channel. Reopened the FRS 11582
I pulled the whitening chassis (S1100794) from ISC-R3 slot 13, and replaced the same chip as before (U13, which is an ALS573C octal d-latch). I also cleaned up some flux residue from both sides of the board and it works again.
During testing I noticed when the latch is active (low), and the adjacent pin is toggled low, the ground bounces enough to toggle the latch. This adjacent pin is the pin that has failed twice now. I measured greater than 2V overshoot both positive and negative which is beyond maximum specifications for this chip. This was only seen with the test rig, I tried but was unable to duplicate the results with the chassis installed.
This closes WP7906 for now...
This is a belated alog from some time last week.
Since OFI length DOF is not nonsense any more (alog 44837), I injected band-limited white-ish noise at around 0.1Hz into L, Y and T so that the RMS becomes two orders of magnitude bigger (red traces on the left panel) than without injection (green traces on the left panel).
No change in DARM (right panel).
Later I also injected a single line at 80Hz with huge amplitude (blue traces on the left) and saw no change in DARM though it's not plotted here.
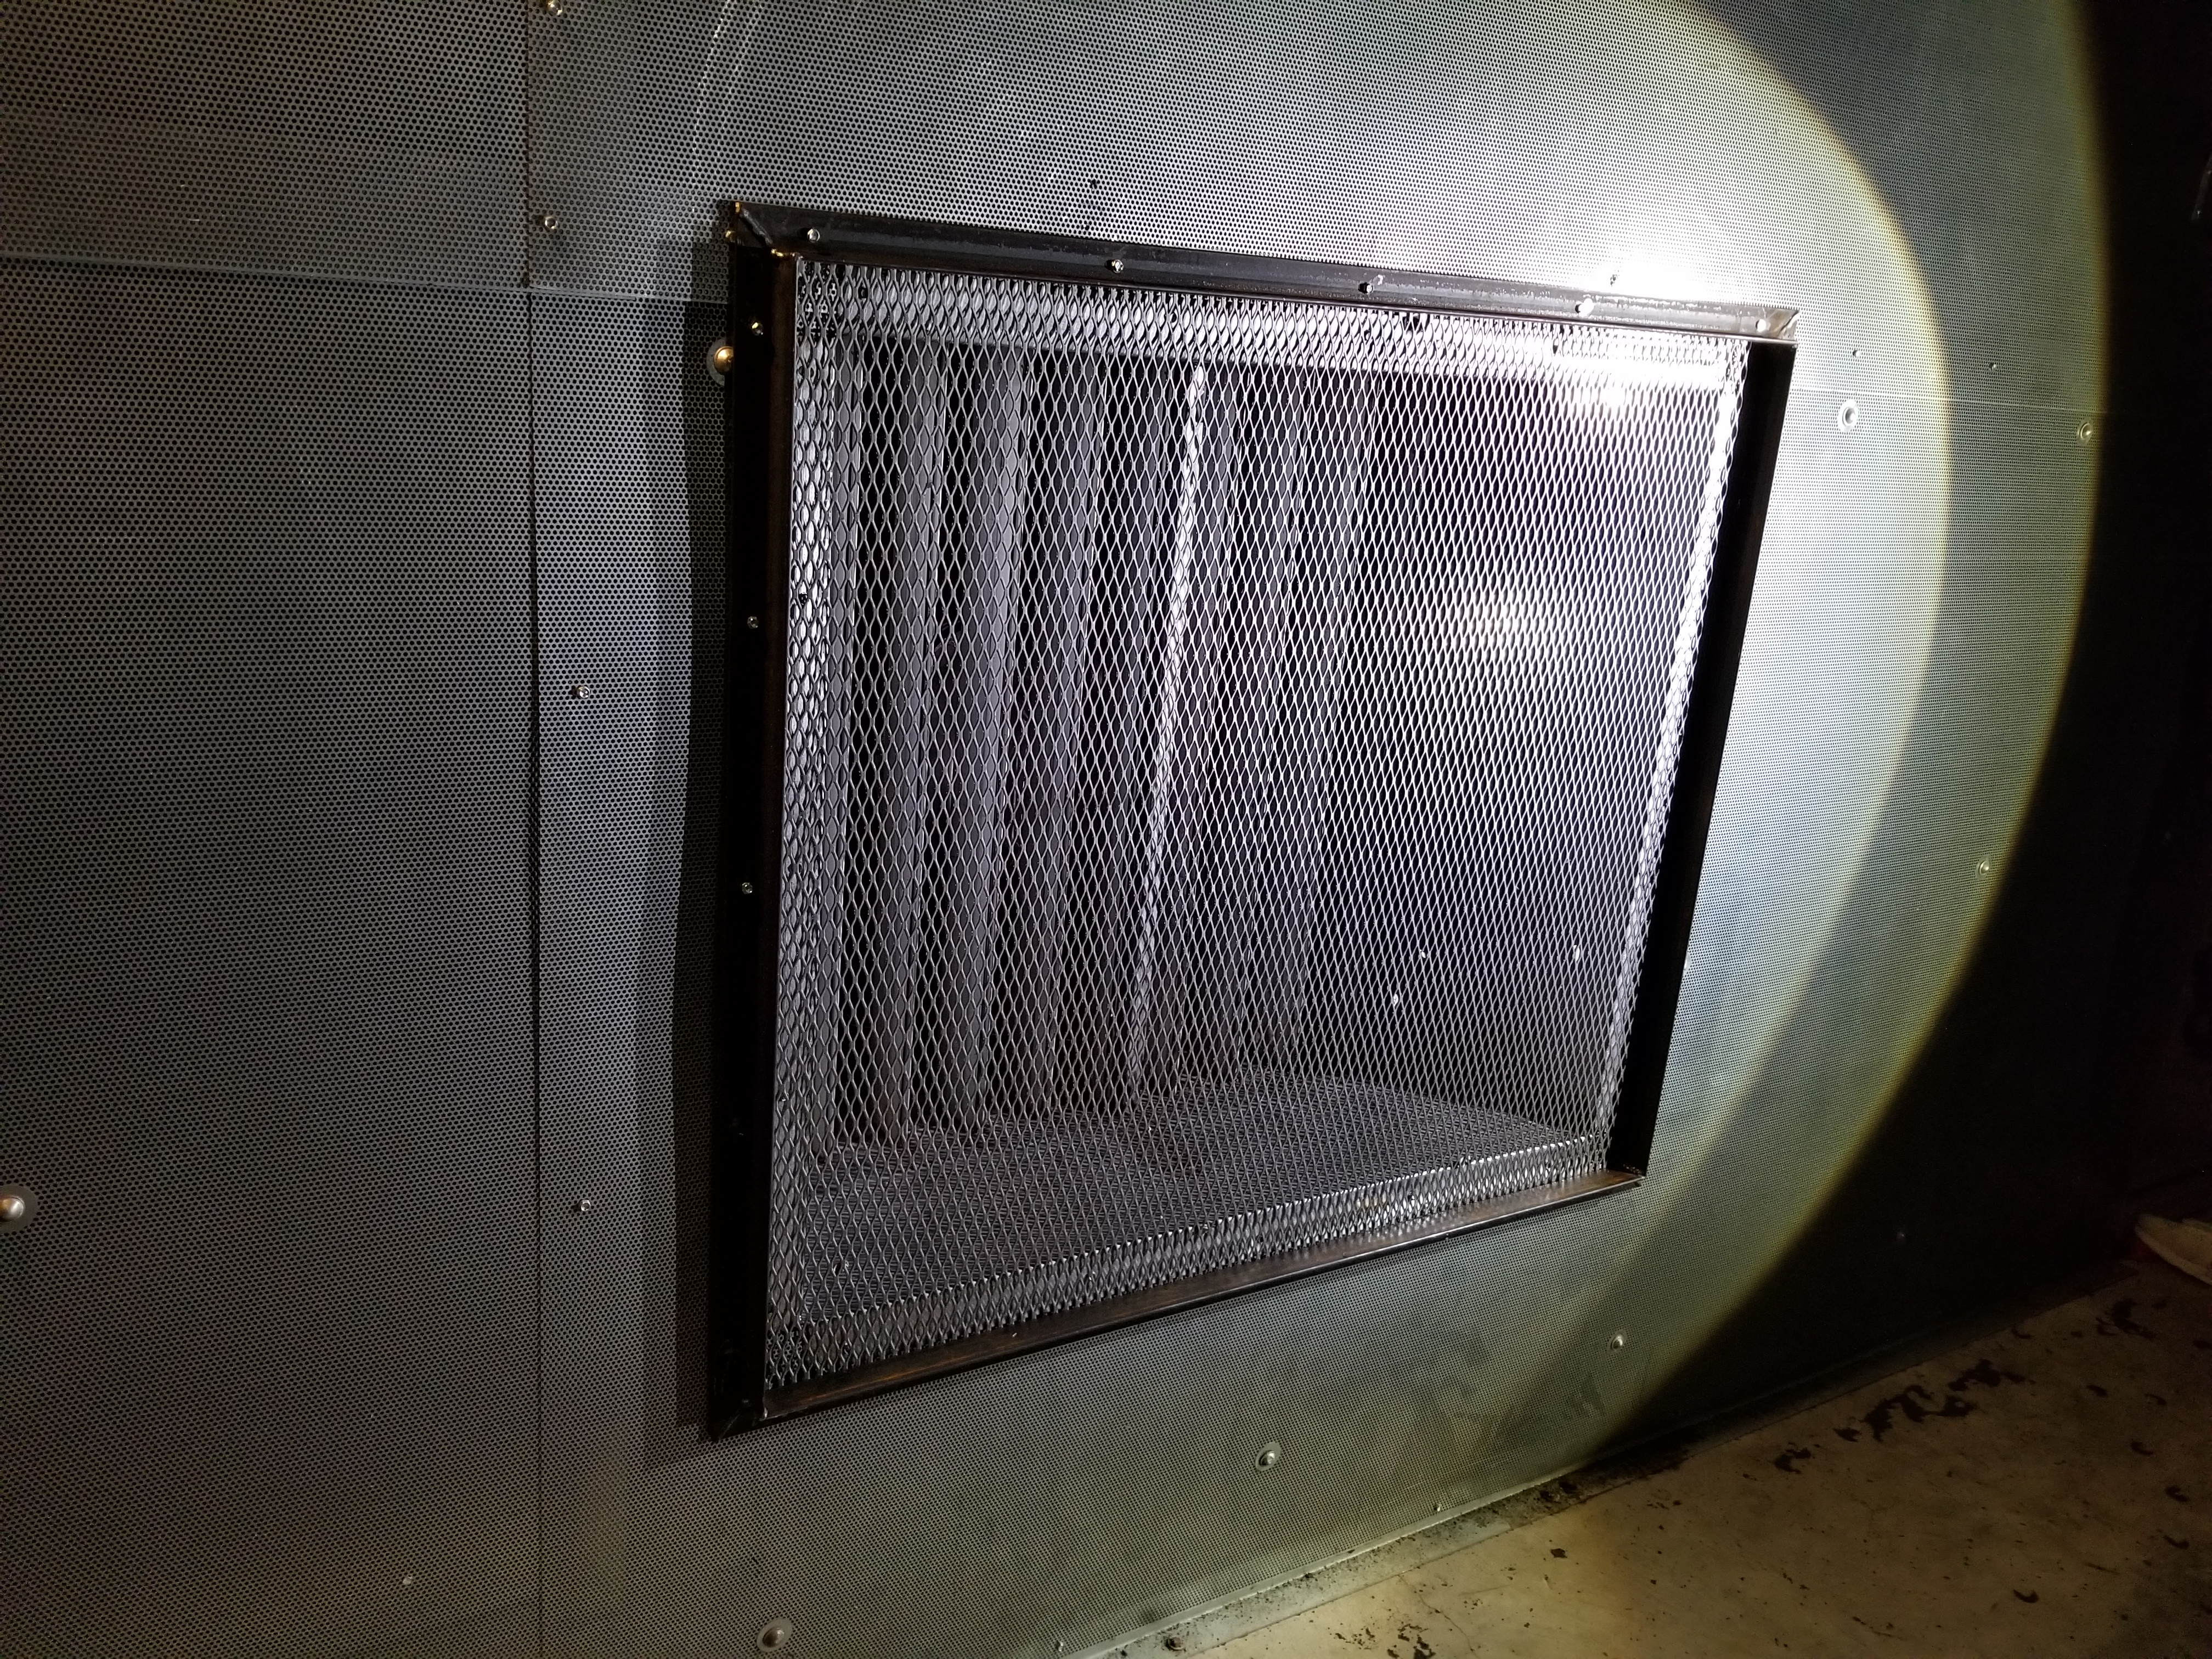
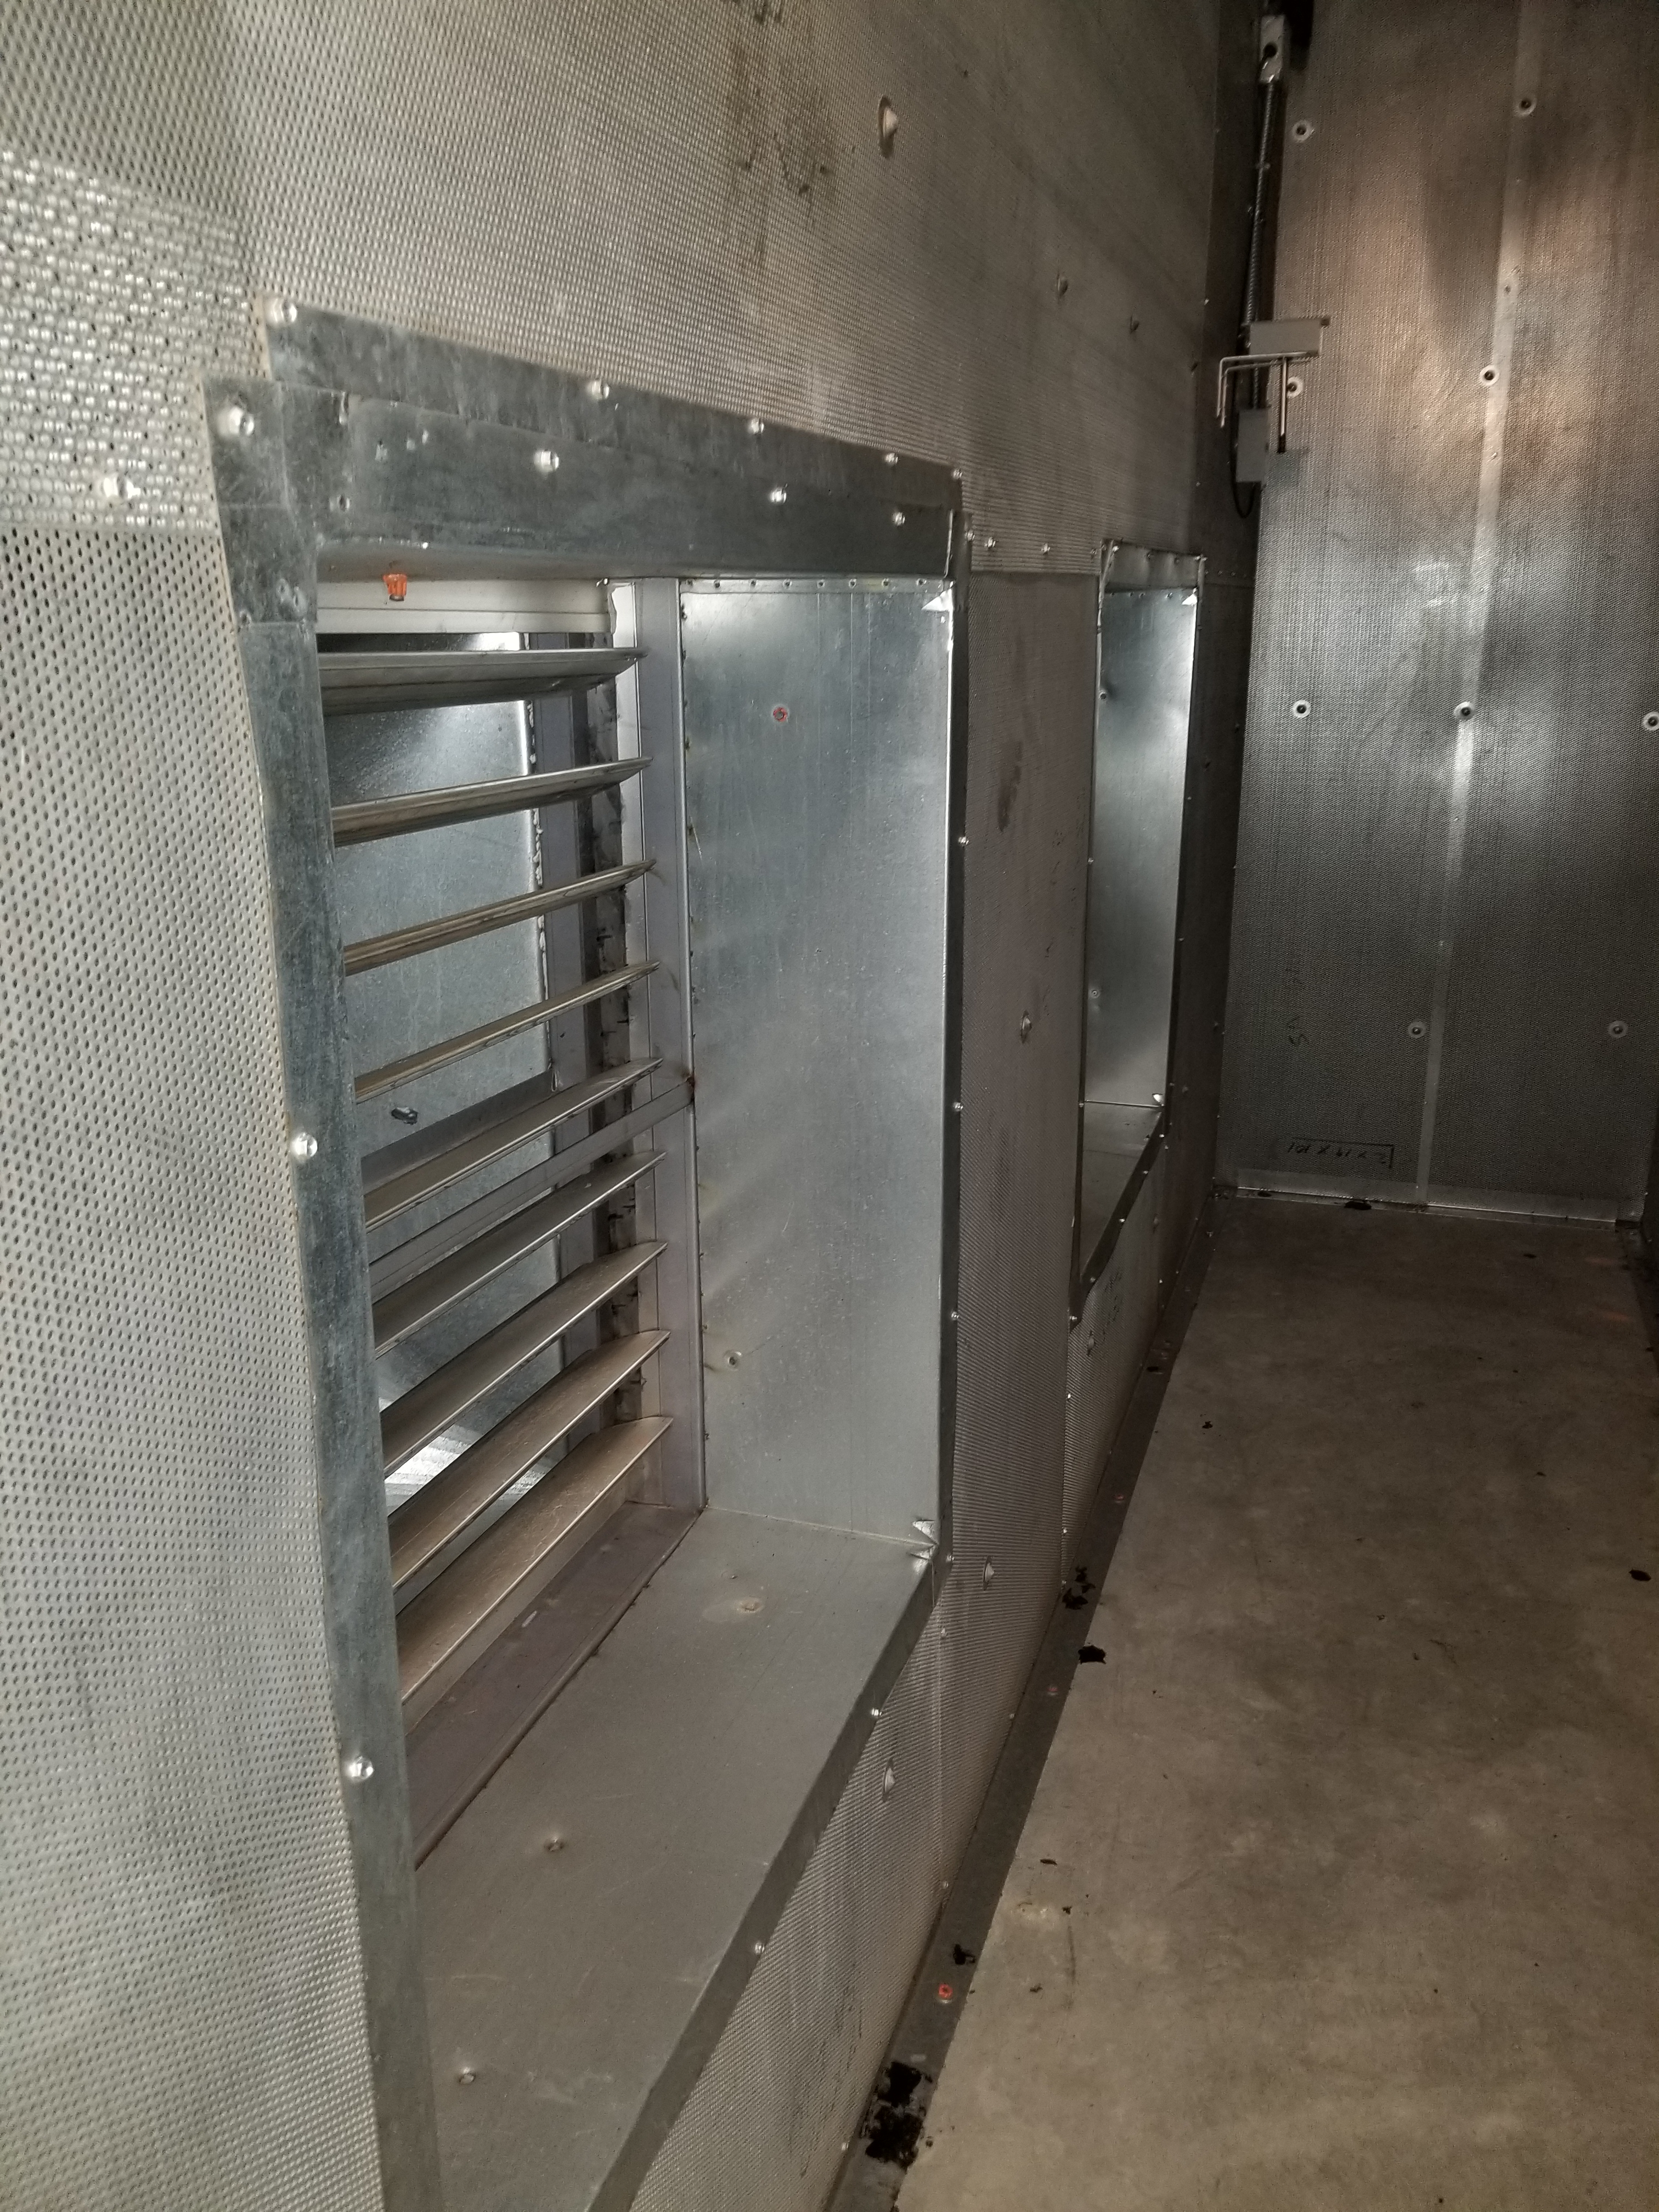
Per Robert S. request I visited the plenum at each station (Corner, Mids and Ends) to check for the HVAC grating installed sometime in 2009, it turns out that only the Y-End station and Corner station have such device installed, see photos.
Something to note, while visiting the Y-End station plenum the fan started to pulsate with the door open, I did not see such response on the other stations, but with the door closed the pulsation goes away.
T.Vo and I tried two techniques to try and get an image of the HWS baffle that maybe clipping our SLED beam. No good images came from either method and we are freshly geared up for another try when the opportunity arises.
First we took a CCD camera and tried two different positions (see attached) within the path, but we needed more zoom than the two lenses we had could give us.
Next we tried a DSLR with more lens choices, but still could not produce any reasonable images. This worked better than the previous attempt, but still not good enough.
Cheryl and Fil then set us up with a CCTV Rainbow Zoom lens and we now have much higher hopes that we can get a better image next try.
A few of the not-so-good photos can be found here: G1802122
Came in a early to squeeze in ETM charge measurements. Here are some notes:
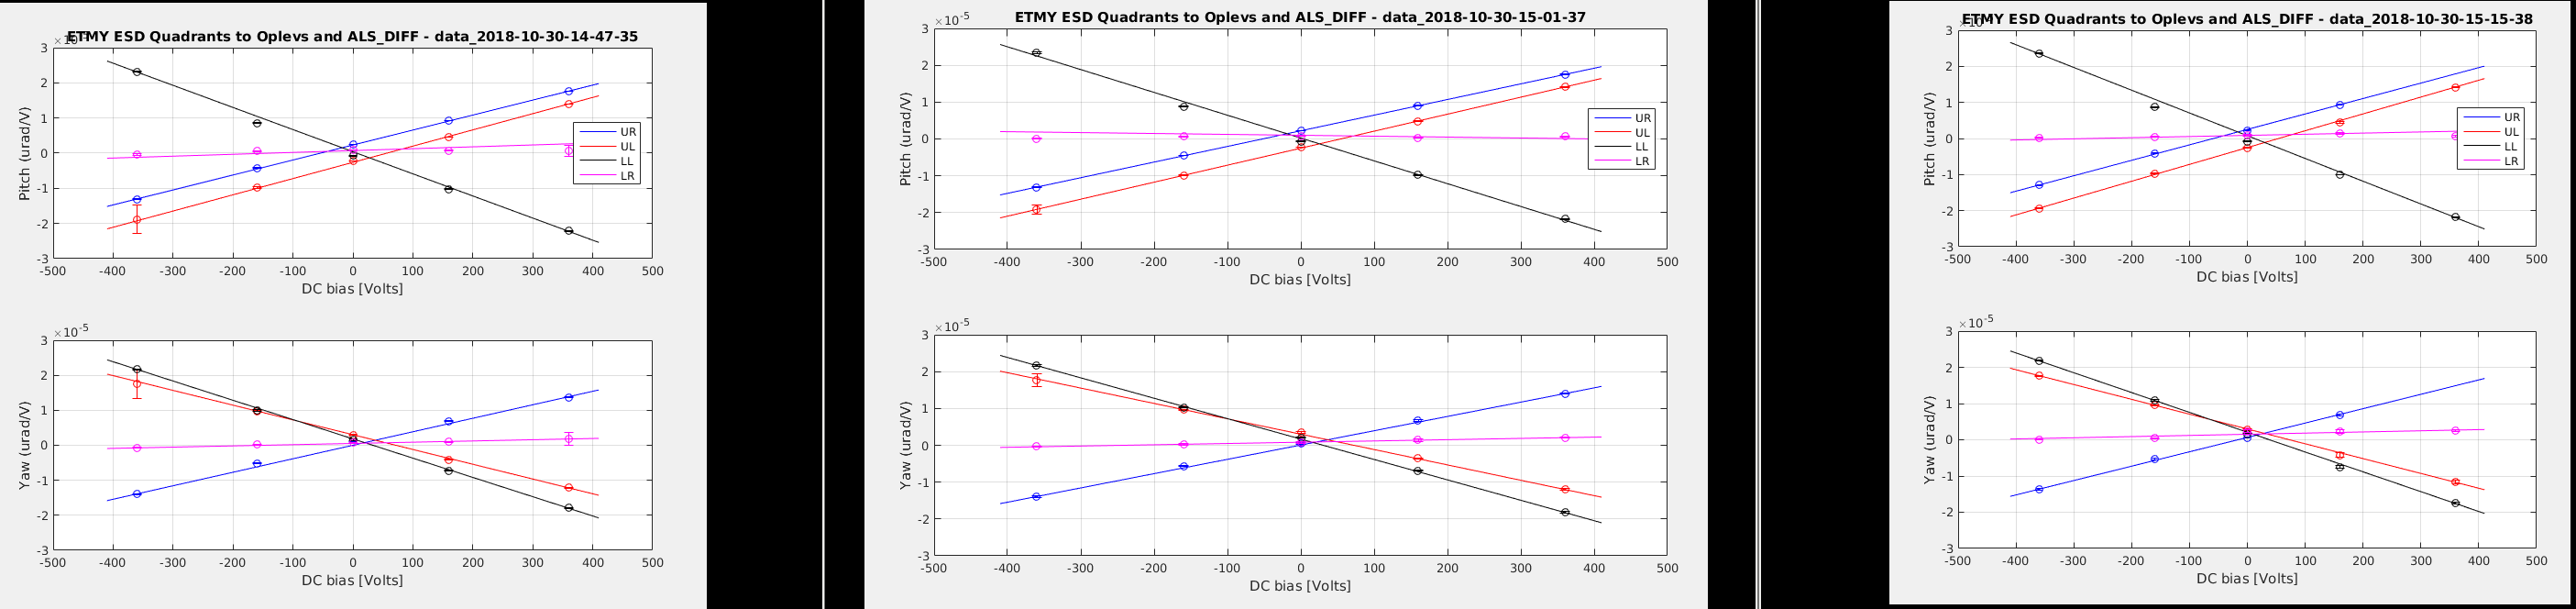
Below are the slider values & brief notes/checks of the measurements for both ETMs as I was running. I ended up running the full script which had 5-measurements for ETMx & ETMy. As long as we had three good measurements for an ETM, then we are good. A good measurement basically shows a matlab plot with an "X" on it. Attached are measurements for ETMx & ETMy.
Alignment slider values & brief notes/checks on measurements as I was running the procedure:
ETMx: Pit: +102.3 & Yaw: -131.0
NOTES for ETMx: See attached plot with 3-good measurements + 1 bad one. For the ETMx one, the first measurement did not look good for Pitch ( w/ no "X" and all four quadrants were a flat 0 urad/V); the next 3-measurements looked good.
ETMy (w/ ESD LR quadrant bad!): Pit: +122.3 & Yaw: -125.9
NOTES for ETMy: See attached plot with 3-good measurements. For the ETMy, mainly had an "X", but the ETMy LR quadrant was 0 urad/V. This is a known failure for the the ETMY ESD (FRS#10543).
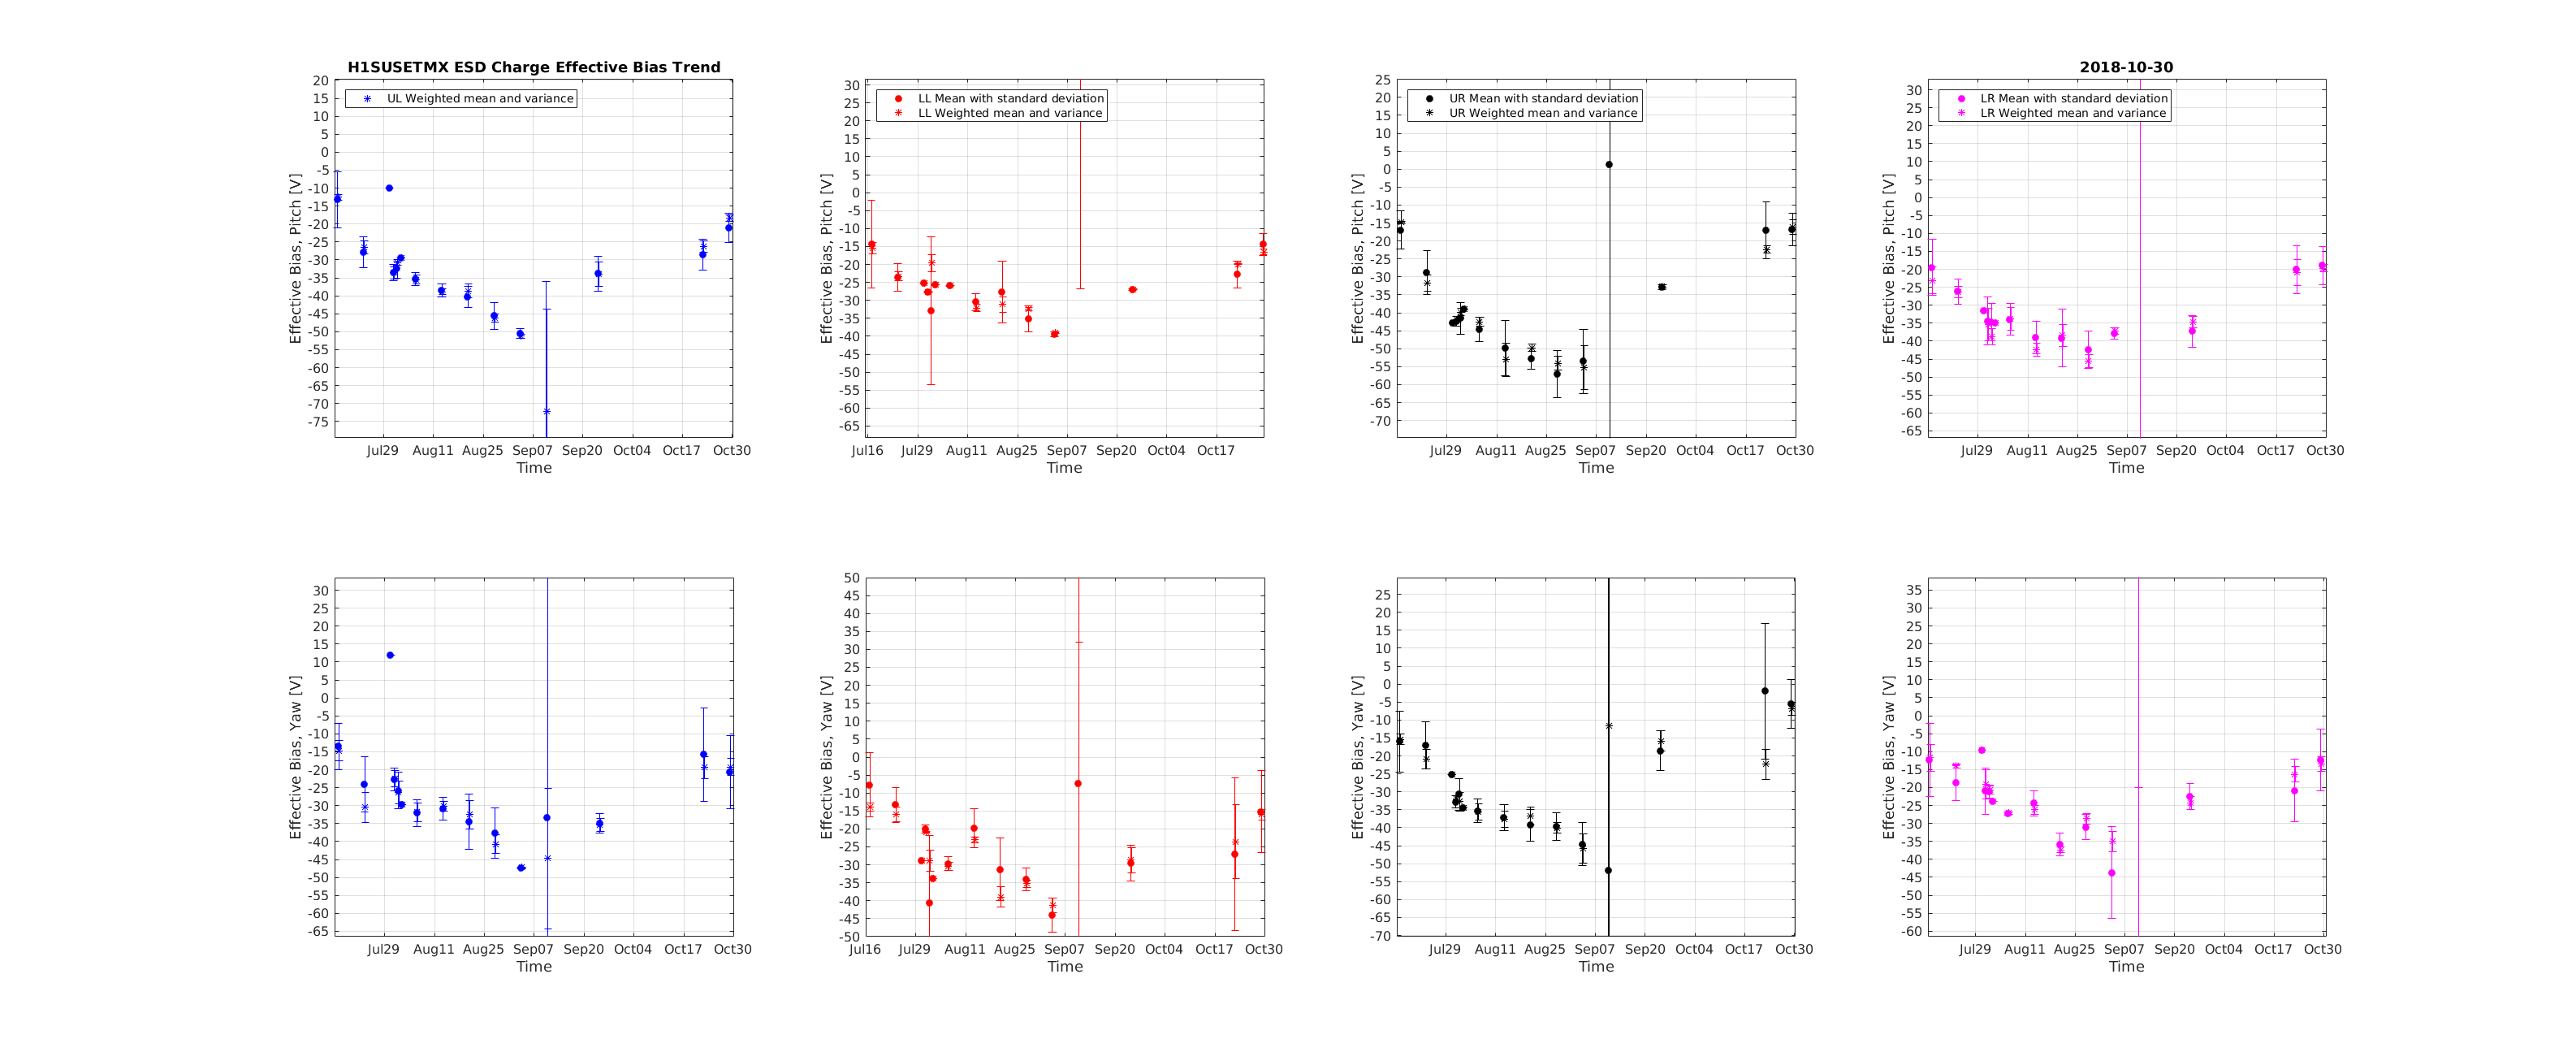
I've added today's data to the long trend plots of effective bias voltage for each quadrant, see first attachment for ETMX and second attachment for ETMY (sorry about the annoying axes on ETMY). No surprises: the same trend on EX due to the induced polarization caused by the bias voltage, and fairly flat for EY.
Measurements taken before and after the ETMX 20-bit DAC install show the same actuation strength (within error bars), which is good. The channels these scripts store and calculate the drive voltage from are the L3_ESDOUTF out channels.
I think I might need to update the calibration the scripts for the other types of charge measurements, which, if I remember right, read out the MASTER_OUT channels but I haven't done this yet.