erik.vonreis@LIGO.ORG - posted 07:03, Tuesday 05 August 2025 (86190)
Workstations updated
Workstations were updated and rebooted. This was an OS packages update. Conda packages were not updated.
Workstations were updated and rebooted. This was an OS packages update. Conda packages were not updated.
TITLE: 08/05 Eve Shift: 2330-0500 UTC (1630-2200 PST), all times posted in UTC
STATE of H1: Observing at 149Mpc
INCOMING OPERATOR: Ryan C
SHIFT SUMMARY:
H1 Stayed Locked and observing the entire shift.
No SQZ issues, Pi's, wind, barely even an eath_quake! It was a very quite night without any super events once again.
All systems running as expected.
GRB-Short E586884 at 23:08:34 UTC
LOG:
No Log
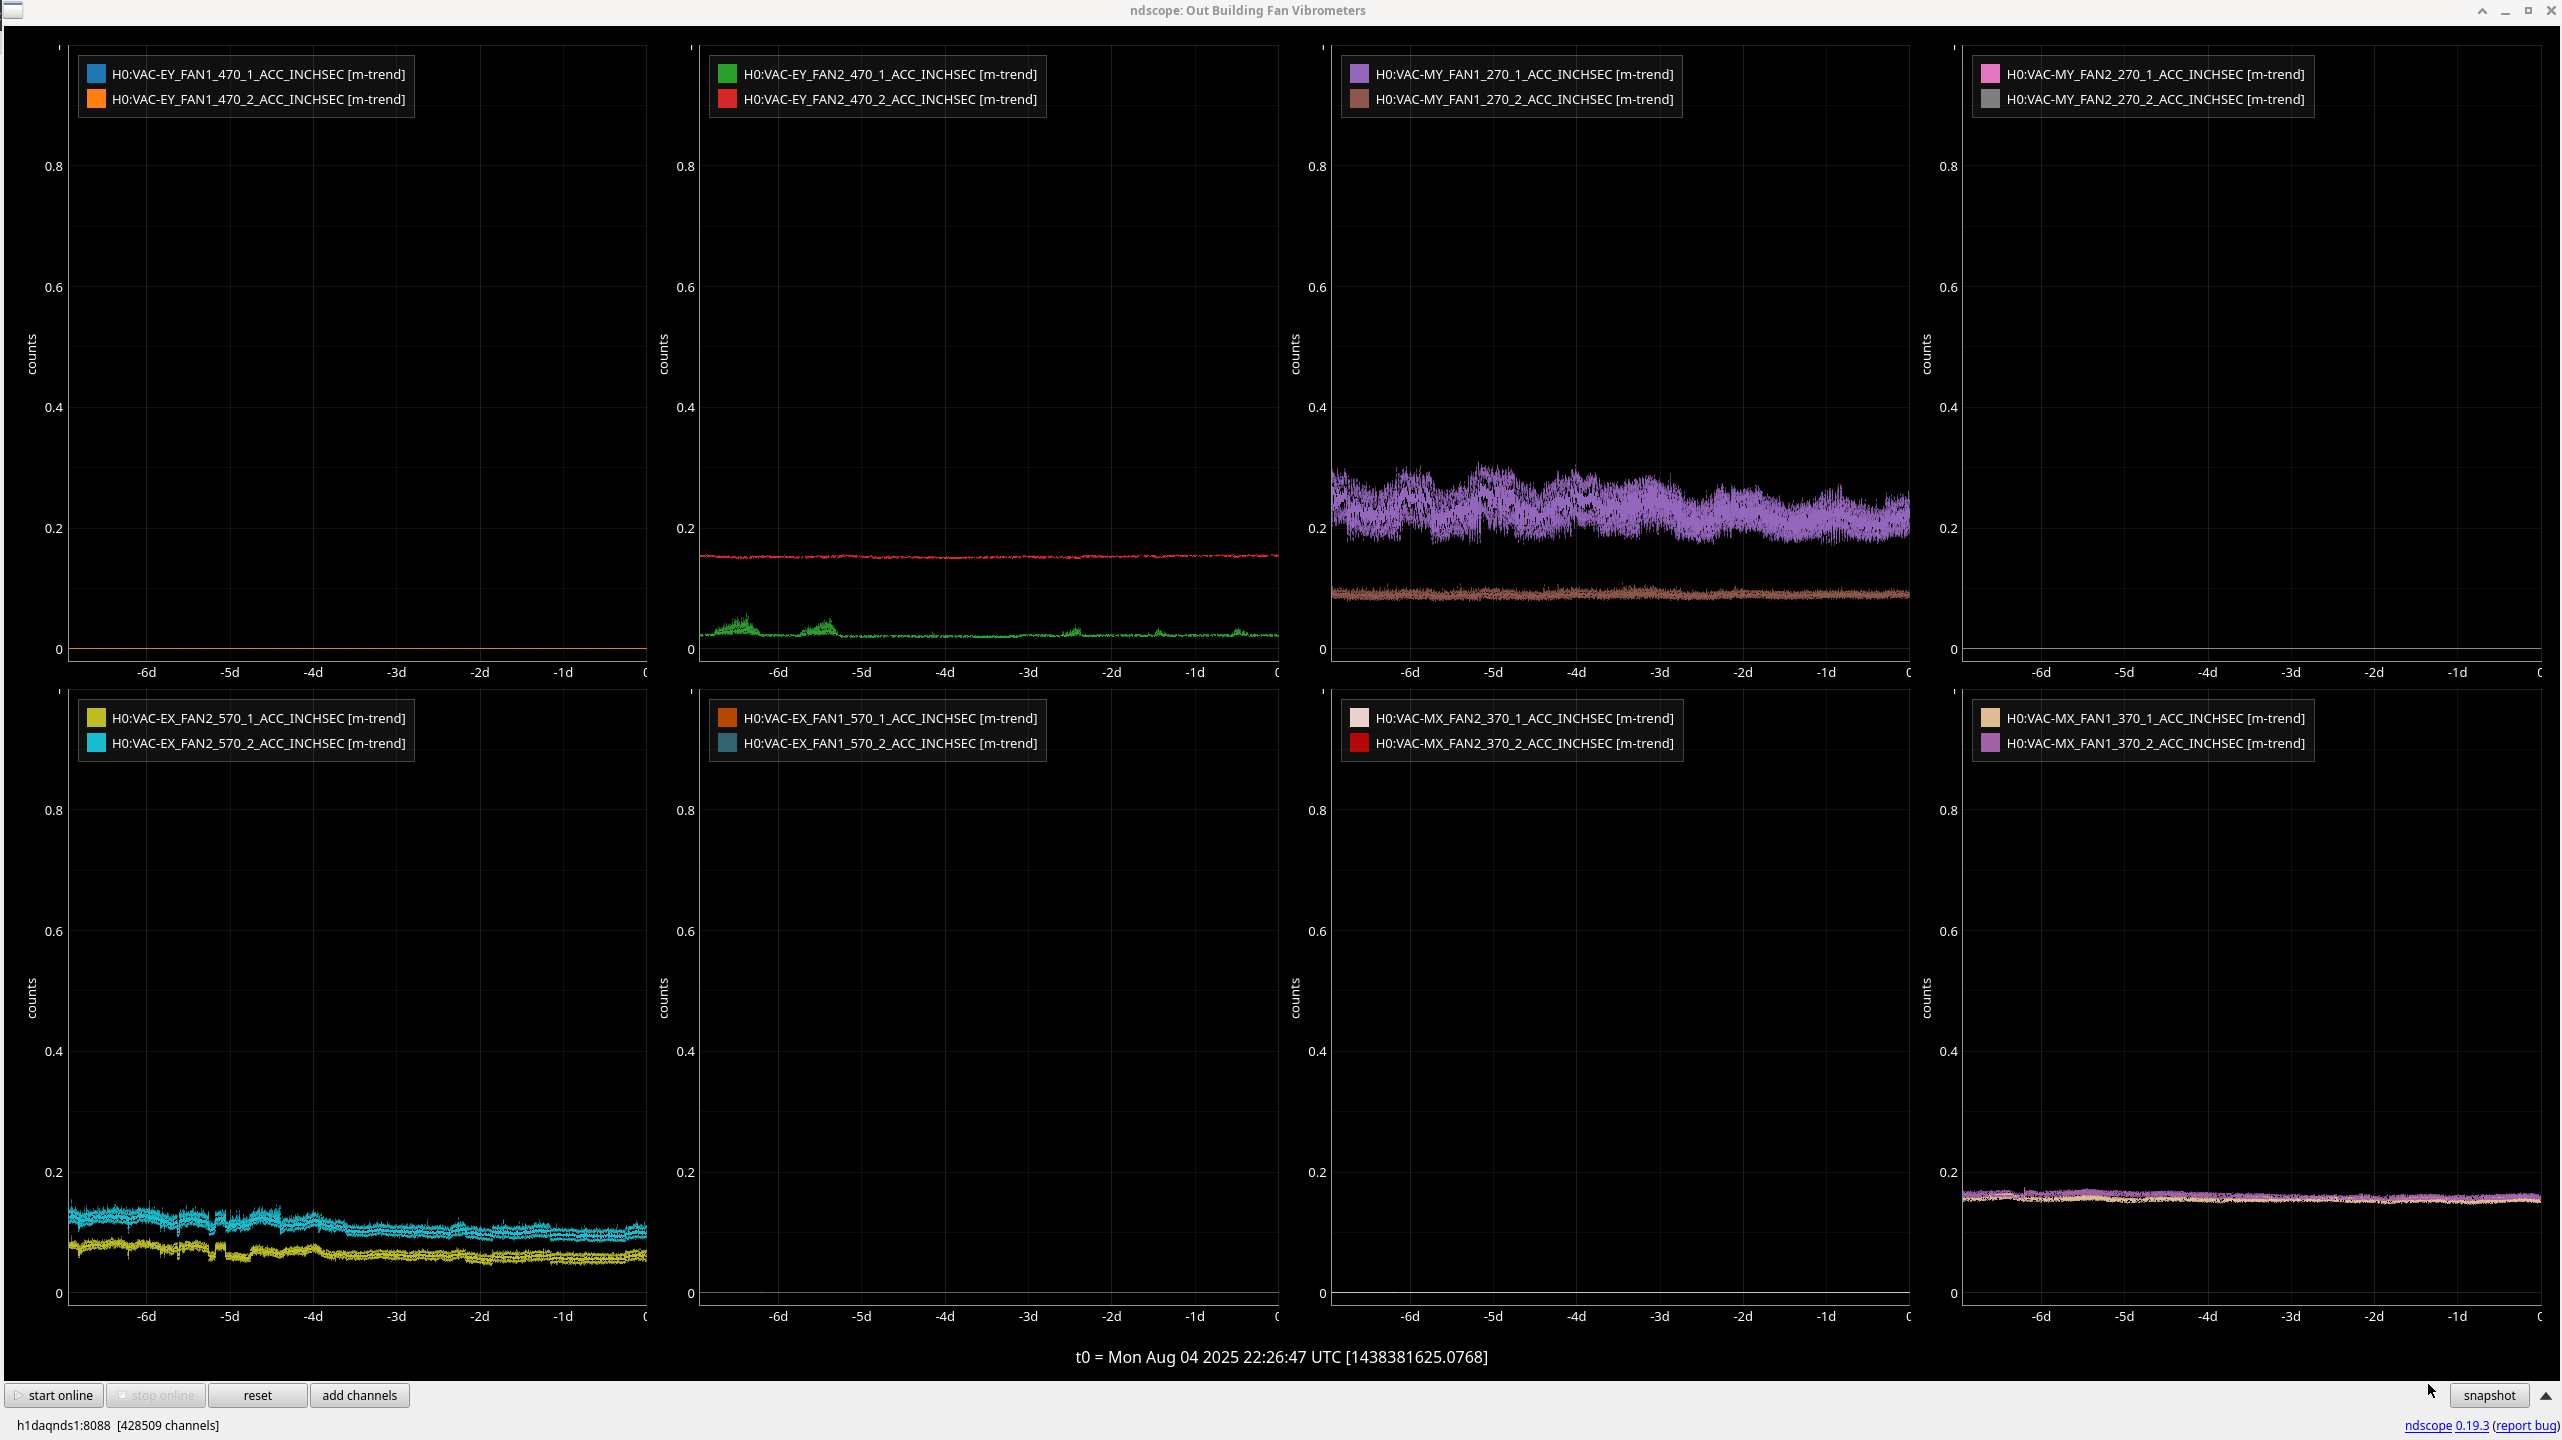
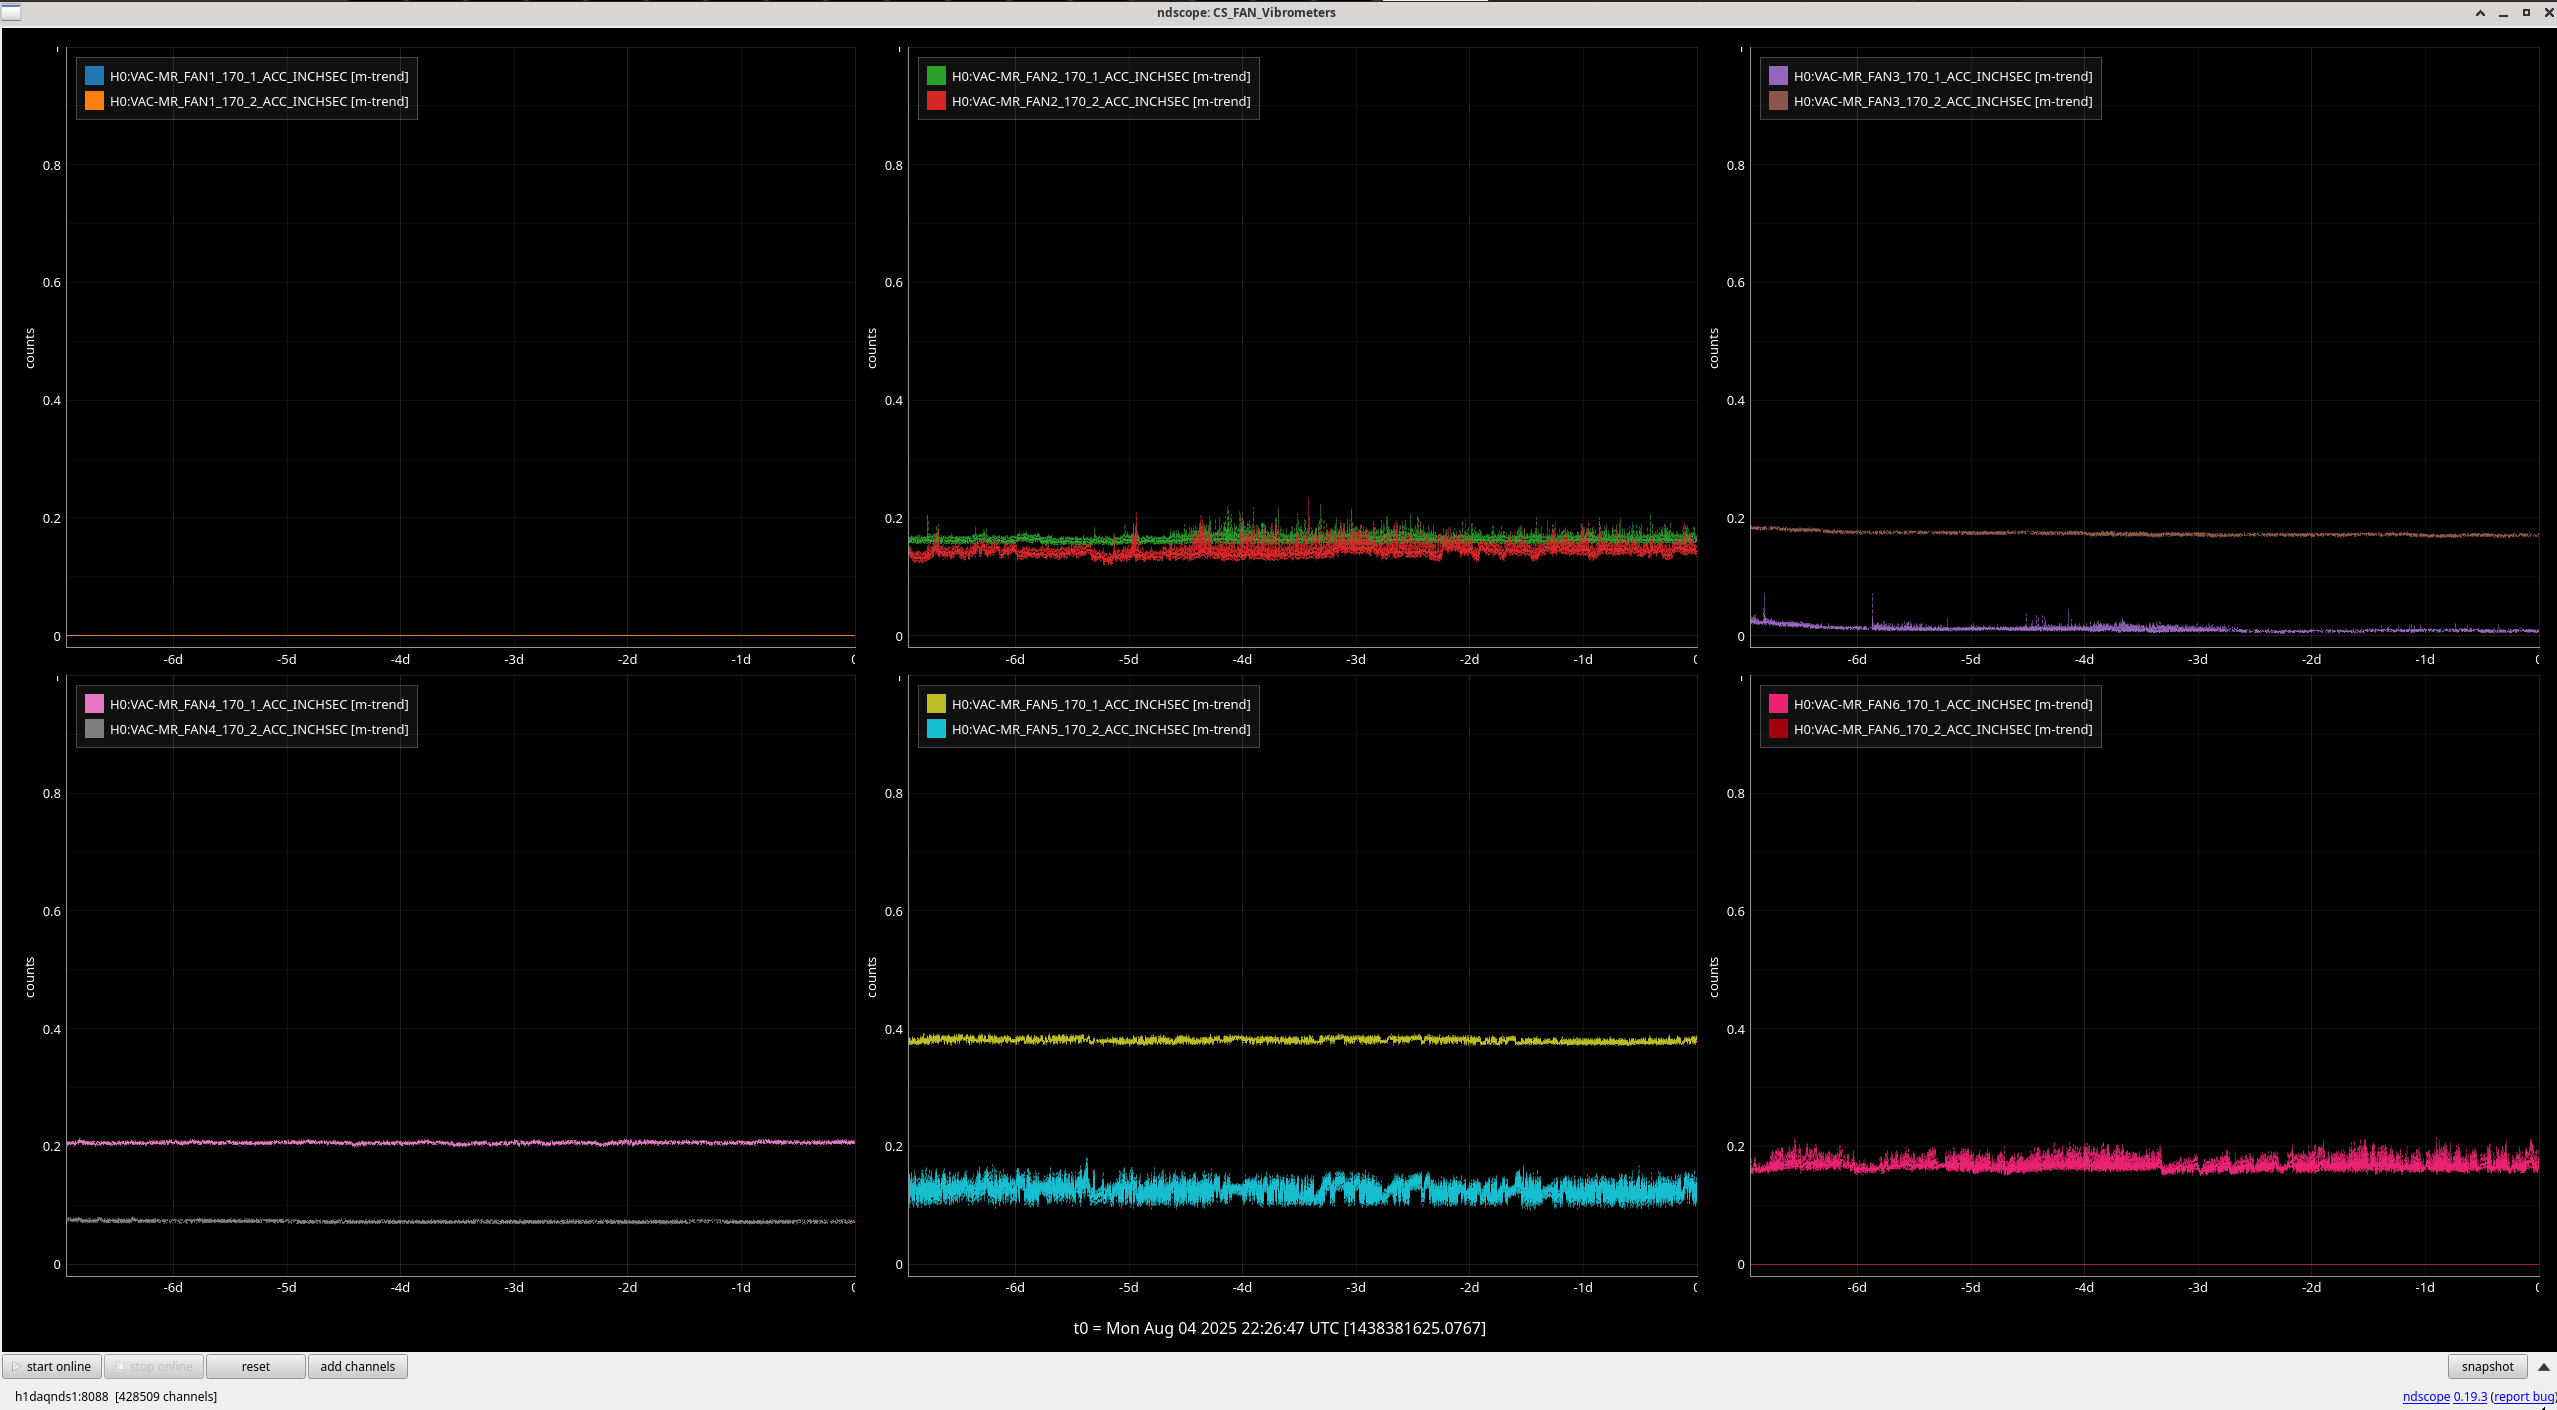
Using Vibration Sensors To Gauge Health Of HVAC Fans Site Wide Famis 26413
Ivey, Edgard.
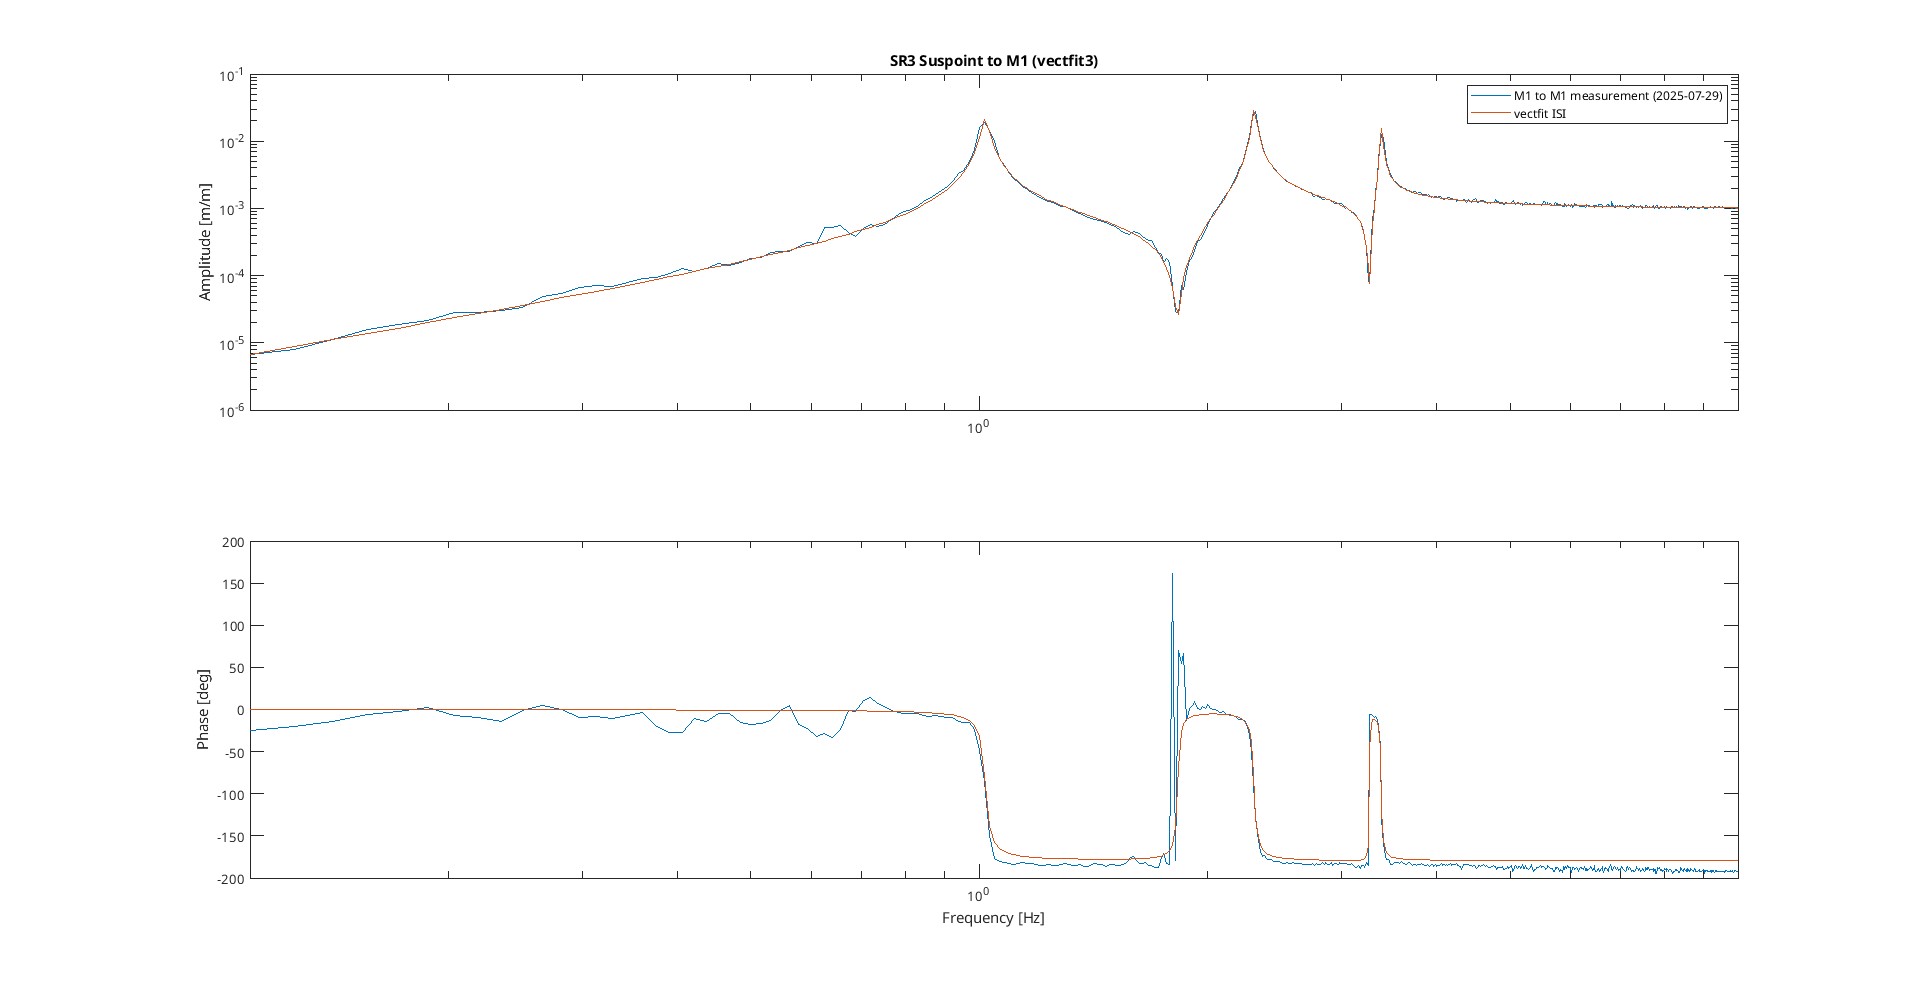
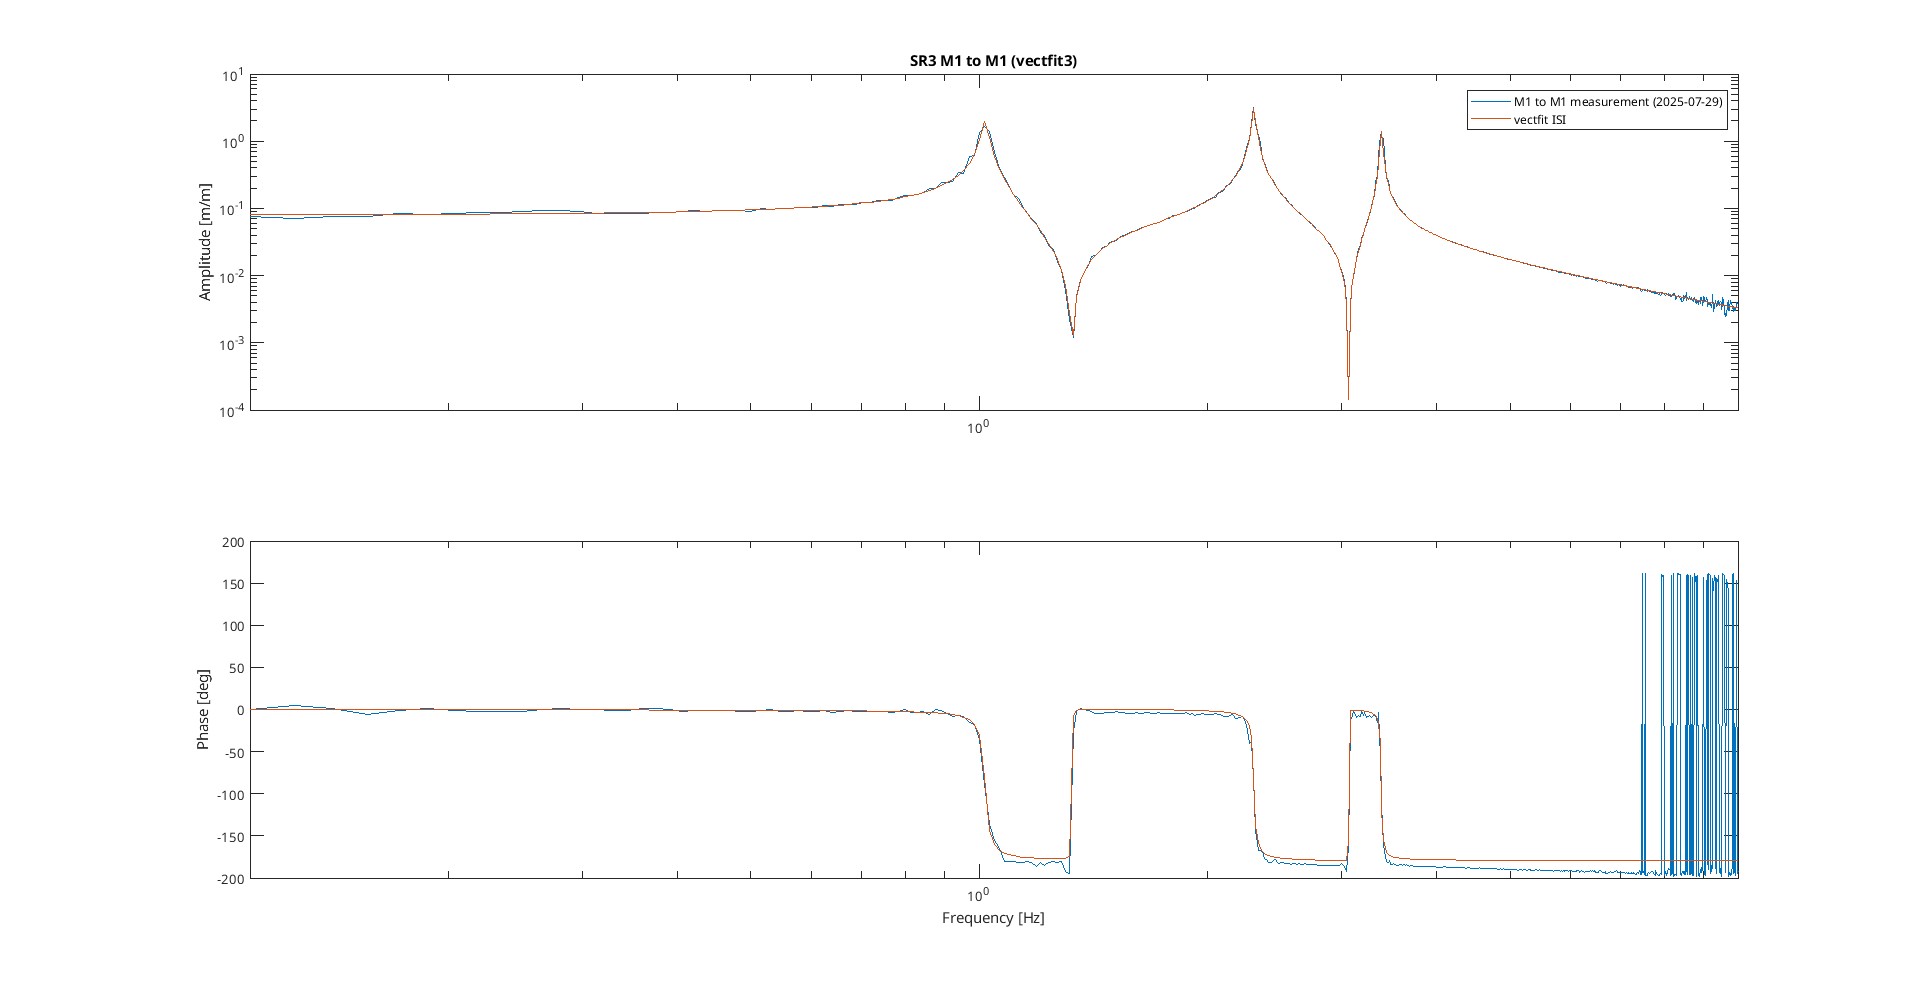
Ivey made even newer fits for the M1 SR3 in "Yaw using the measurements that Oli took in [LHO: 86075].
These fits are pretty similar to the last set we got in [LHO: 85446]. However, this time, Ivey used vectfit3 for both of the fits directly. She only manually ensured that the zeros were all in the left-hand-plane, and that there were no additional zeros in the M1 to M1 transfer function, even if the measurements show a bit extra phase loss compared to the fit.
These are the fits obtained [see figures for an eye-test of the goodness of fit]:
For the ISI to M1 transfer function:
'zpk([0,0,-0.027+20.489i,-0.064+11.458i,-0.027-20.489i,-0.064-11.458i],[-0.072+6.395i,-0.072-6.395i,-0.096+14.454i,-0.096-14.454i,-0.062+21.267i,-0.062-21.267i],-0.001)'
The M1 to M1 transfer function:
'zpk([-0.002+19.246i,-0.005+8.312i,-0.002-19.246i,-0.005-8.312i],[-0.065+6.392i,-0.065-6.392i,-0.076+14.442i,-0.076-14.442i,-0.055+21.272i,-0.055-21.272i],12.085)'
The fits were added to the Sus SVN and live inside '/ligo/svncommon/SusSVN/sus/trunk/HLTS/Common/FilterDesign/Estimator/fits_H1SR3_2025-07-29.mat' .
The filters can be installed using 'make_SR3_yaw_model.m', which lives in the same folder [for reference, see LHO: 84041, where Oli got the fits running for a test]. This last script, as well as 'make_SR3_yaw_blend.m' were updated to work with the new naming convention for the estimator block.
Hopefully we will get to test the estimator again soon!
TITLE: 08/04 Eve Shift: 2330-0500 UTC (1630-2200 PST), all times posted in UTC
STATE of H1: Observing at 146Mpc
OUTGOING OPERATOR: TJ
CURRENT ENVIRONMENT:
SEI_ENV state: CALM
Wind: 19mph Gusts, 13mph 3min avg
Primary useism: 0.04 μm/s
Secondary useism: 0.09 μm/s
QUICK SUMMARY:
H1 has been locked and Observing for just over 2 hours.
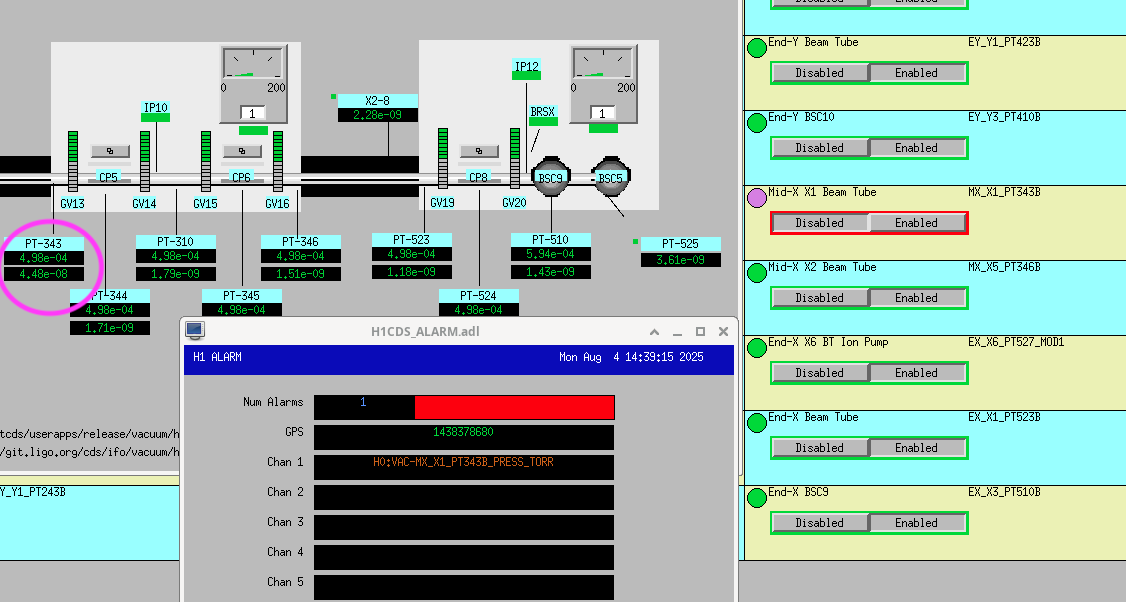
I've got a and Alarm from the CDS screen about H0:VAC-MX_X1_PT343B_PRESS_TOR, but after speaking to Janos this is in preparation for tomorrow's maintence Tuesday VAC team activities.
So other than that everything seems to be humming along.
Jennie W, Camilla C
A while ago we heated up then cooled down the SR3 heater (alog #84749).
As part of measurements using this data I calculated the curvature change, following the approach at LLO by Aidan given iin alog #27262. Matlab code is below.
%calculate SR3 spherical lensPin = 2;%Wdouble_pass = 2;SR3_t = (3*3600) + (11*60); % Time for cooldown in s.delta_ITMY = -2.67e-5;% decrease in defocus of ITMY according to Hartmann sensor.D_ITMY = delta_ITMY./double_pass;% defocus change in DioptresD_ITMY_error = 5e-6;% error on defocus in Dioptres.R_SR3 = 36.013;% cold radius of curvature in mdelta_R = (2./((2/R_SR3)+D_ITMY))-R_SR3; % change in curvature during cooldown in m/delta_delta_R = D_ITMY_error.*(2./((2./R_SR3)+D_ITMY)); % error on curvature change.
This means the rate of defocus change is 6.6750uD per Watt.
The final curvature change is + 0.0087 m +/- 0.0002 m as the mirror becomes less curved due to cooldown.
In 84749Camilla had a look at the HWS images from these times, and I think her conclusion is that we shouldn't trust the reported spherical powers that Jennie is using above to estimate the curvature change. Matt later redid a HWS measurement using the SR3 heater heater, in 88413, we can use the value from that alog for uD/W instead and scale that to the power used here.\
In the time that Jennie is using above, the SR3 heater is set to 2W requested power, but the power readback reports 1.9W.
TITLE: 08/04 Day Shift: 1430-2330 UTC (0730-1630 PST), all times posted in UTC
STATE of H1: Observing at 150Mpc
INCOMING OPERATOR: Tony
SHIFT SUMMARY: Commissioning started the shift with one lock loss and a longer recovery. After we finally got back up we have been observing now for 2 hours.
LOG:
| Start Time | System | Name | Location | Lazer_Haz | Task | Time End |
|---|---|---|---|---|---|---|
| 14:53 | FAC | Kim, Nelly | MY, MX | n | Tech clean | 15:44 |
| 15:27 | CDS | Fil | MY | n | Pick up equipment | 15:49 |
| 15:33 | FAC | Kim | Opt lab | n | Tech clean | 15:50 |
| 16:05 | PEM | Robert | LVEA | n | Meas setup | 18:41 |
| 17:26 | CDS | Erik | Office | n | nuc5 work | 17:46 |
| 18:20 | PCAL | Rick | PCAL lab | - | Looking for something | 18:50 |
| 19:48 | VAC | Janos | MX | n | Looking at pump | 21:21 |
| 20:27 | - | Randy | LVEA | n | Checking for fans | 20:36 |
| 21:32 | VAC | Travis | Mids | n | Drop off gauge | 22:02 |
| 23:02 | SUS | Ryan | Opt Lab | n | Parts hunt | 23:23 |
While PT343 gauge is valved out and reading a higher pressure than normal for the next day or so several changes have been made to the alert/alarm systems:
VACSTAT: PT343 is Disabled, it cannot cause vacstat glitch detection events (right side of attachment).
ALARM: PT343 has been bypassed, meaning it says in alarm but no cell phone texts are sent (lower part in attachment). Bypass time:
Bypass will expire:
Wed Aug 6 01:08:03 PM PDT 2025
For channel(s):
H0:VAC-MX_X1_PT343B_PRESS_TORR
Jennie W, Sheila D
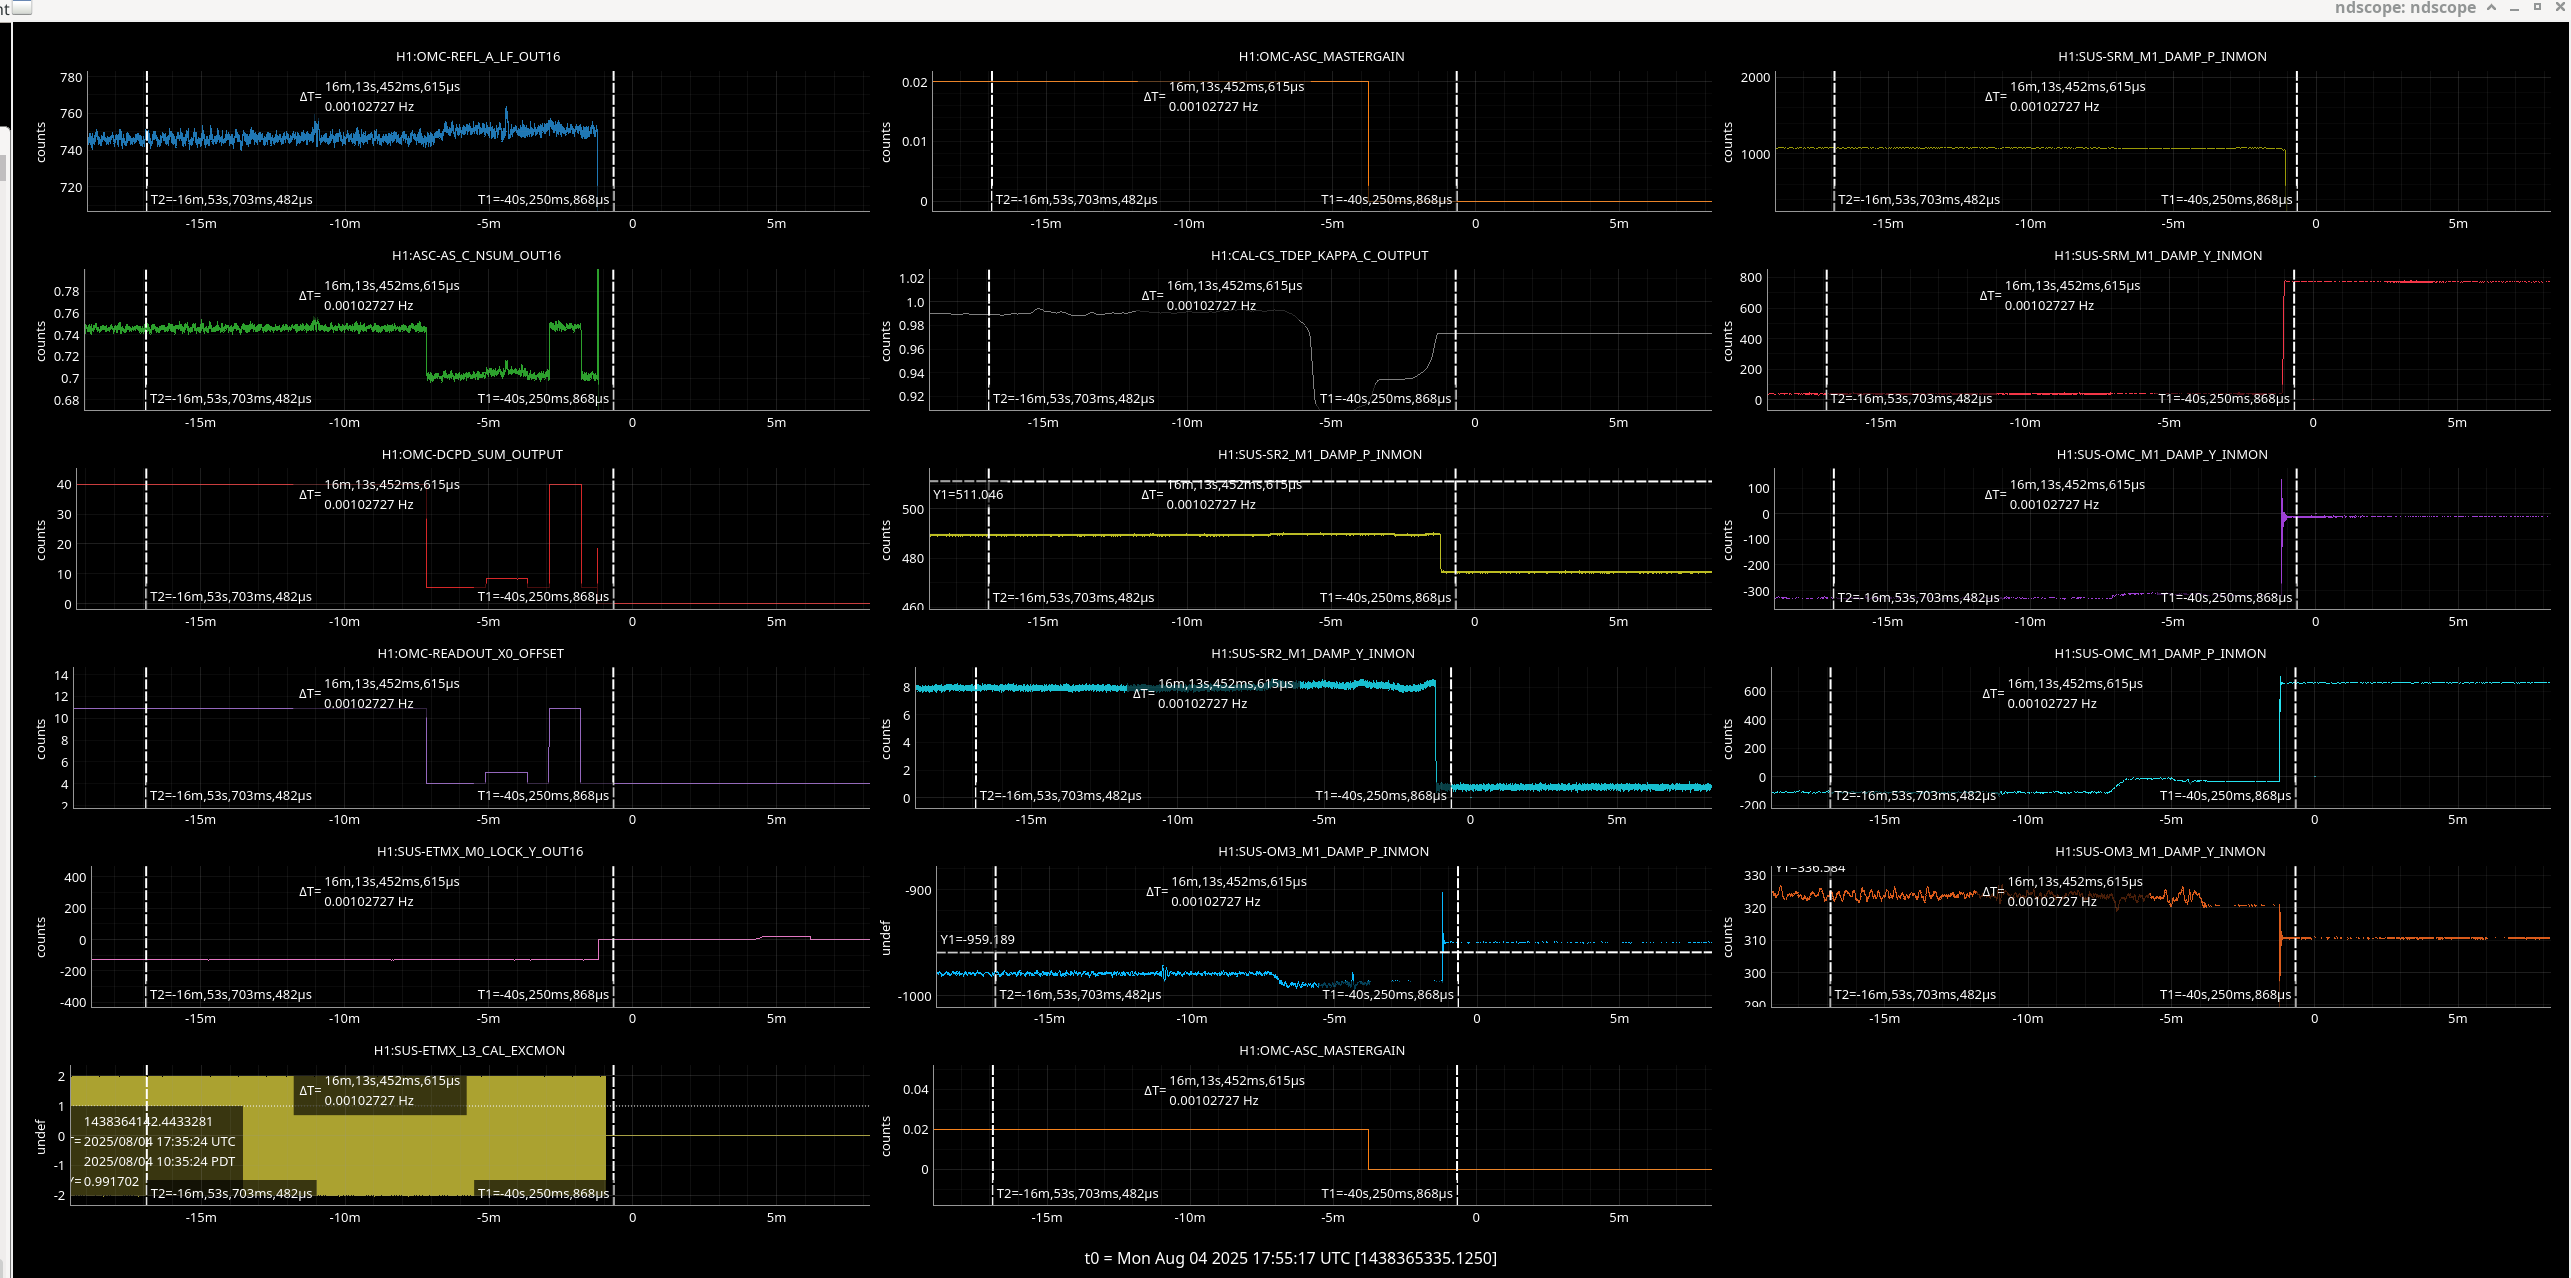
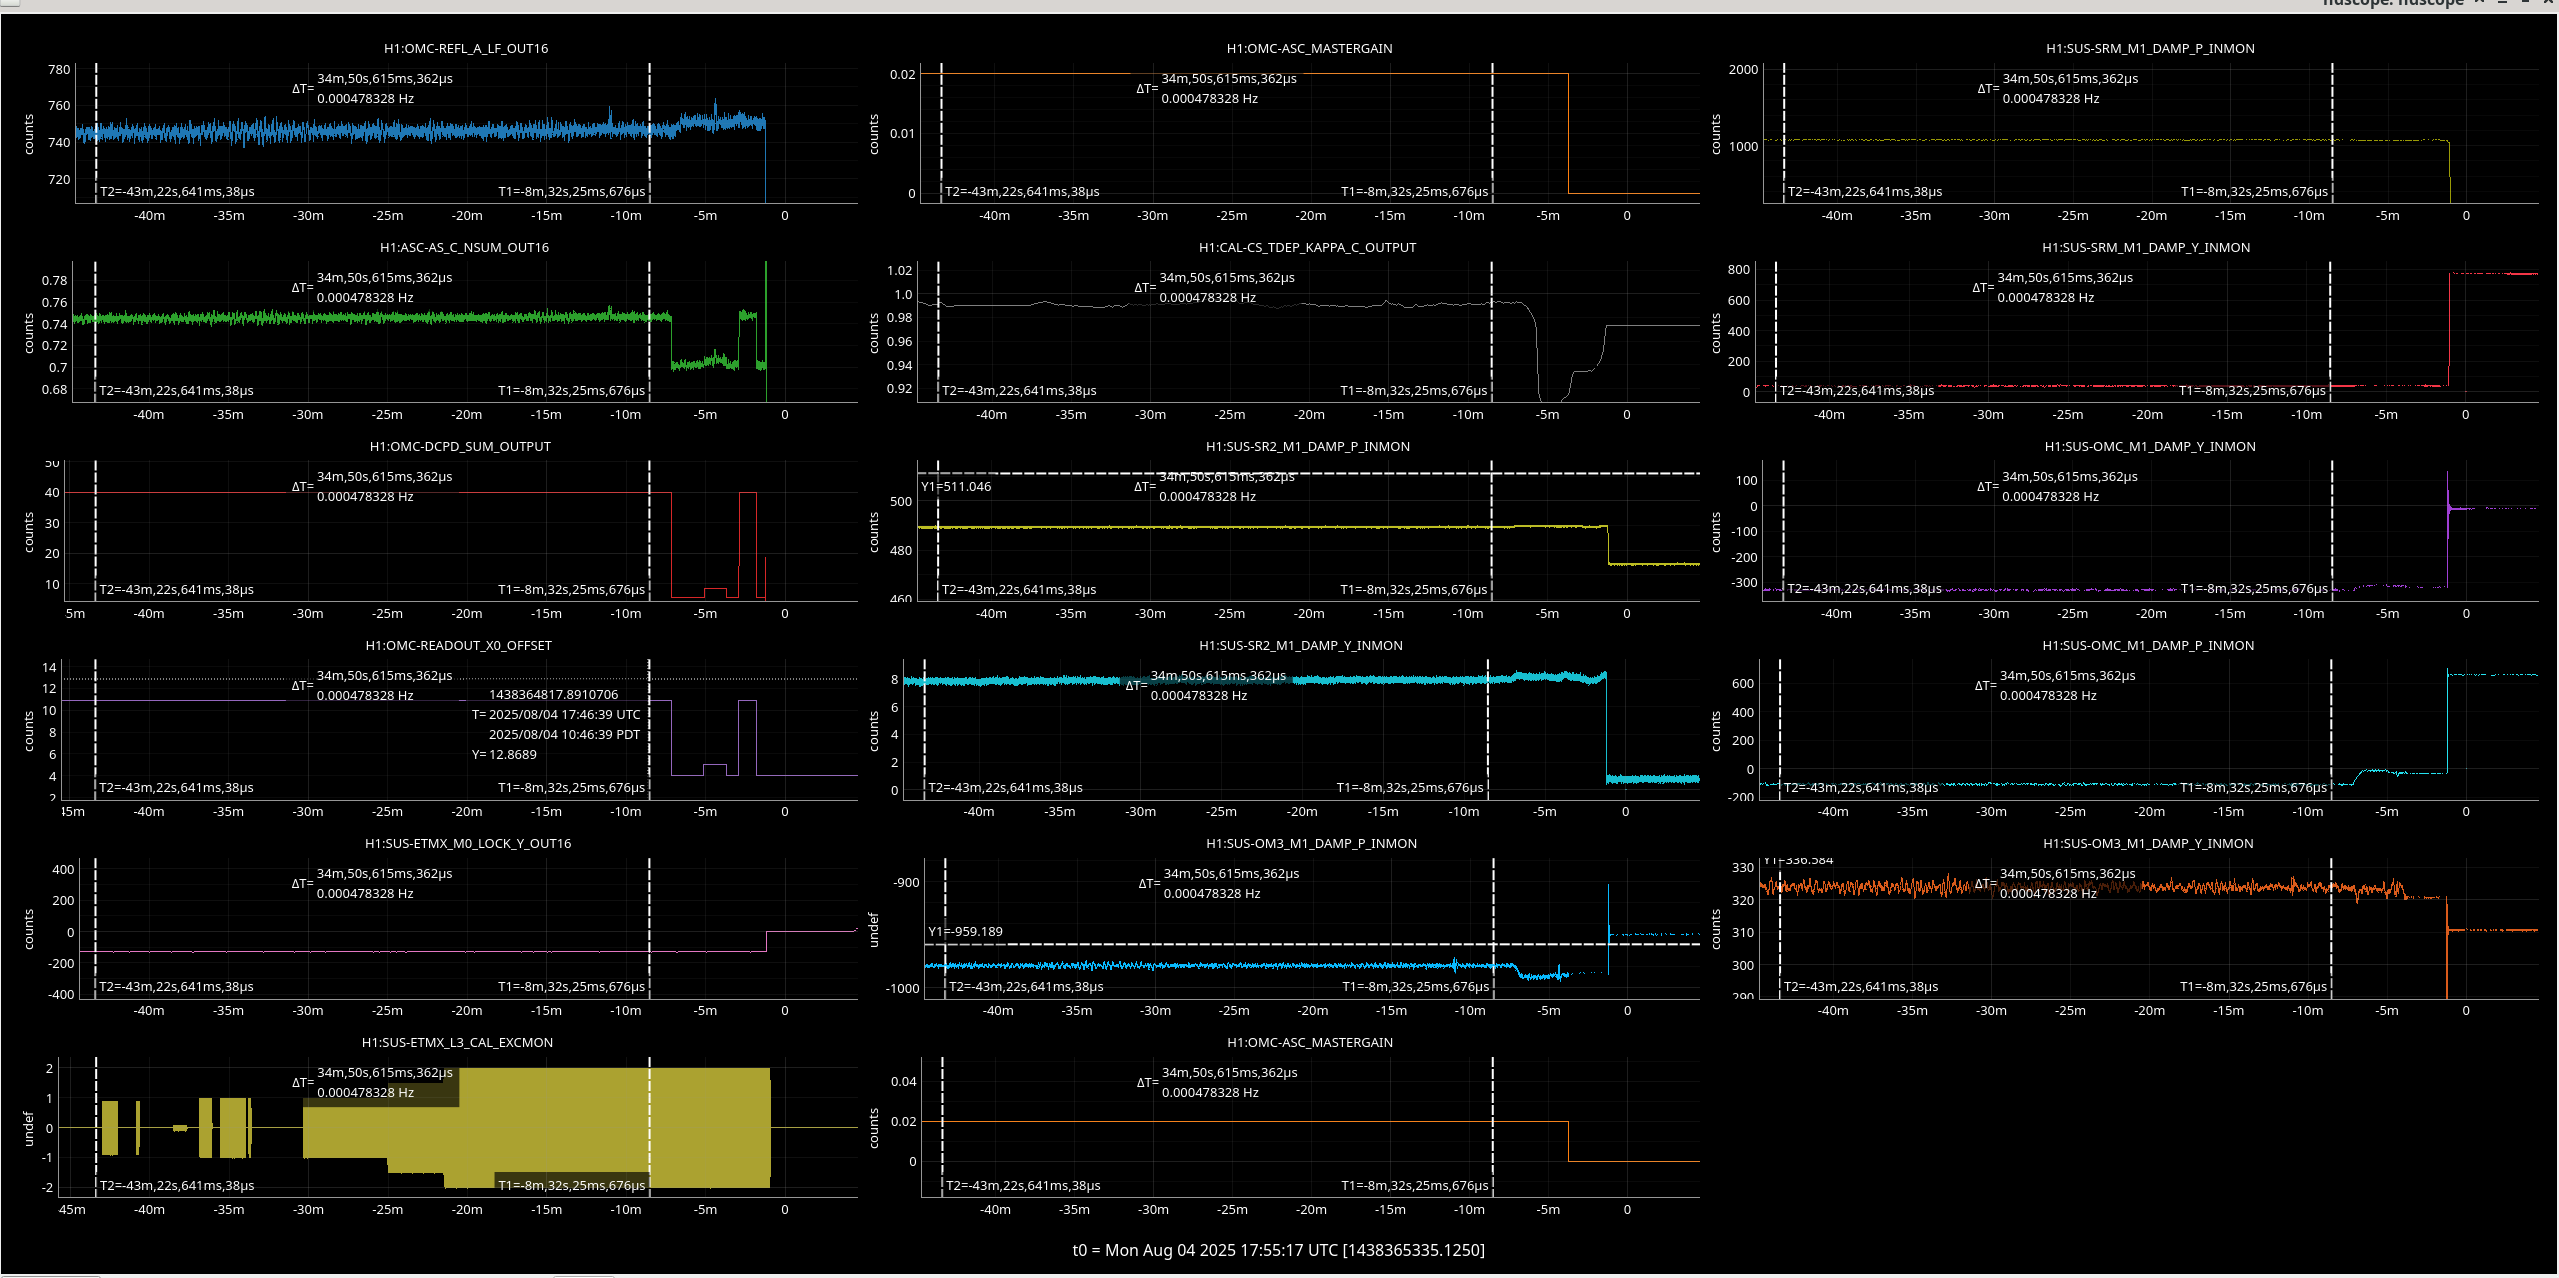
Summary: tried to use ETMX injection to tag light coming from the arms at the REFL port as we step the darm offset, didn't get a full measurement as we lost lock - seems unrelated.
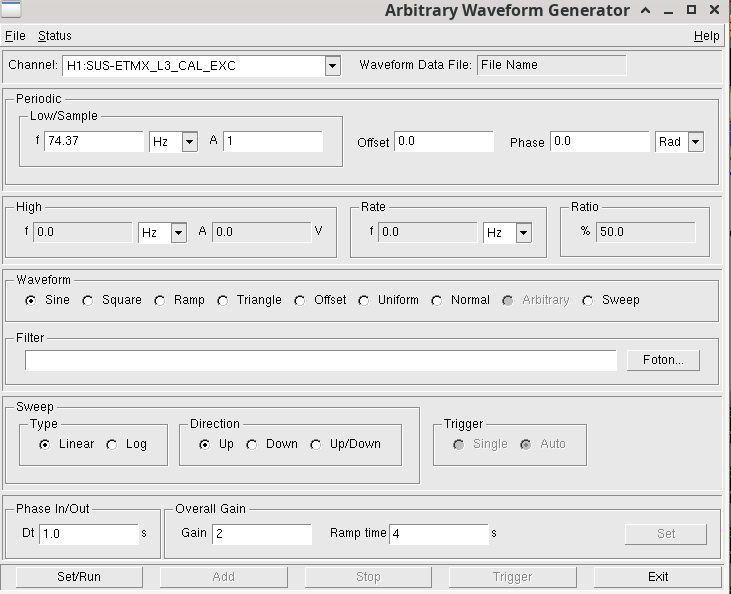
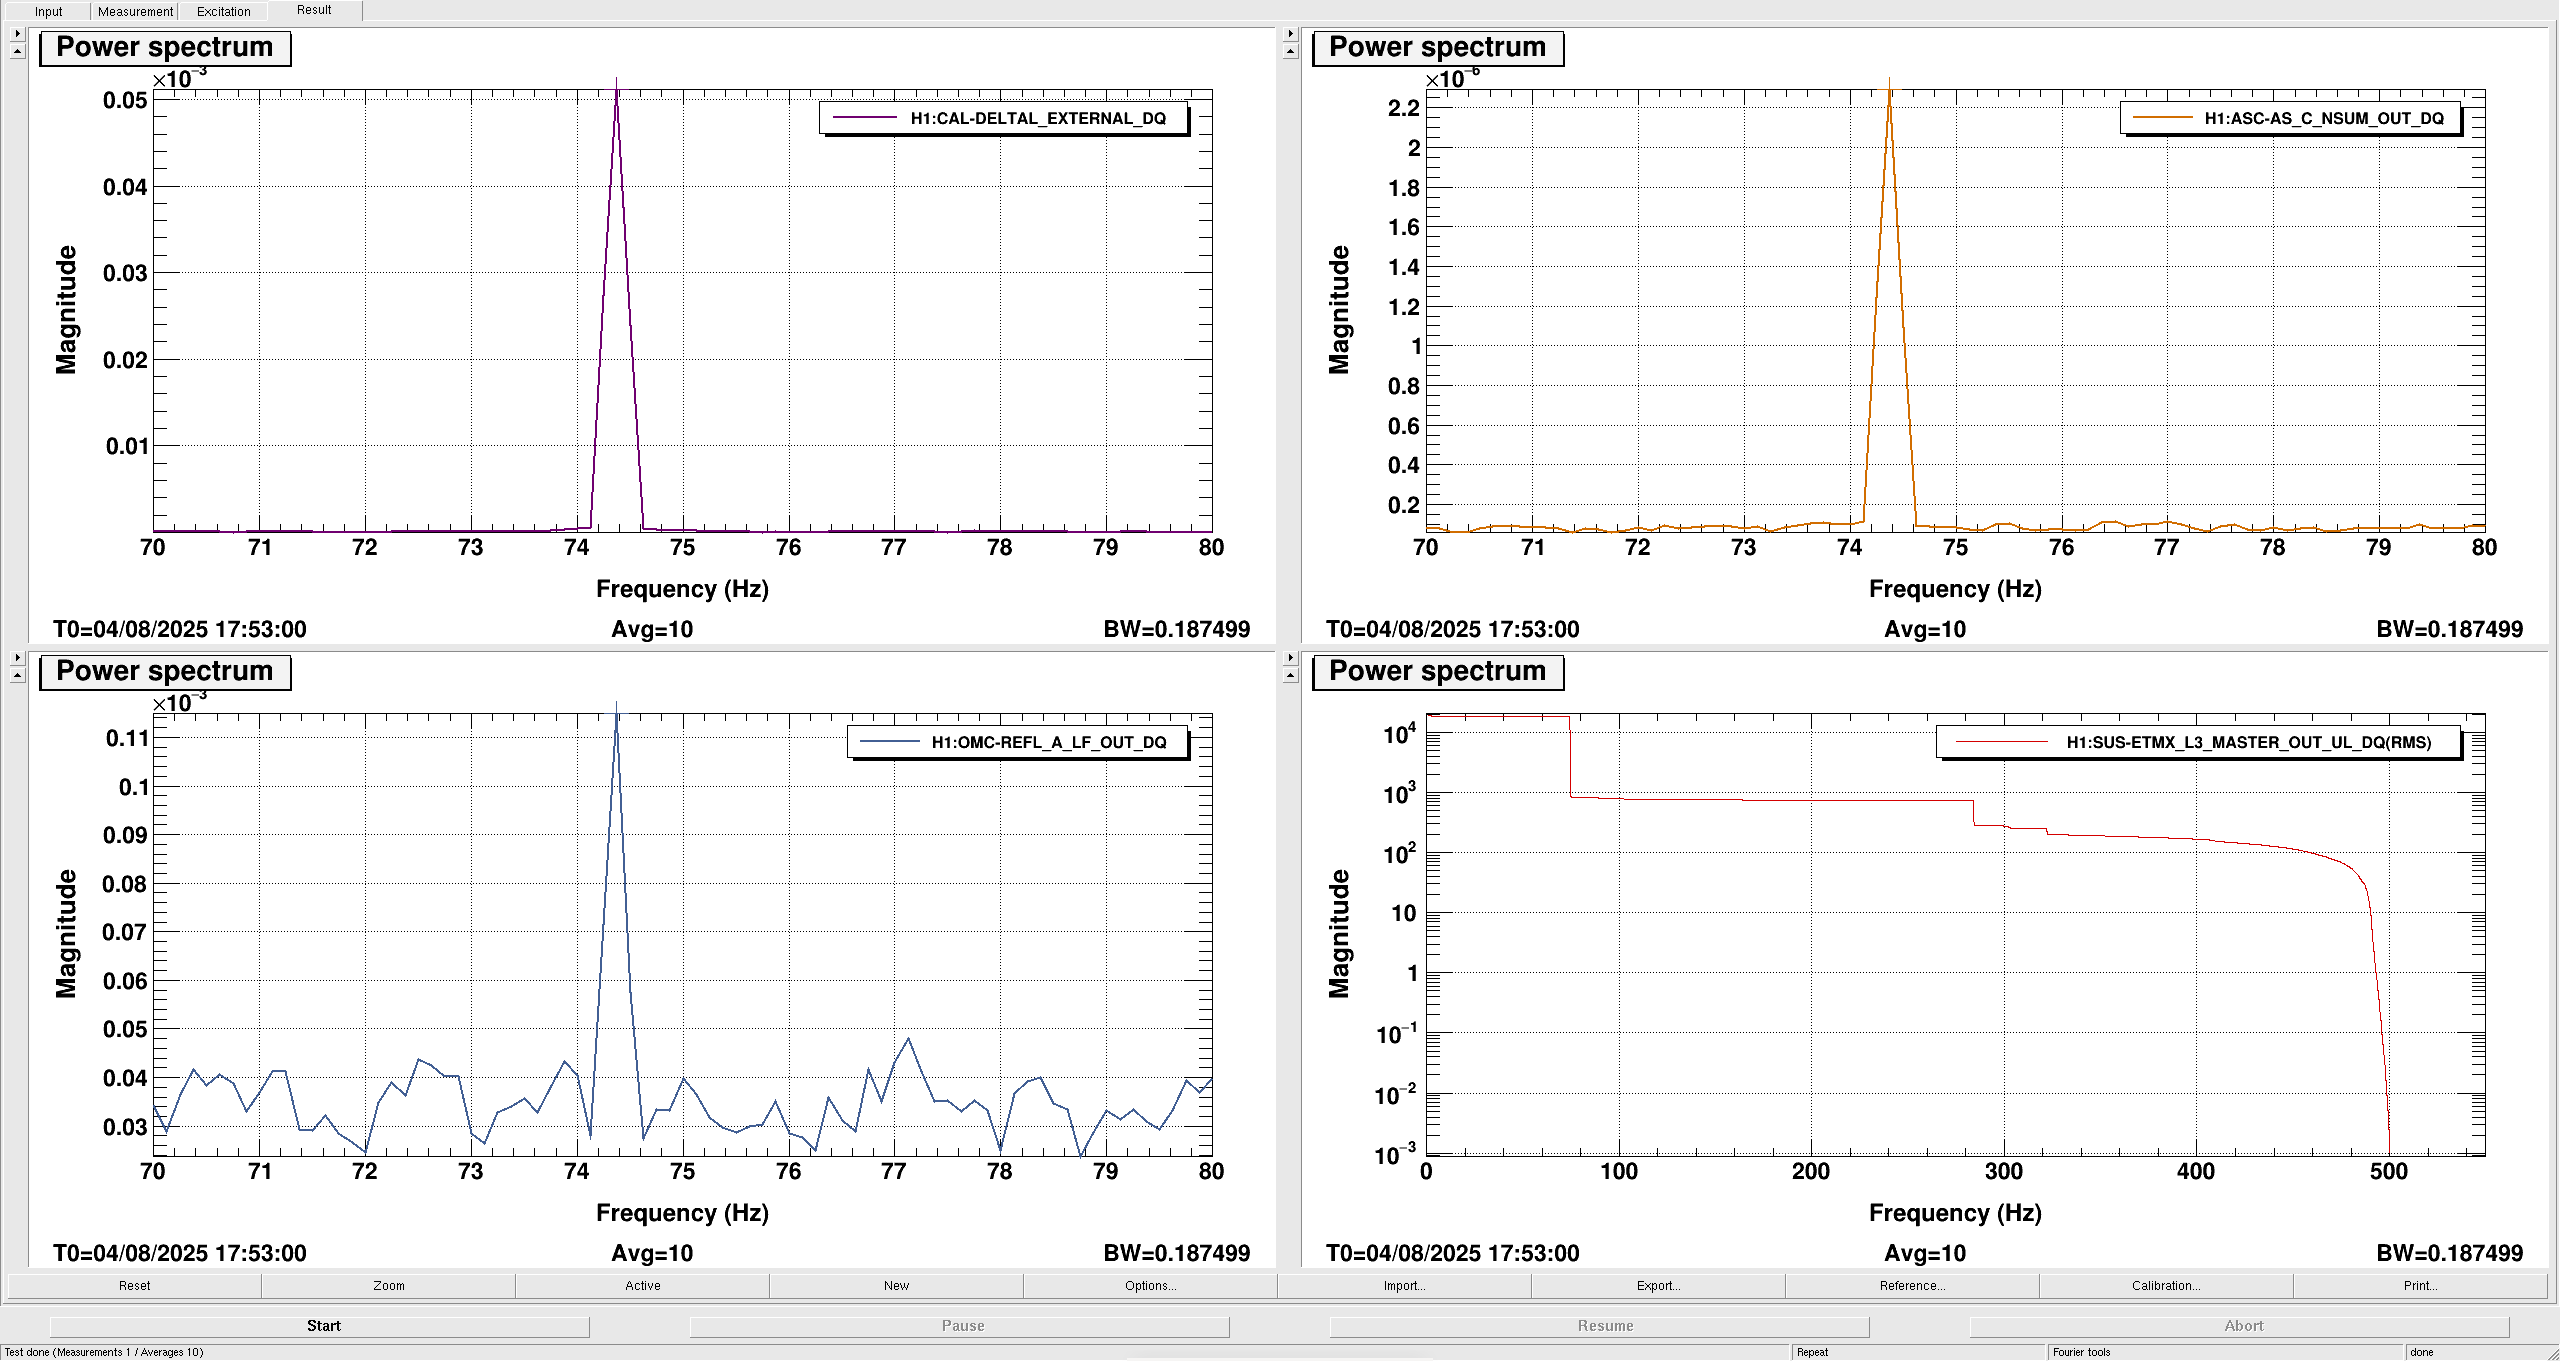
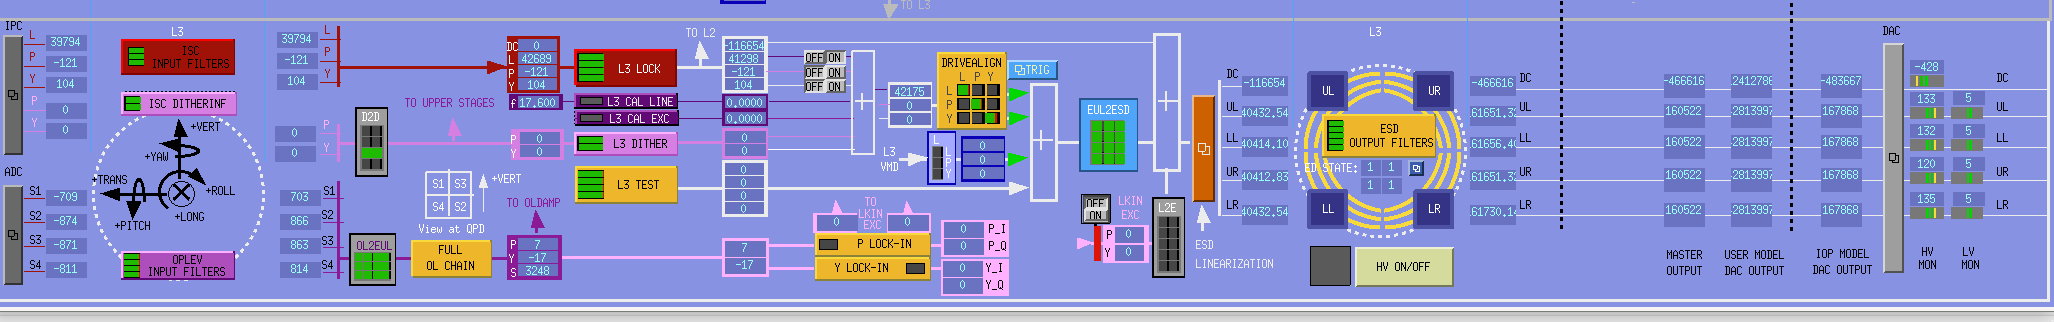
During the commissioning period and while Robert as doing shaker i jections, I tuned a line at 74.37 Hz on the SUS-ETMX_L3_CAL_EXC. This is the same point at which the ETMX CAL line input goes in (where the calibration exc for ETMX is injected into the DRIVEALIGN matrix). The psds shown were measured about a minute before lost lock and it can be seen that the rms motion in the upper left of the ETMX bottom mass is not reaching its limit.
The settings I used in AWG are shown in this photo.
After checking the height of the line in DARM, OMC REFL and the rms on the upper left ESD readout, I tried to take a darm offsert step measurement using autodarmpoffsetstep.py (using the ETMX line instead of the PCAL lines to readout the optical gain). To do this I comment out the setup_pcal_for_darm_offset_step and restore_pcal functions in autodarmoffsetstep.py before running it.
I had to the stop the measurement twice to trurn off the OMC ASC and put the X0 offset back to what it was before the measurement. One step into this measurement set we then lost lock (around 2 minutes into the final attempted DARM offset measurement). We can't see any evidence so far as this was the causer of lockloss as the line had been running for 40 minutes or so without breaking the lock.
Data is saved in an xml in /ligo/gitcommon/jennifer.wright/git/DARM_OFFSET
Got the folder reference wrong for the xml file, its actually in /ligo/home/jennifer.wright/git/2025/DARM_OFFSET.
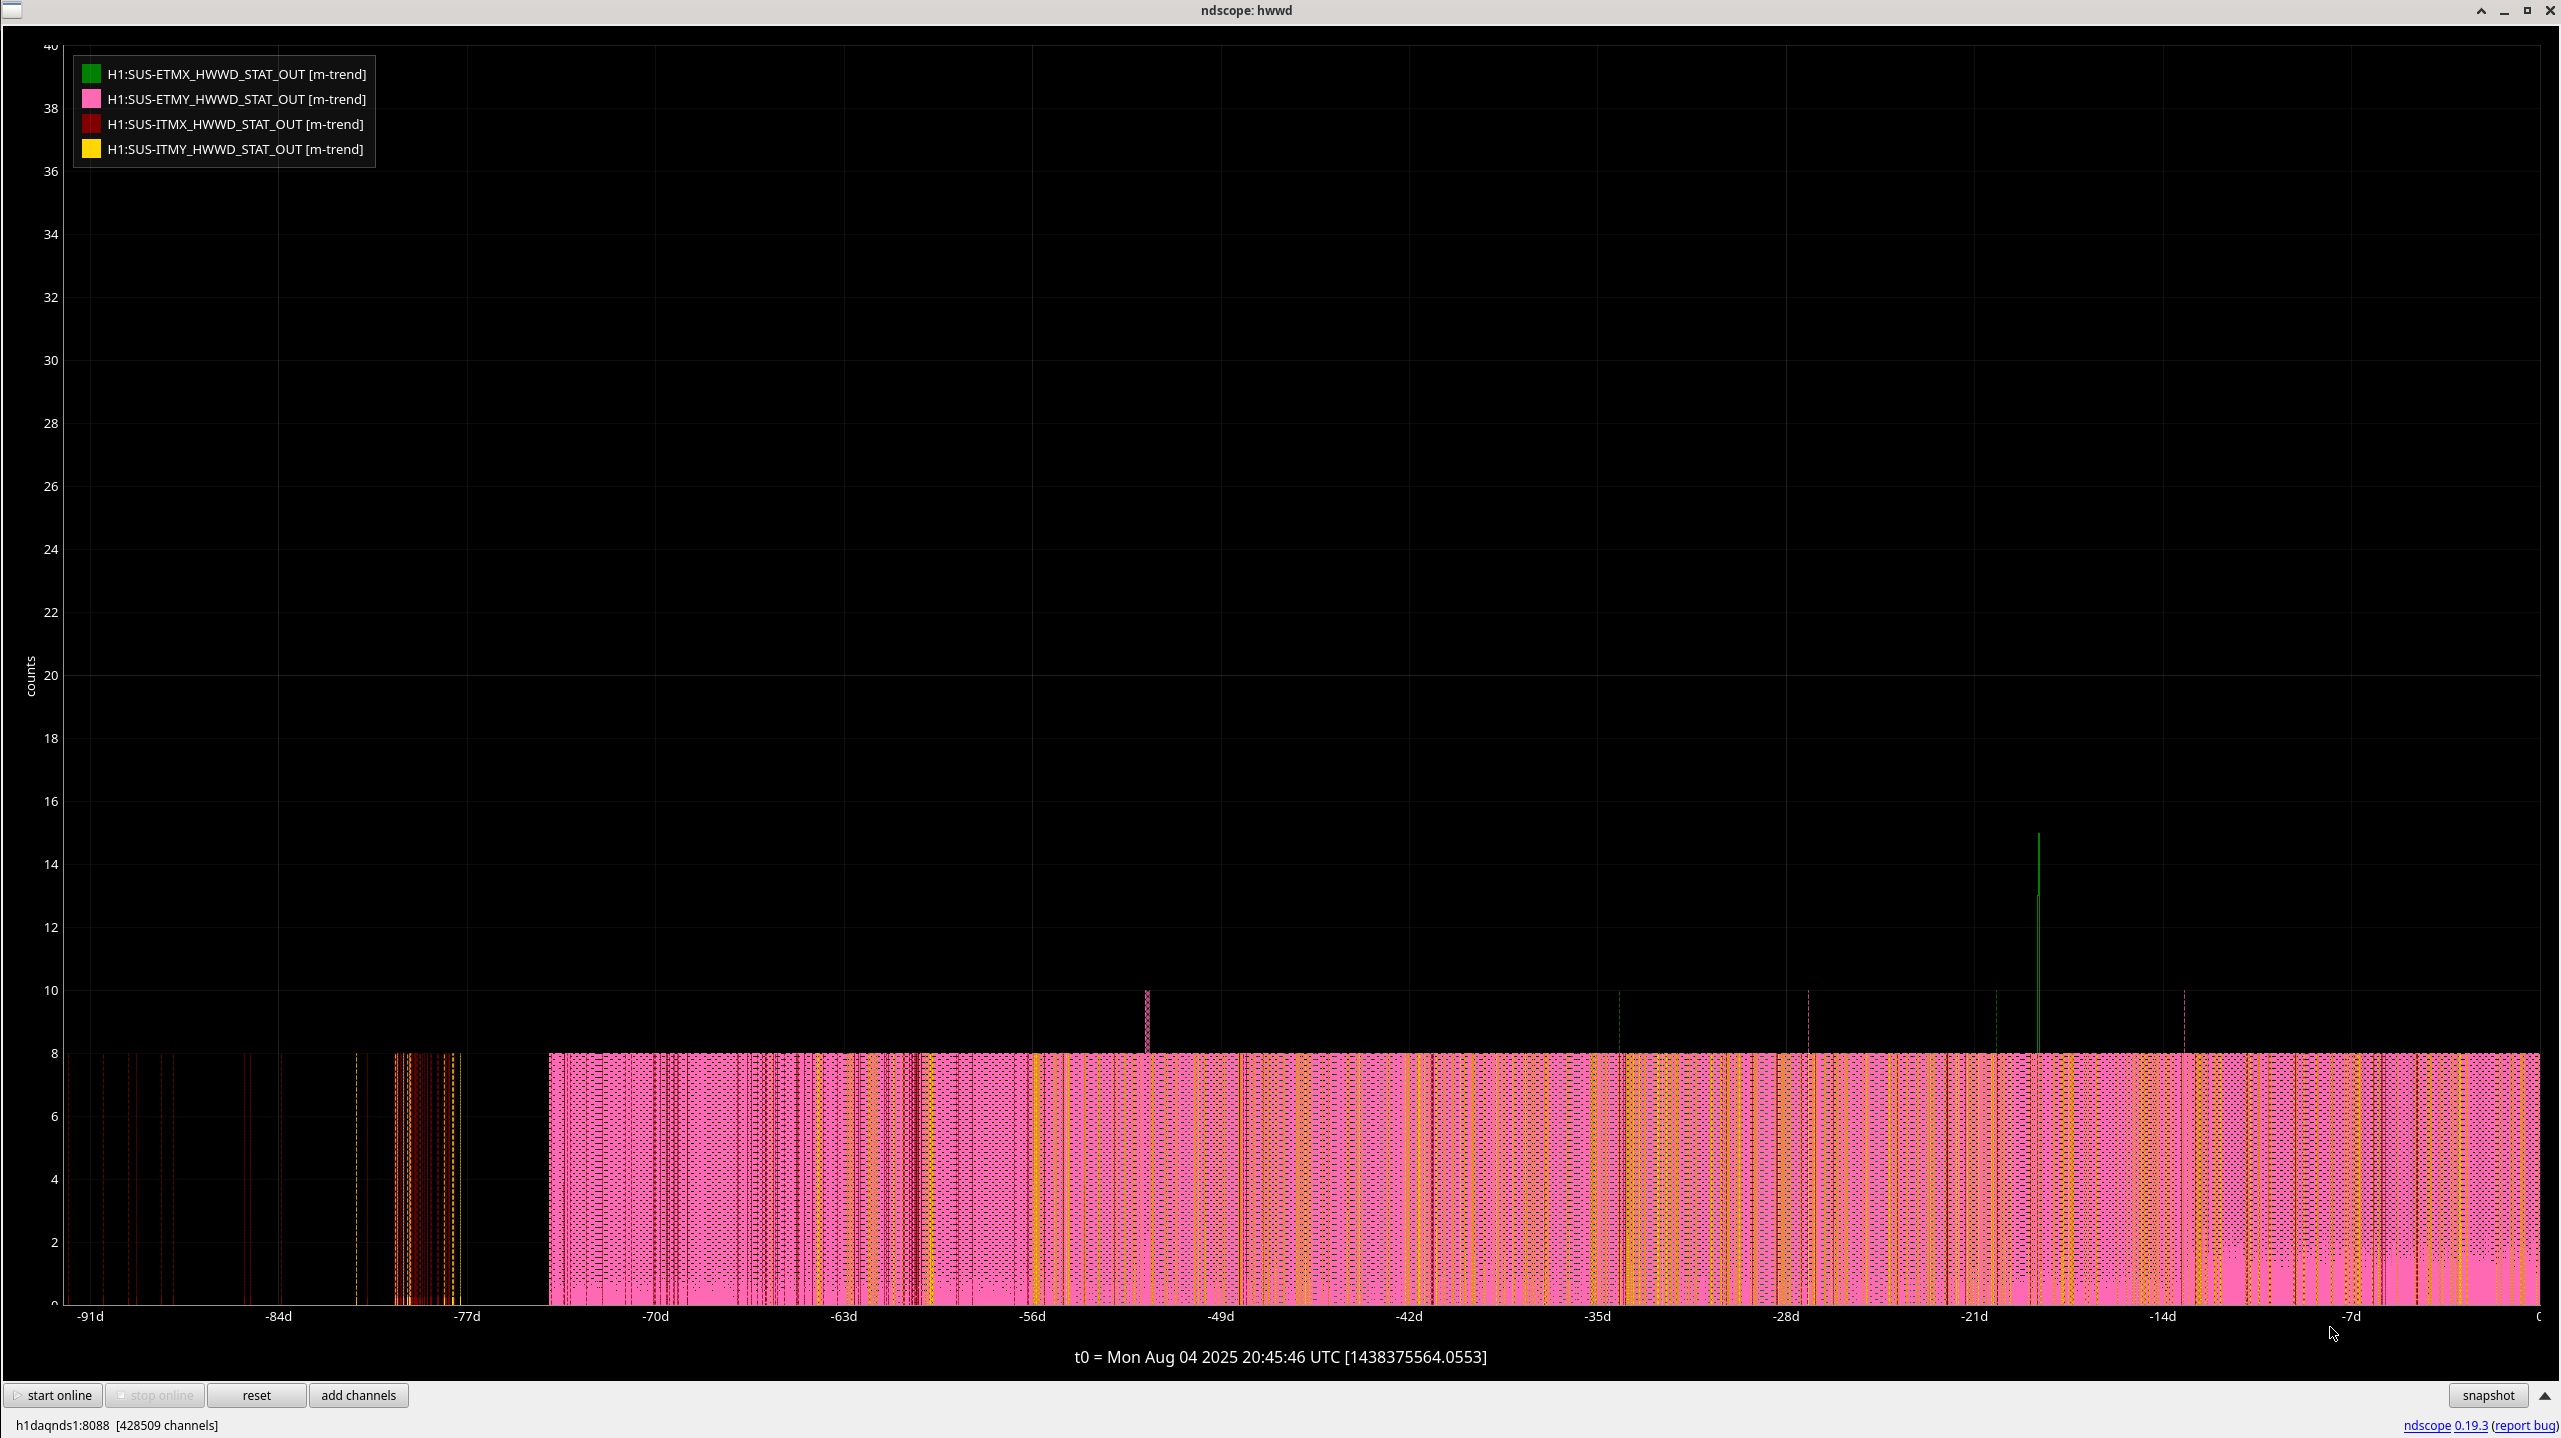
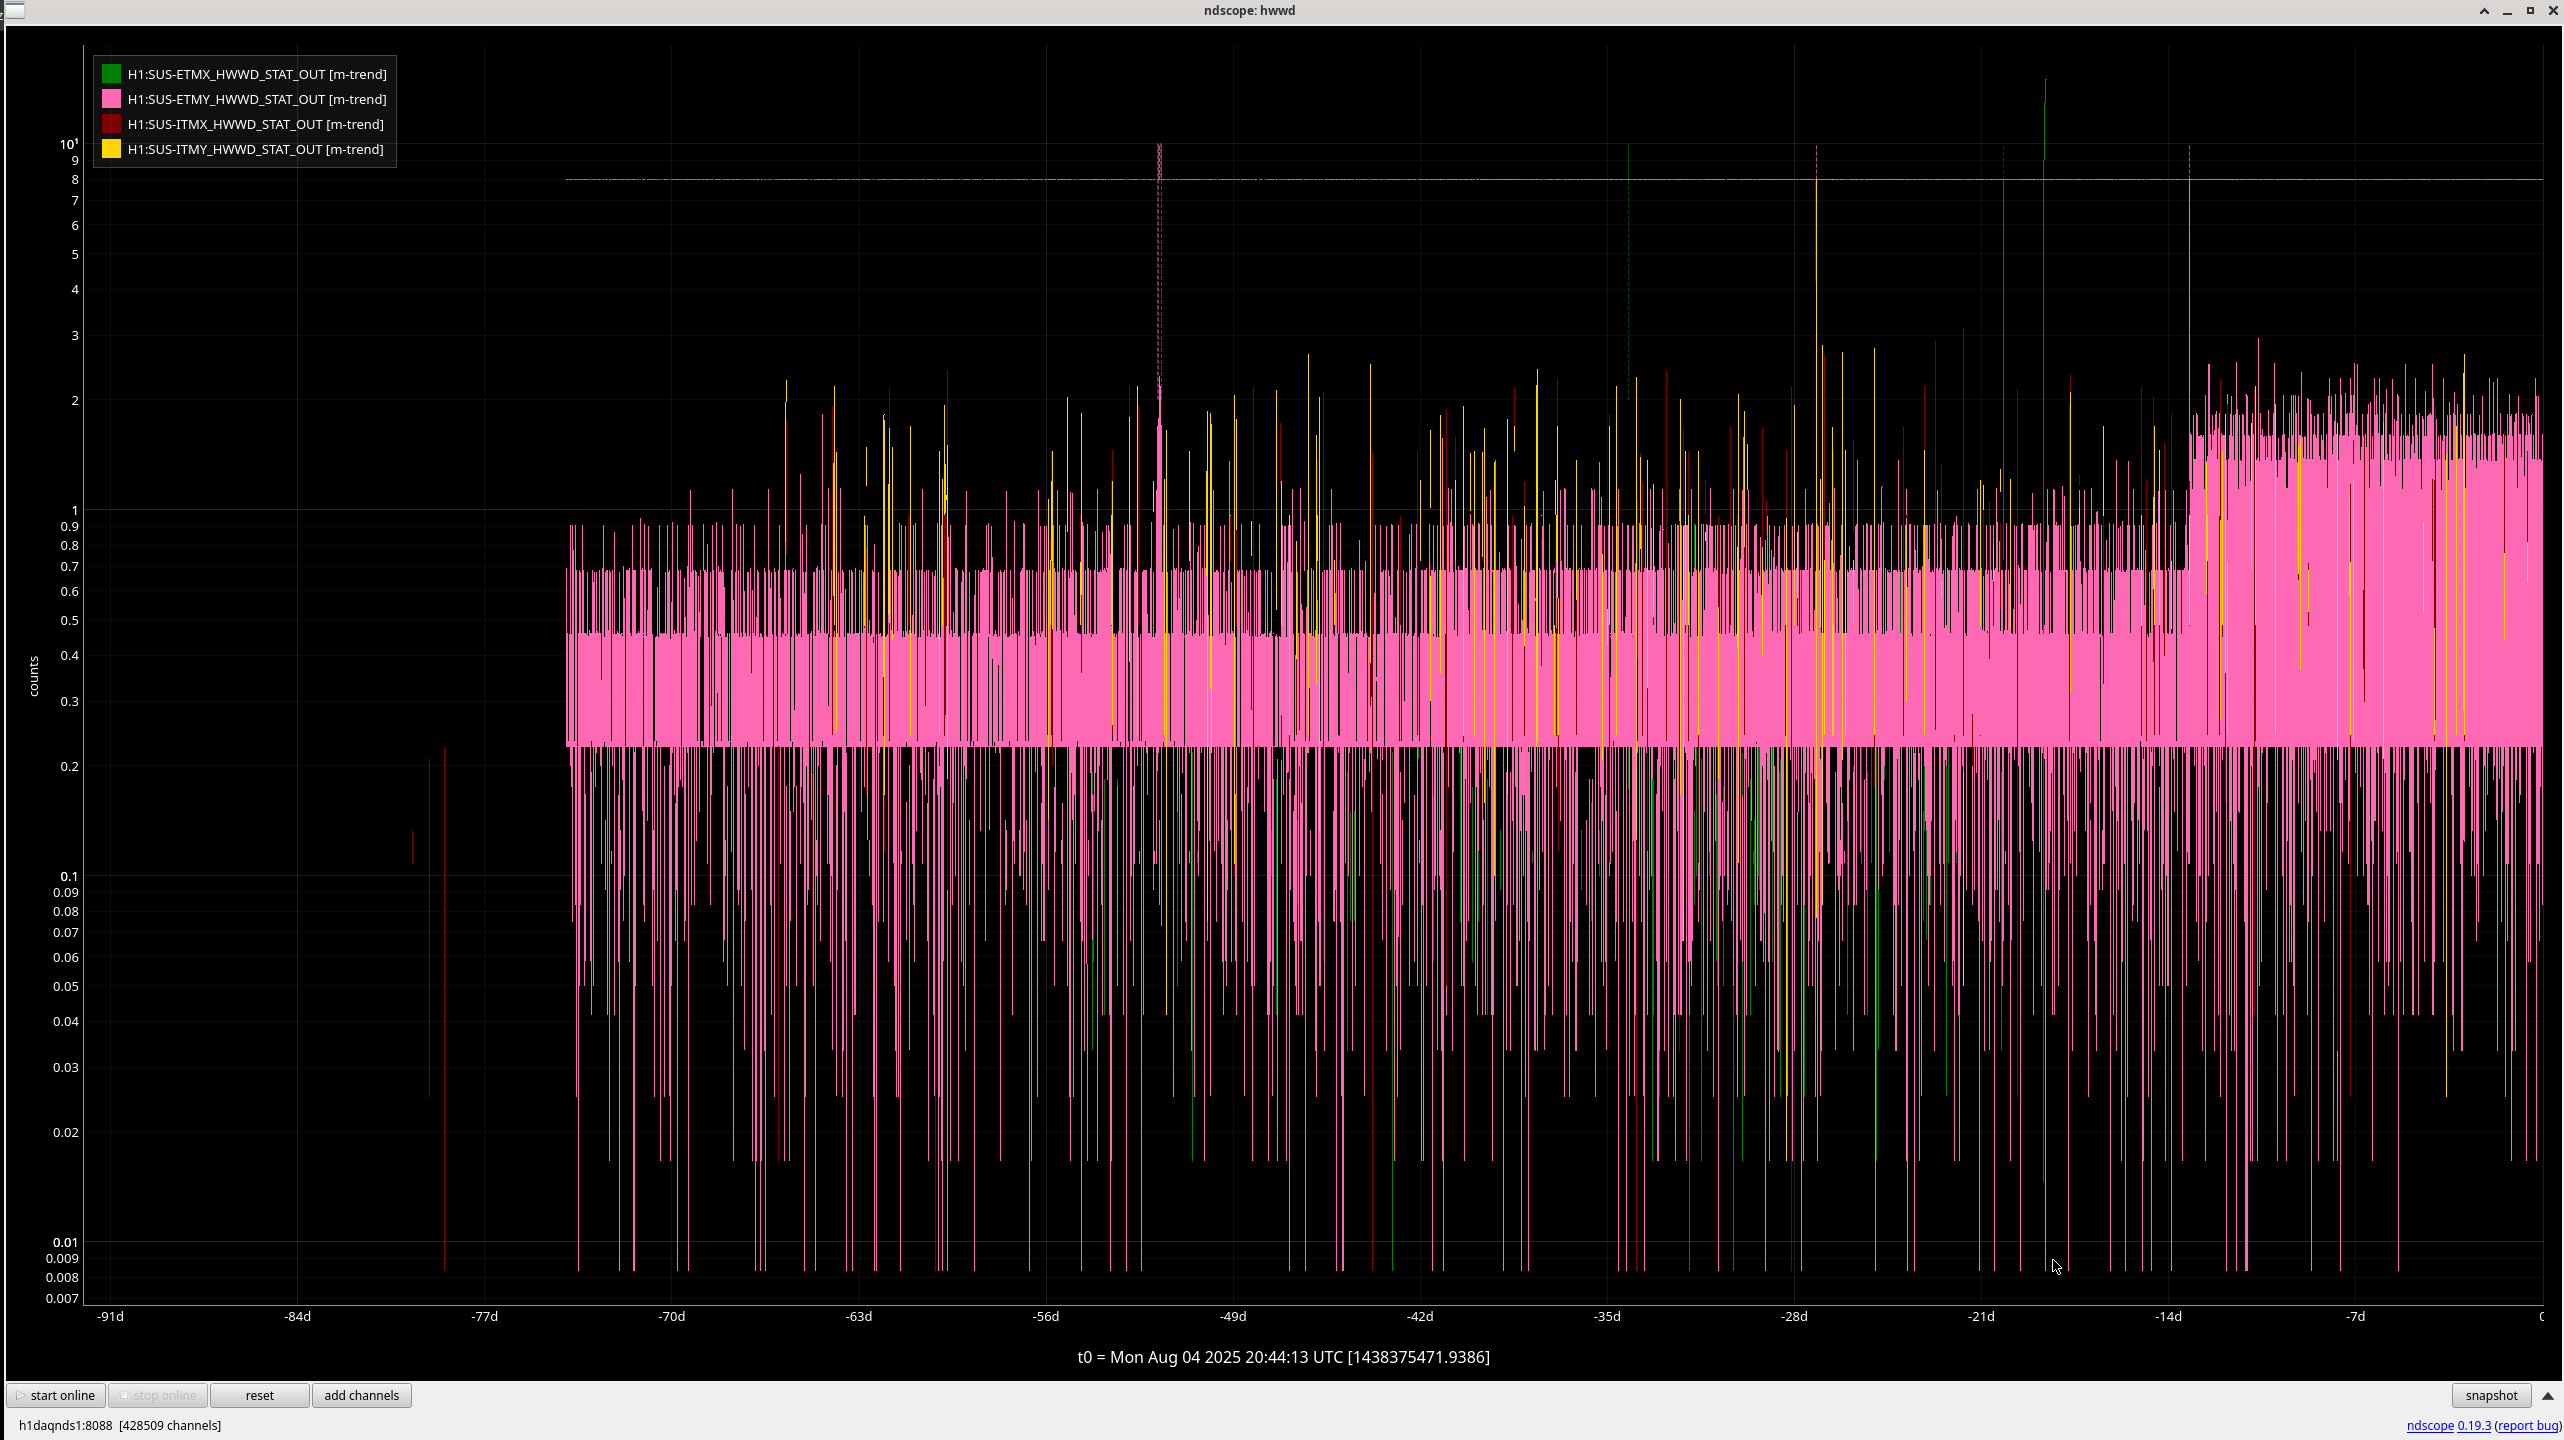
Plot of 3 months of Bit switching.
There are certainly bits switching on all of the channels.
Marked nad noticable increase in bit switching on May 22nd for ETMY which I believe is a known issue.
J. Kissel

I'm are trying to figure out the best metrics for showing off the improvements to the OSEM PD's satellite amplifier's whitening improvements.
Thus far, Oli's been using the input to the damping loops as the metric, using a regression of the corresponding ISI's GS13s to subract out a fit of how much of that sensor signal is seismic noise, and dividing out the loop suppression -- see LHO:86149 for the most recent examples comparing before vs. after the sat amp upgrade.
Without the presence of any other noise or control signals, that should be a fair comparison of the OSEM PD's sensor noise improvement.
However, for a lot of these comparisons ISC control signals are complicating the comparison -- usually at low frequency where ISC control is typically distributed to the top masses.

I use this aLOG as an example of how to better understand this contribution breakdown for a relatively simple suspension -- H1SUSMC1 -- which only has P and Y ISC control from the IMC WFS. (Longitudinal control for IMC L is fed to MC2). This will also be interesting in the future
    :: in the context of how SPI and other sensors may improve the cavity motion,
    :: in terms of what DOFs and loop's worth of control drive at which frequencies -- important for discussions along the lines of "DOF [blah] is dominating the control signal, and the actuator cross-coupling for M1 drive of DOF [blah] to M3 optic DOF [blorp] is large, so let's reduce the DOF [blah] drive," and
    :: in terms of whether/where implementing ISI GS13 estimator feedforward will improve things.

To understand how much of the damping loop *error* signal is composed of ISC *control* signal, I look compare the
    - the ISC control signal,
    - the DAMP *control* signal, against the
    - the MASTER total control request,
all calibrated to the same point in the control system -- where the control output is summed and in the OSEM basis; just down-stream of the EUL2OSEM matrix, and just upstream of the COILOUTF filters which compensate for the coil driver frequency response (uninteresting for this study).

Pitch -- the T1T2T3 actuators
    (3) Attachment 3 Pitch Noise Comparison excerpt from Oli's LHO:86149. These are times when the IMC was LOCKED, so there should be ISC control. But, see the expected factors of 2x-to3x improvement in the OSEM noise below ~5 Hz. So, maybe the ISC control is so low in bandwidth that its affect isn't impacting this study. But, we can see that there's clearly some other loop suppression that has not been accounted for, so maybe it *is* high bandwidth? Let's find out.
    (1) Attachment 1 Comparison of ISC pitch, DAMP pitch, as well as the other DAMP DOFs that use the T1, T2, and T3 actuators -- Vertical and Roll -- control signals.
    Here, we can clearly see that the damping loops are dominating the T2 (and thus T3) control signal above ~ 0.5 Hz, or conversely, the IMC WFS DC coupled control is dominating below 0.5 Hz.
    (2) Attachment 2 shows that the T2 and T3 sensors receive identical request (mostly an out-of-phase combination of Pitch and Roll damping request, as expected from the EUL2OSEM matrix), and T1 drives mostly Roll damping request. The vertical drive request is subdominant at all frequencies.
    (3) Attachment 4 shows the open loop gain and loop suppression TF magnitudes for pitch. The loop suppression here looks very much like the inverse of the shape of the ASD left in the pitch regression, making me worried that Oli's automated regime for removing the loop suppression isn't perfect... I'll ask.

Yaw -- the LFRT actuators
    (7) Attachment 7 The before vs. after comparison of OSEM noise
    (5) Attachment 5 Similar comparison of ISC vs. relevant DAMP control -- showing IMC WFS control dominating only below ~0.2 Hz.
    (6) Attachment 6 As expected from the EUL2OSEM matrix, the LF and RT actuators receive the same control.
    (8) Attachment 8 Shows the open loop gain and loop suppression TF magnitudes for the Yaw damping loop.


"[...] Attachment 4 shows the open loop gain and loop suppression TF magnitudes for pitch. The loop suppression here looks very much like the inverse of the shape of the ASD left in the pitch regression, making me worried that Oli's automated regime for removing the loop suppression isn't perfect... I'll ask.

Followed up wth Oli on this, and indeed there was a bug in the application of the loop suppression -- a blind python "dir" of the optic's directory for exported loop suppression text files returned the list of files alphabetically (L,P,R,T,V,Y) rather than in the canonical order of (L,T,V,R,P,Y) so that means the P suppression was taken out of the T ASD, etc.

They've fixed that now (and added the loop suppression itself to the ASD plot as a visual aide) -- here's a sample of the improved MC1 P and Y, before vs. after plot.


The actual full results for MC1 can be found in 86253
No obvious cause yet. Commissioning was going on at that time, but no activity seems suspect.
Relocking took a 3hr45min, mostly because we couldn't get DRMI to lock. I first tried locking without an initial alignment and then DRMI had little to no flashes, so I initiated an alignment. It went through quickly and without issue. Then when trying to lock DRMI again it would have great flashes and triggers, but it would rarely catch. The few times it did, we didn't make it much further before we had a lock loss.
I tried PRMI a few times and then I was reminded that we needed to touch up PRM since we don't have any ASC that will touch that up in this state. I ended up slightly moving PRM to increase POP 90, and then tried DRMI again. 7min later it locked and we made it all the way up to NLN.
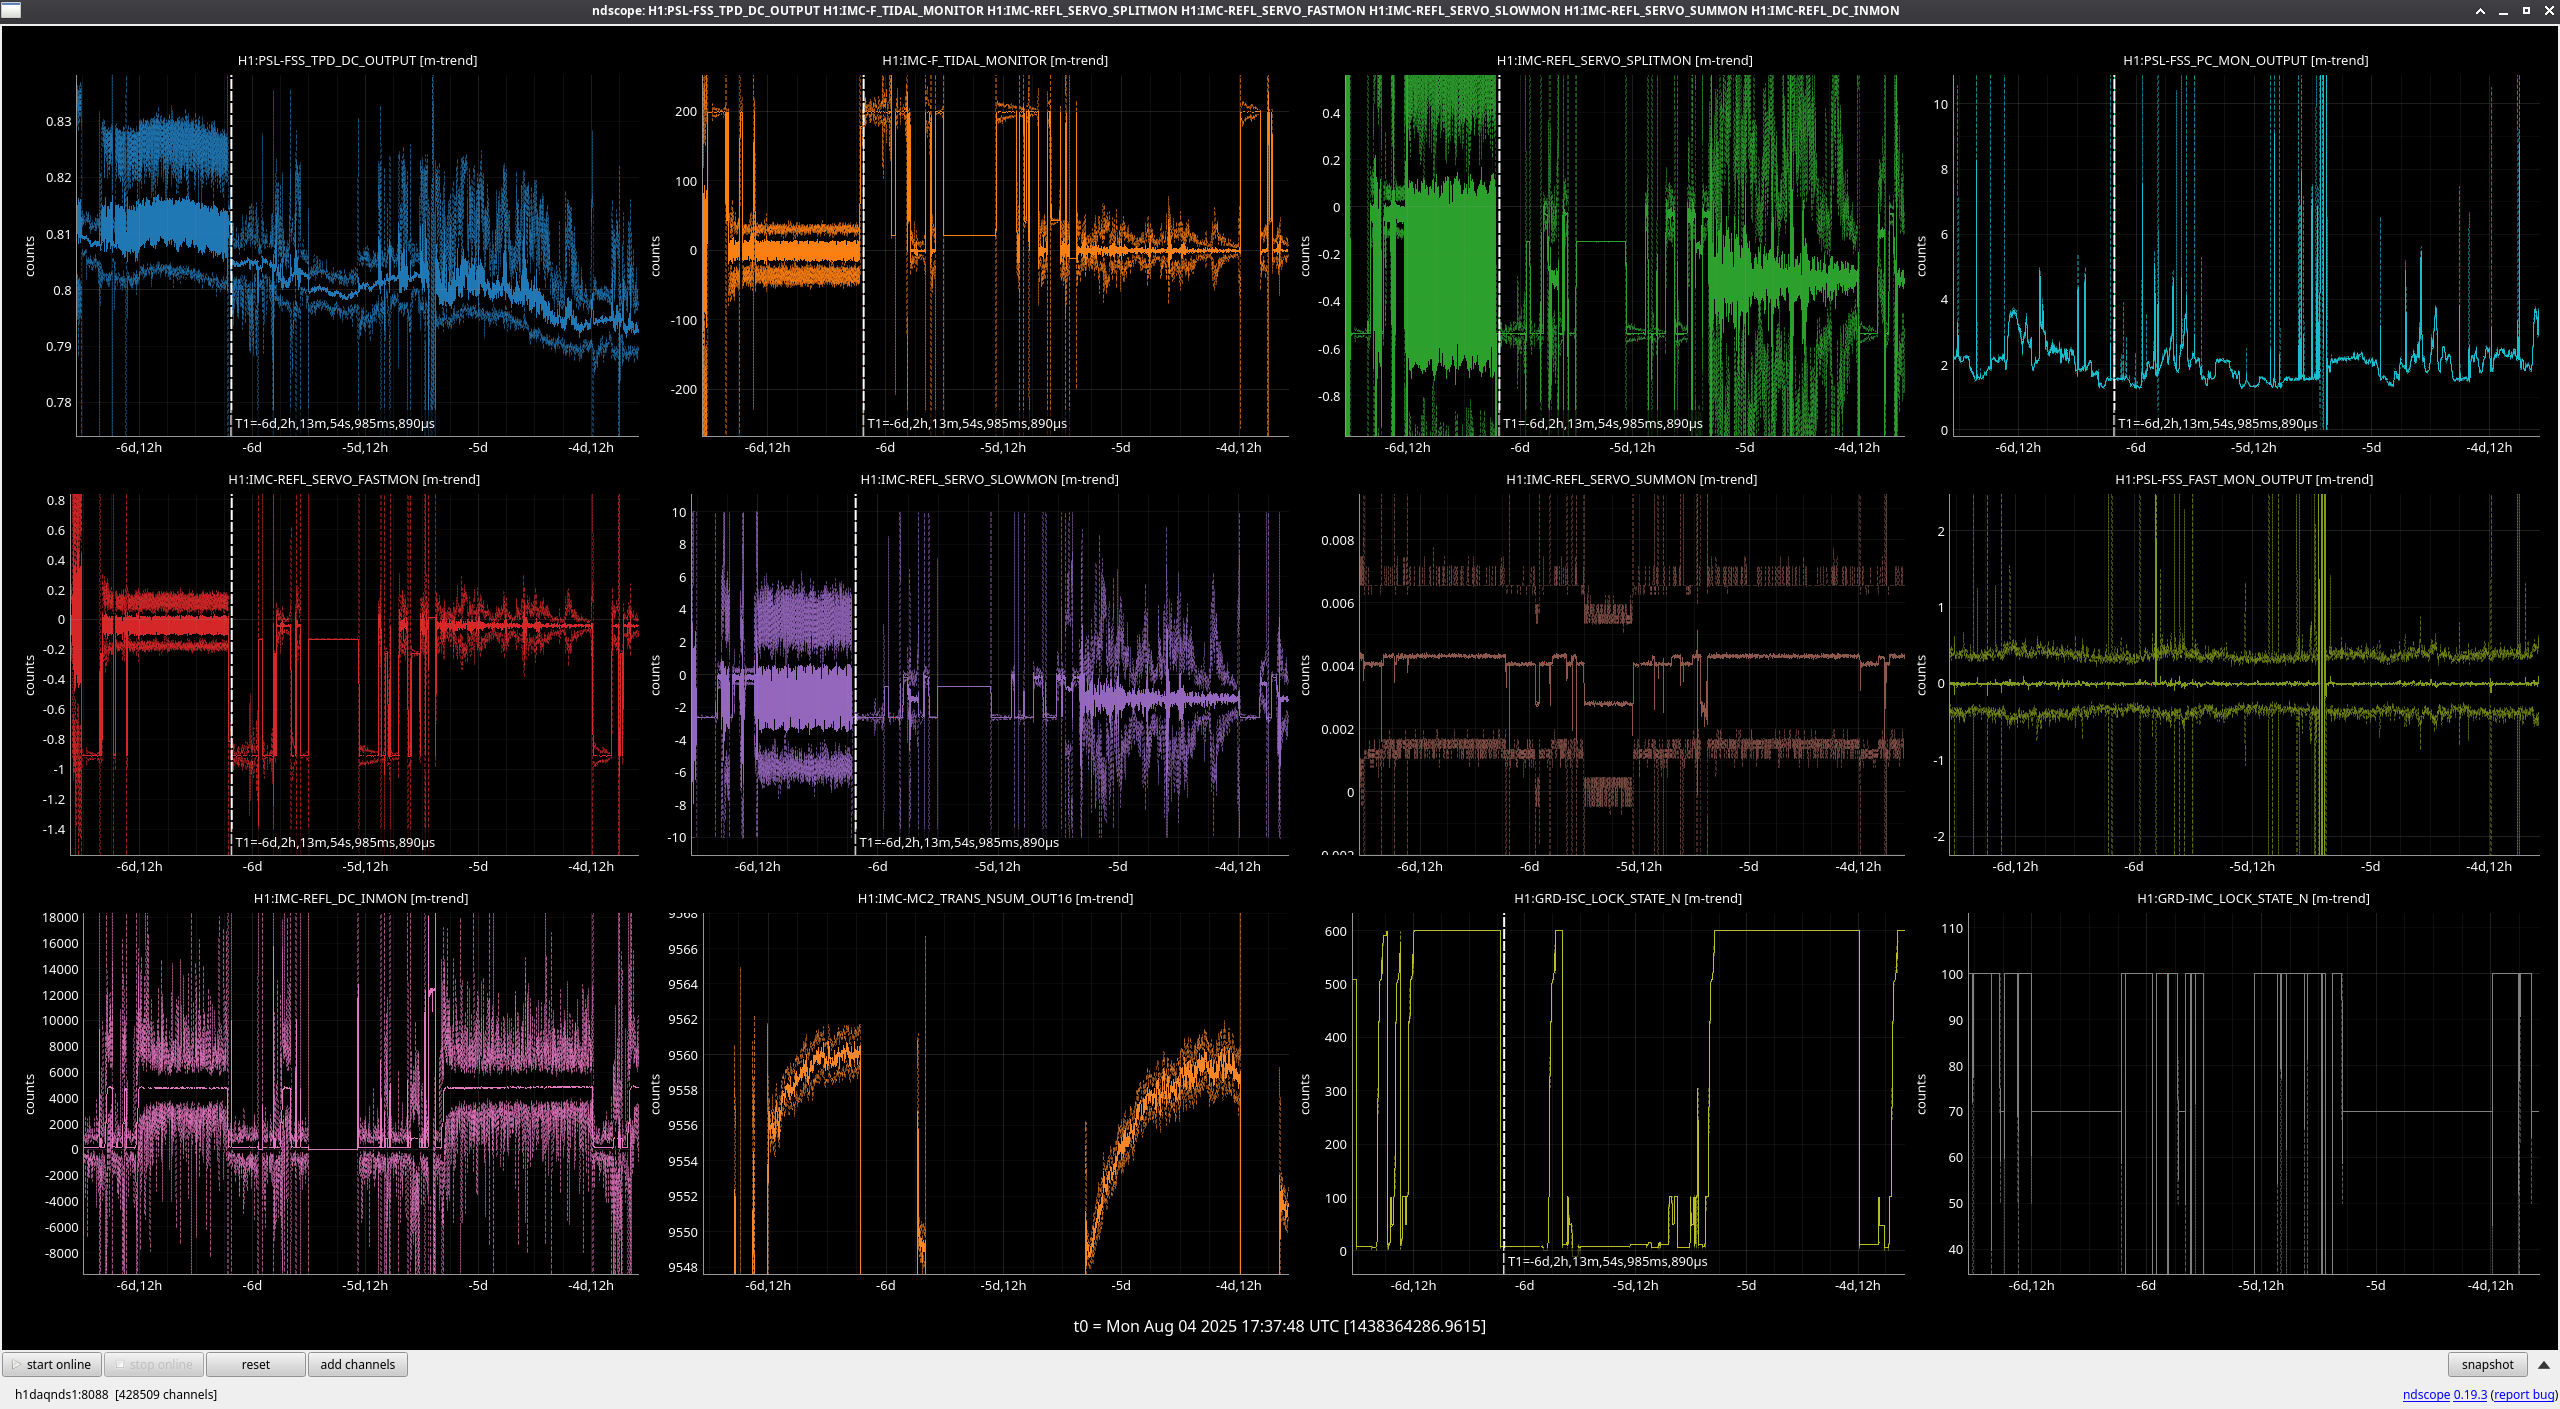
FAMIS 31097
Looks like only things happening this past week are the FSS TPD signal is dropping, so the RefCav may need some alignment touchup soon, and the mysterious jumps in the TPD signal I first saw a couple weeks ago seem to have stopped as of last Tuesday. Looking at some IMC signals (final screenshot), these show the same behavior of calming down last Tuesday, however, I can't explain what would have changed that day to affect the feedback from the IMC to the FSS.


Sheila, Camilla
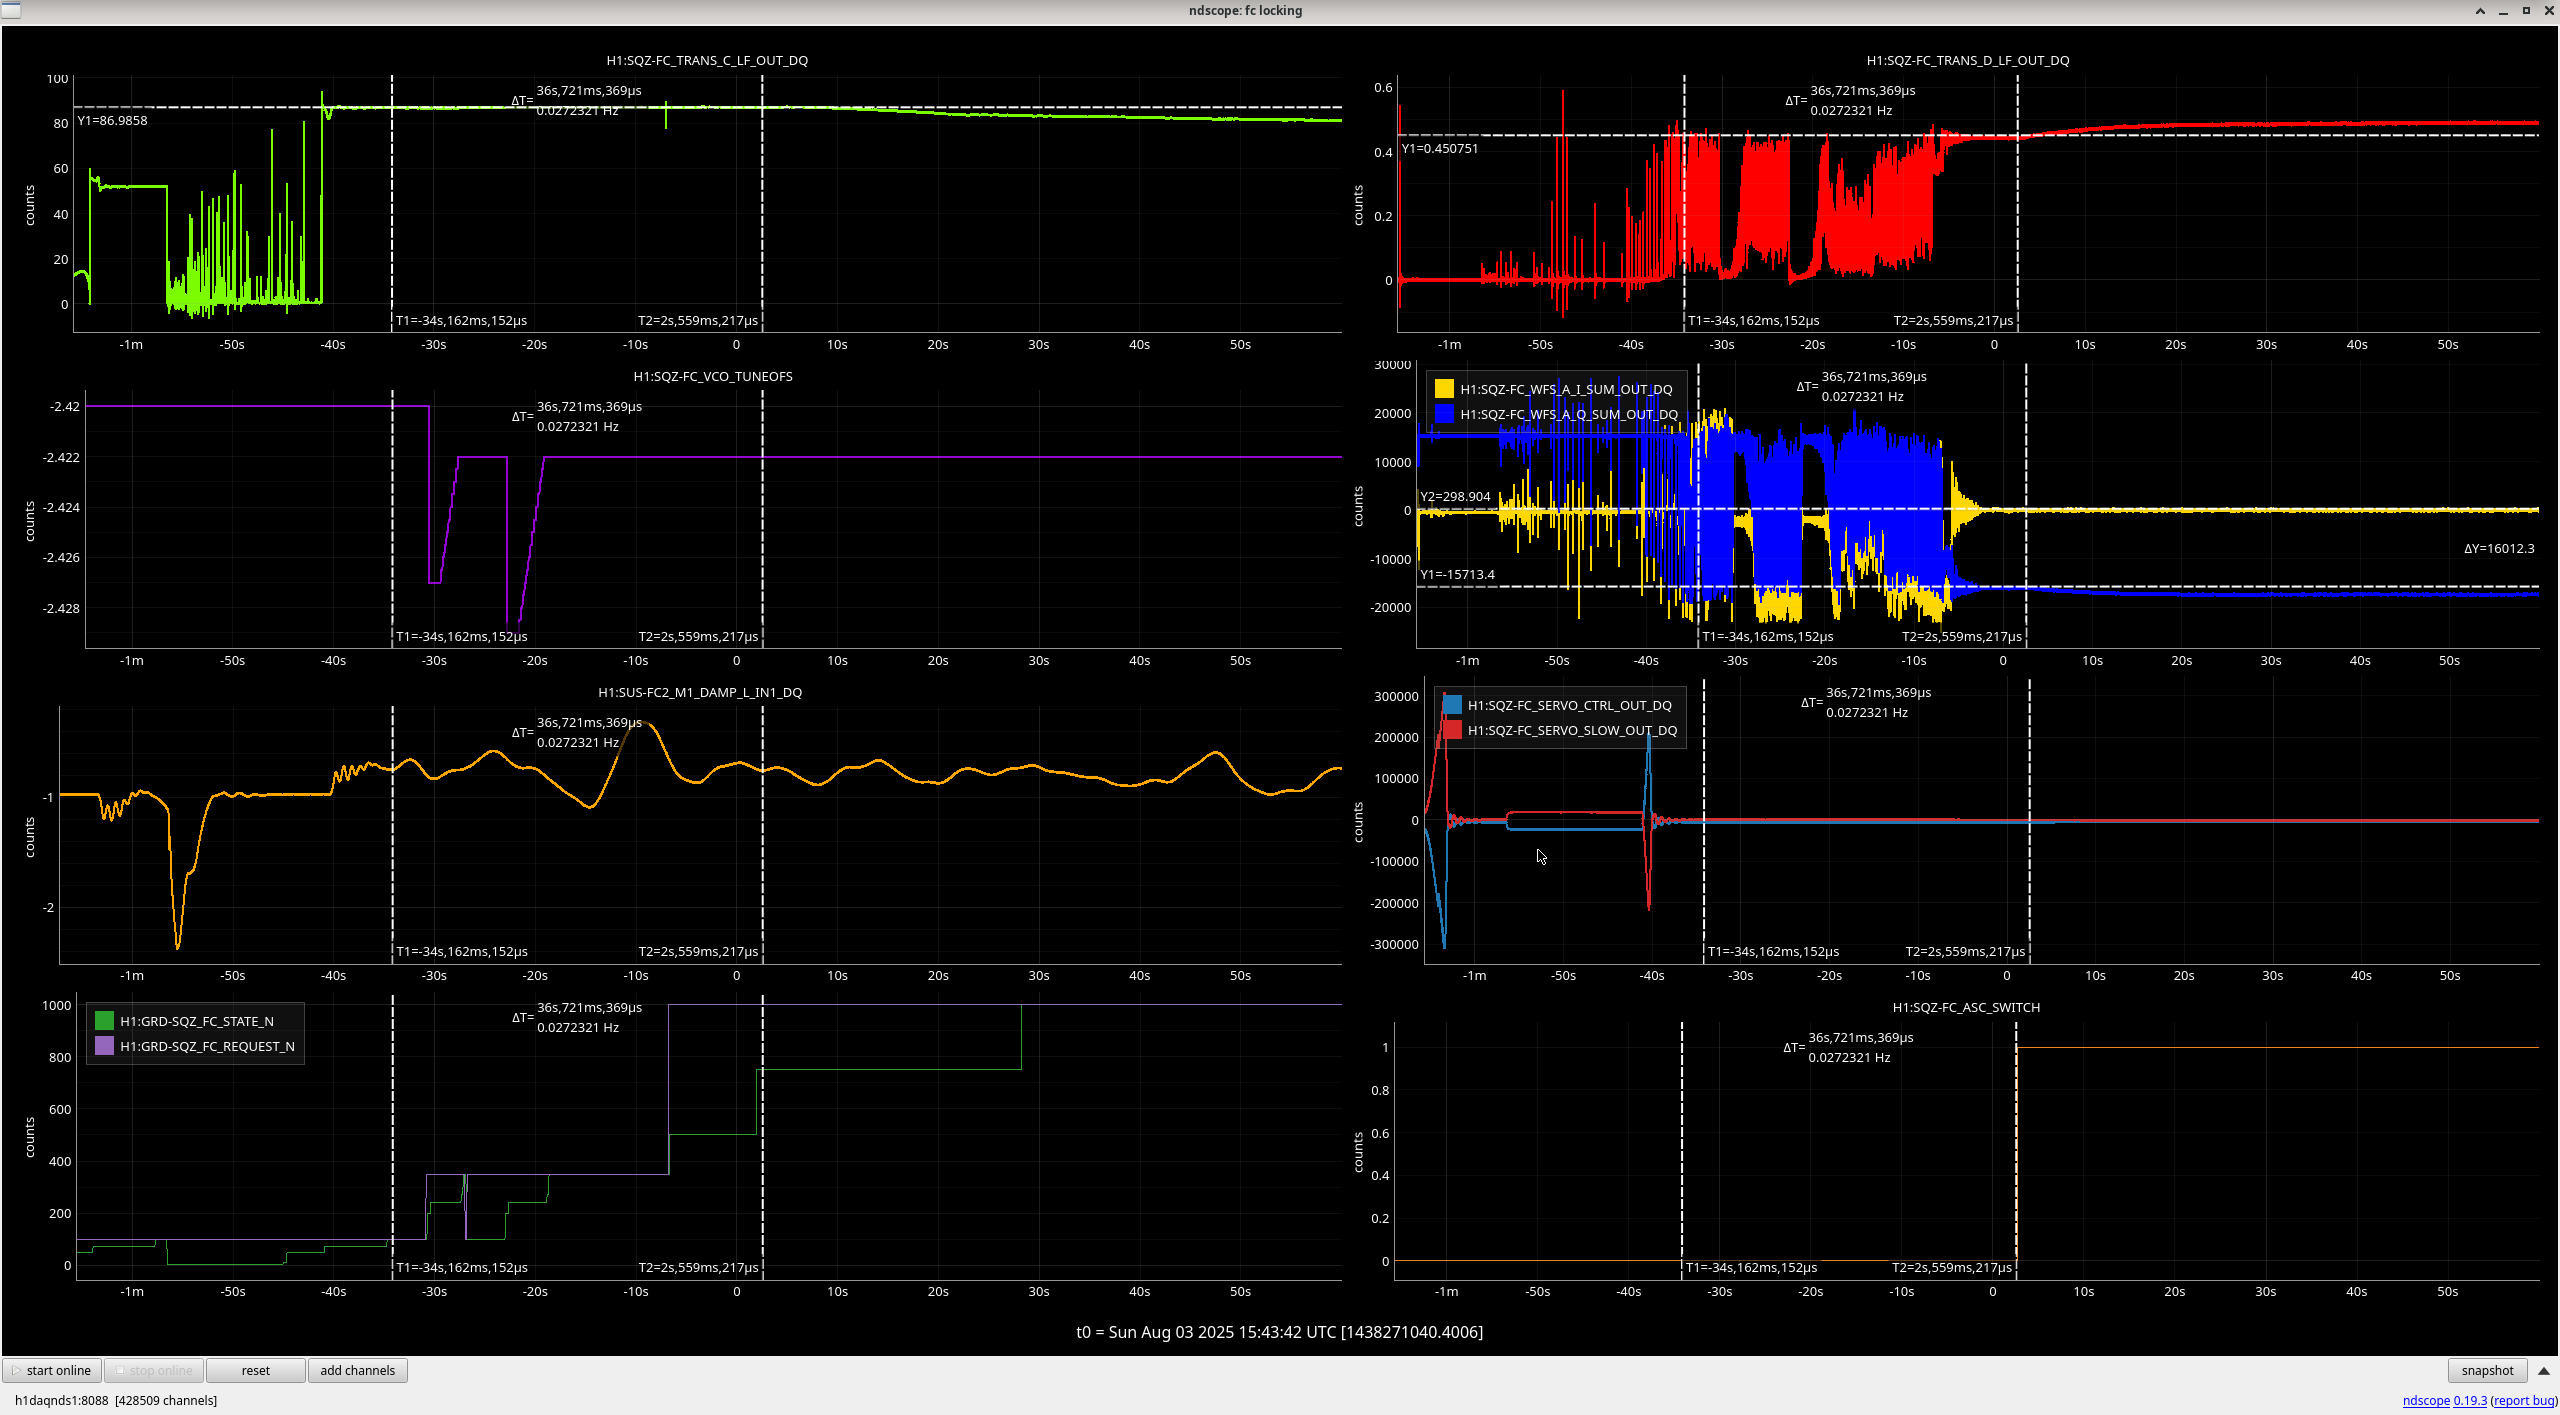
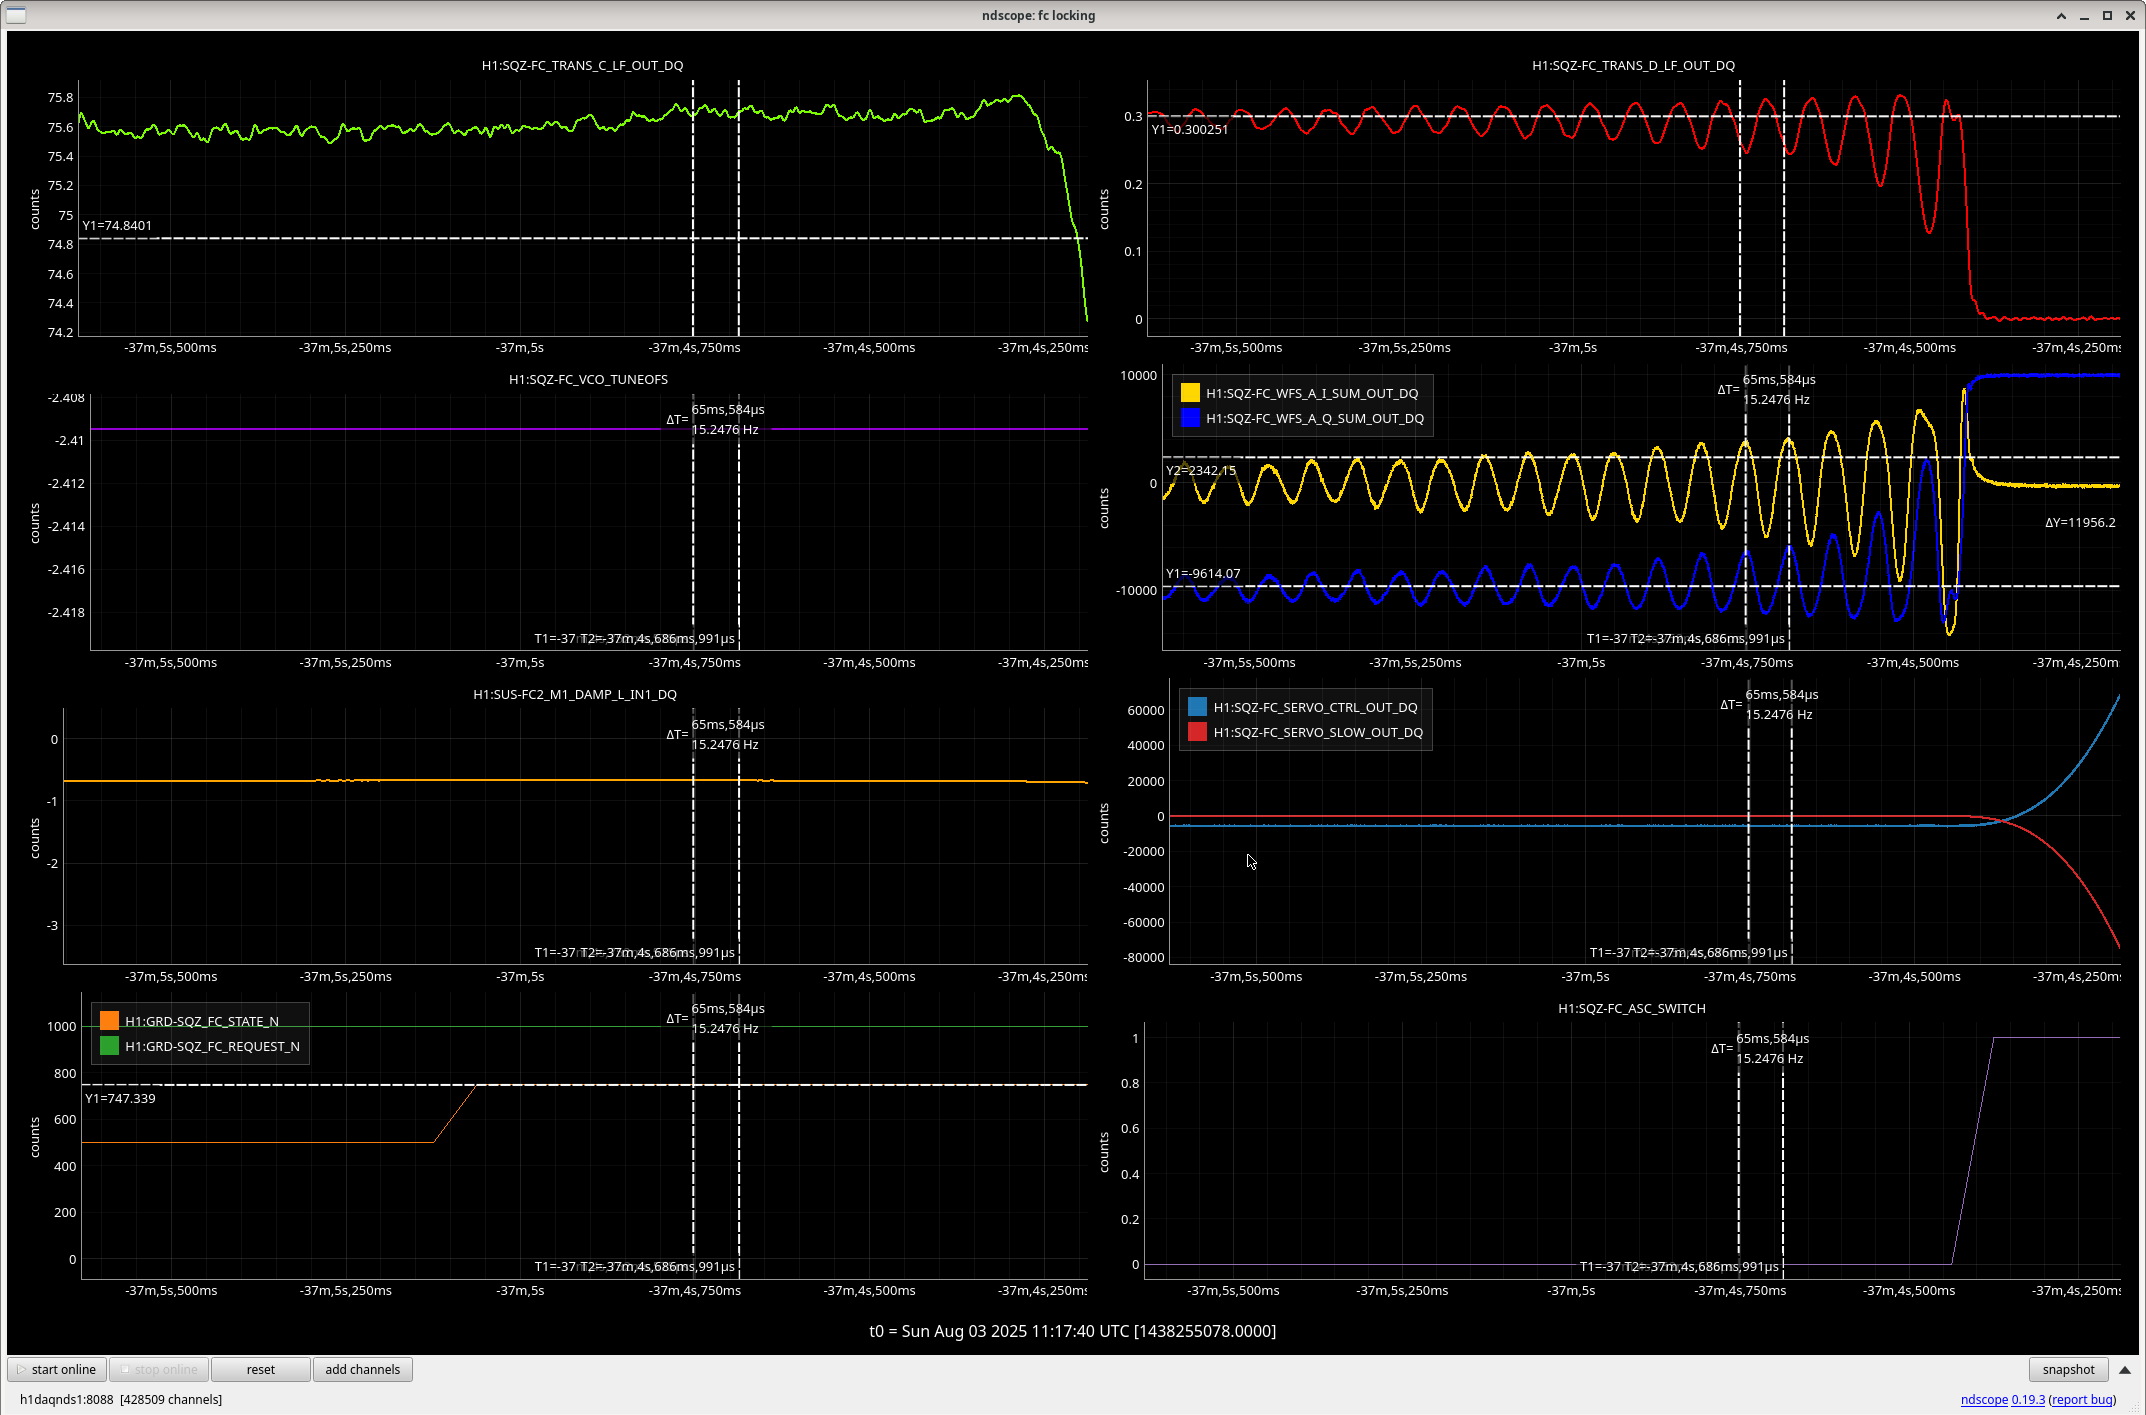
The operator team has been having a lot of issues with the SQZ FC locking recently, e.g. 86153. We hoped this was due to incorrect SEI settings 86120, but this didn't solve the issue.
The issue isn't with green locking as green locking can stay for ~minutes. It appears to be when we get to state FC_ASC_ON, although the ASC is not the issue (Oli had tried keeping it off). Comparing an unsuccessful to successful time, both the green and IR powers are lower when we are unsuccessful, as well as the FC_WFS_A_SUM Q_OUT channel, both the WFS and the IR signal get noisy with a growing ~15Hz oscillation before the lockloss plot, which happens before the ASC is turned on.
Sheila notes that this means that the FC IR LSC loop was probably unstable. We measured the crossover and could see it was very close to unstable at 15Hz, see plot. We increased the gain in at the FC LSC input matrix a factor of 1.3, H1:SQZ-FC_LSC_INMTRX_RAMPING_2_7 via sqzparams.py (fc_wfs_a_ir_gain) from -0.86 to -1.12. This brought the crossover back to the reference with 50deg of phase margin. Ideally we would compleatly redesign this loop but it was hard to design originally 66092.
To get FC to lock successfully, Sheila did had to trend and revert FC2 and ZM3 alignments. It seems that while the FC locking is struggling, the fC ASC can pull these away from nominal.
Interestingly the successful lock, as the ASC comes on, the green light decreases as the IR light increases, maybe this si a sign that green and IR aren't well co-aligned. There is picos in the green FC path, but we don't want to touch these as it's more likely that different OPO crystal voltages or spots change the alignment.
Other things that have changed over the past ~month:
Hopefully this has fixed our issues, but if this happens again, steps operators should take are (added to wiki):


Lockloss at 2025-08-01 22:02 UTC after 3 minutes in NLN. We couldn't go into Observing because of SPM differences causing SDF diffs in the guardians for ISIHAM2/3/4/5. Last time we had this, I asked Jim what to do and he said to just INIT the guardians, and it caused a glitch, but we did not lose lock, and he said INITing them should not cause glitches or locklosses (85809). Today, I did the same thing and went to INIT the guardians, but when doing it for the first one, ISIHAM2, it caused a glitch and we lost lock from it.
I don't see anything fishy going on on the guardian side of things here. When the ISI_HAM2 node had rerun the HIGH_ISOLATED state, after running through INIT, it changed a bunch of the GS13INF gains. See the end of the guardian log for the ISI_HAM2 and SEI_HAM2 nodes in the attached txt file. We then saw these changes later as well in SDF (alog84140), so the large earthquake script button might be conflicting with this.
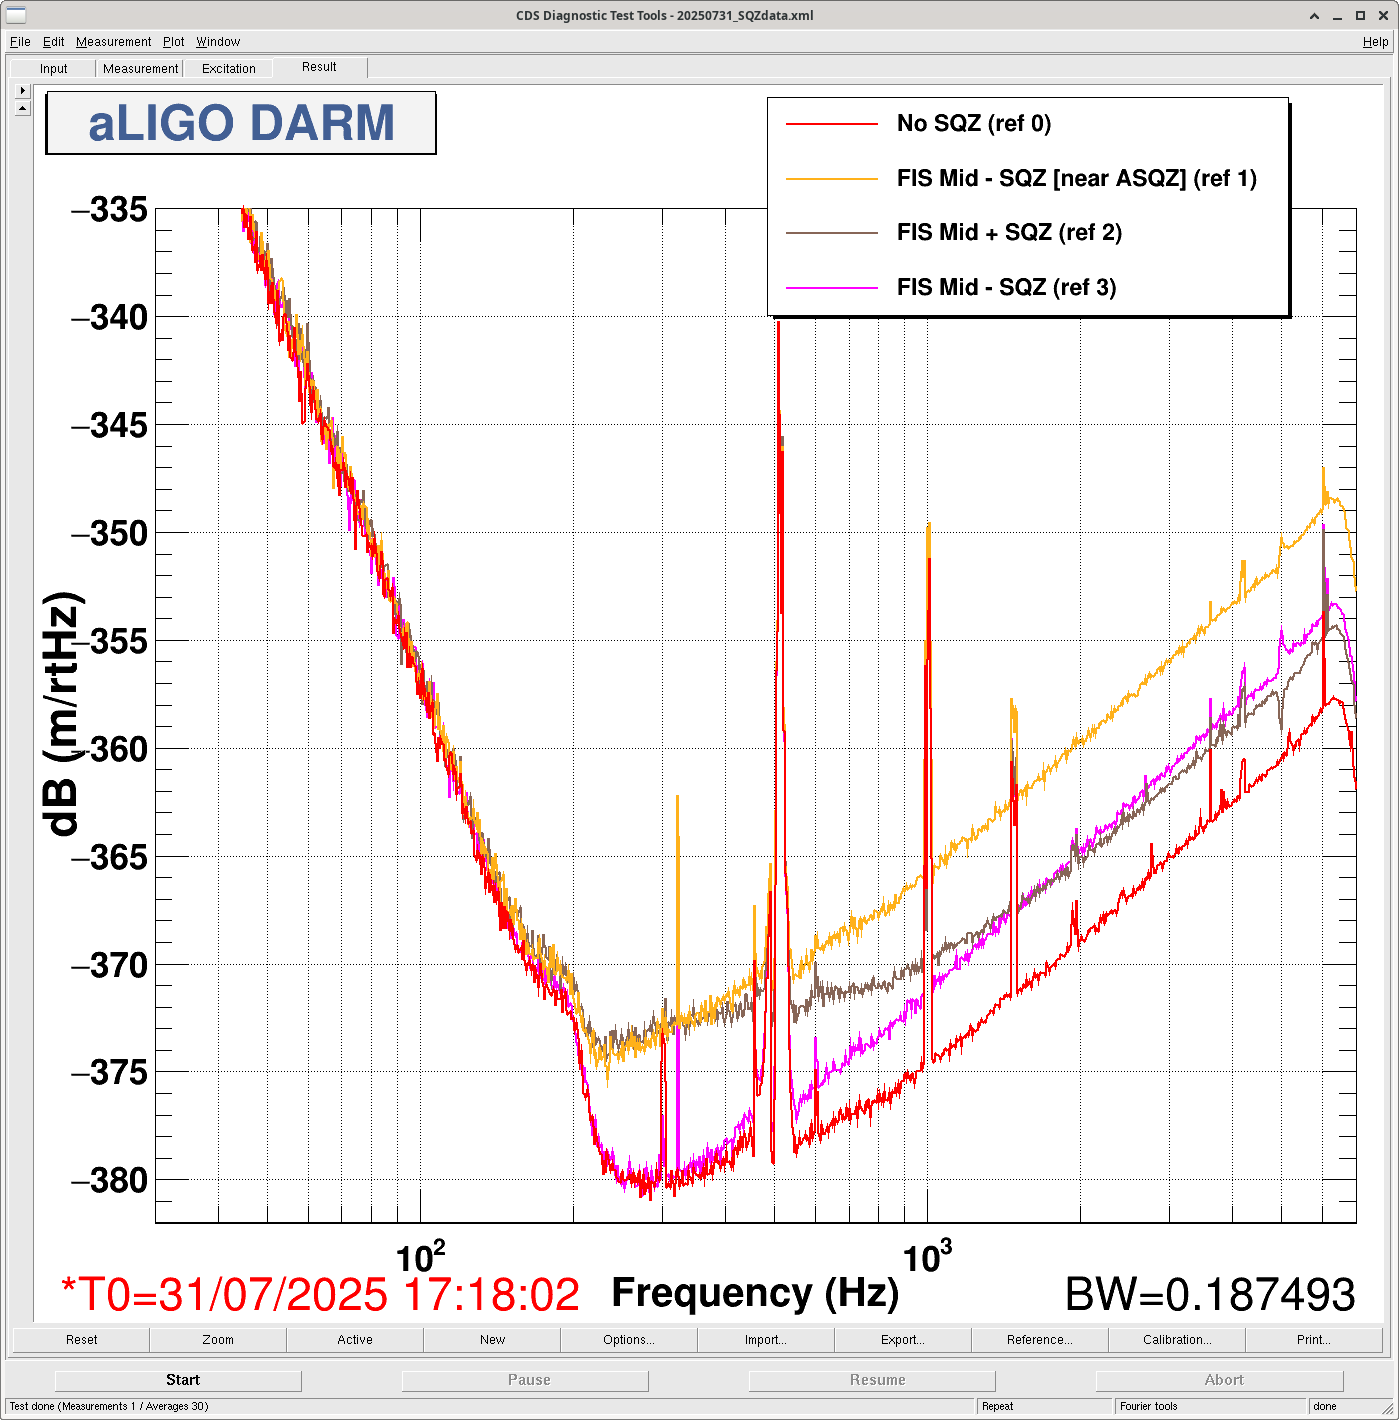
/ligo/home/camilla.compton/Documents/sqz/templates/dtt/20250731_SQZdata.xml screenshot attached and /ligo/home/sheila.dwyer/Noise_Budget_repos/quantumnoisebudgeting/data_files/higher_order_modes_sqzdataset2W.xml screenshot attached.| Type | Time (UTC) | Angle | DTT Ref in SQZ | DTT ref in HOM | Notes |
| No SQZ | 15:20:00 -15:25:00 | N/A | ref 0 | ref 0,1 | |
| FDS Mid - SQZ | 15:31:00 - 15:34:00 | (-)120 | ref 1 | ref 2,3 | Was close to ASQZ so retook below |
| FDS Mid + SQZ | 15:36:00 - 15:39:00 | (-) 30 | ref 2 | ref 4,5 | |
| FDS Mid - SQZ | 15:40:00 - 15:43:00 | (-)150 | ref 3 | ref 6,7 |
| OPO Setpoint | Amplified Max | Amplified Min | UnAmp | Dark | NLG | Note |
| 80 | 0.0533596 | 0.00250 | 0.007039 | -1.93e-5 | 7.6 | Temp already optimized |
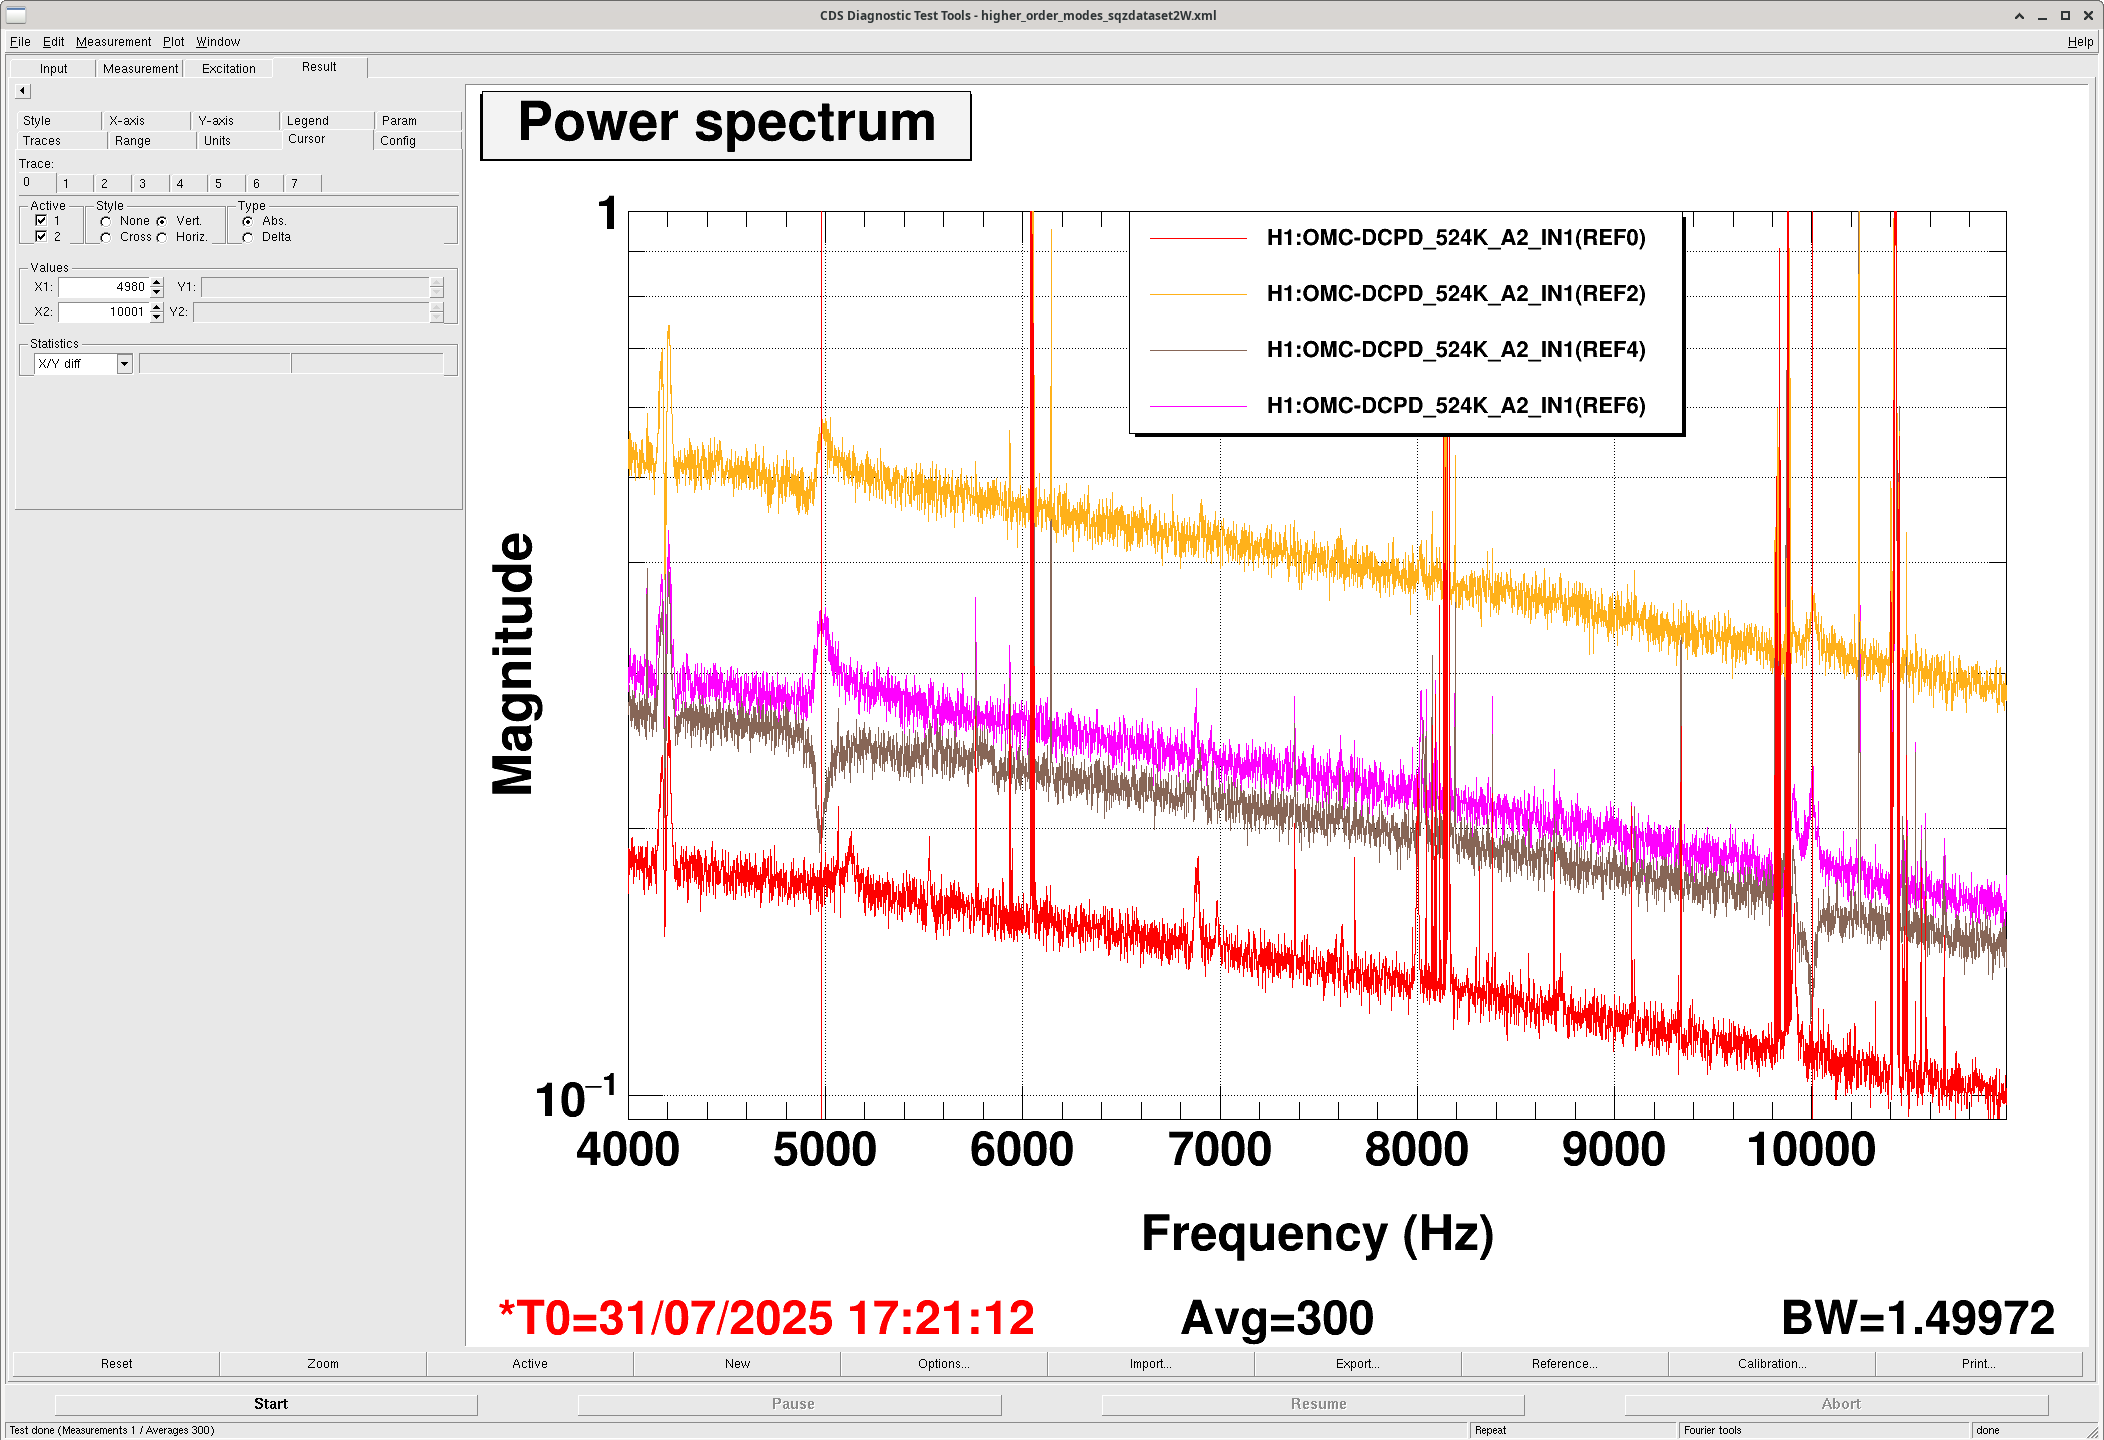
In this data I only see evidence of one mode at 5kHz, and one mode at 10kHz. If the astigmatism that caused the X arm second order modes to separate into two in 86107 is due to the point absorbers or some other laser heating, it could make sense that we don't see astigmatism at 2W. However, the ring heater settings for the two arms are different, so I would have expected the X and Y arm HOMs to be separated even at 2W. This data was taken with 0.44W on ITMX RH (per segment), 1W per segment on ETMX RH, 0W on ITMY RH, and 1.5W per segment on ETMY RH.
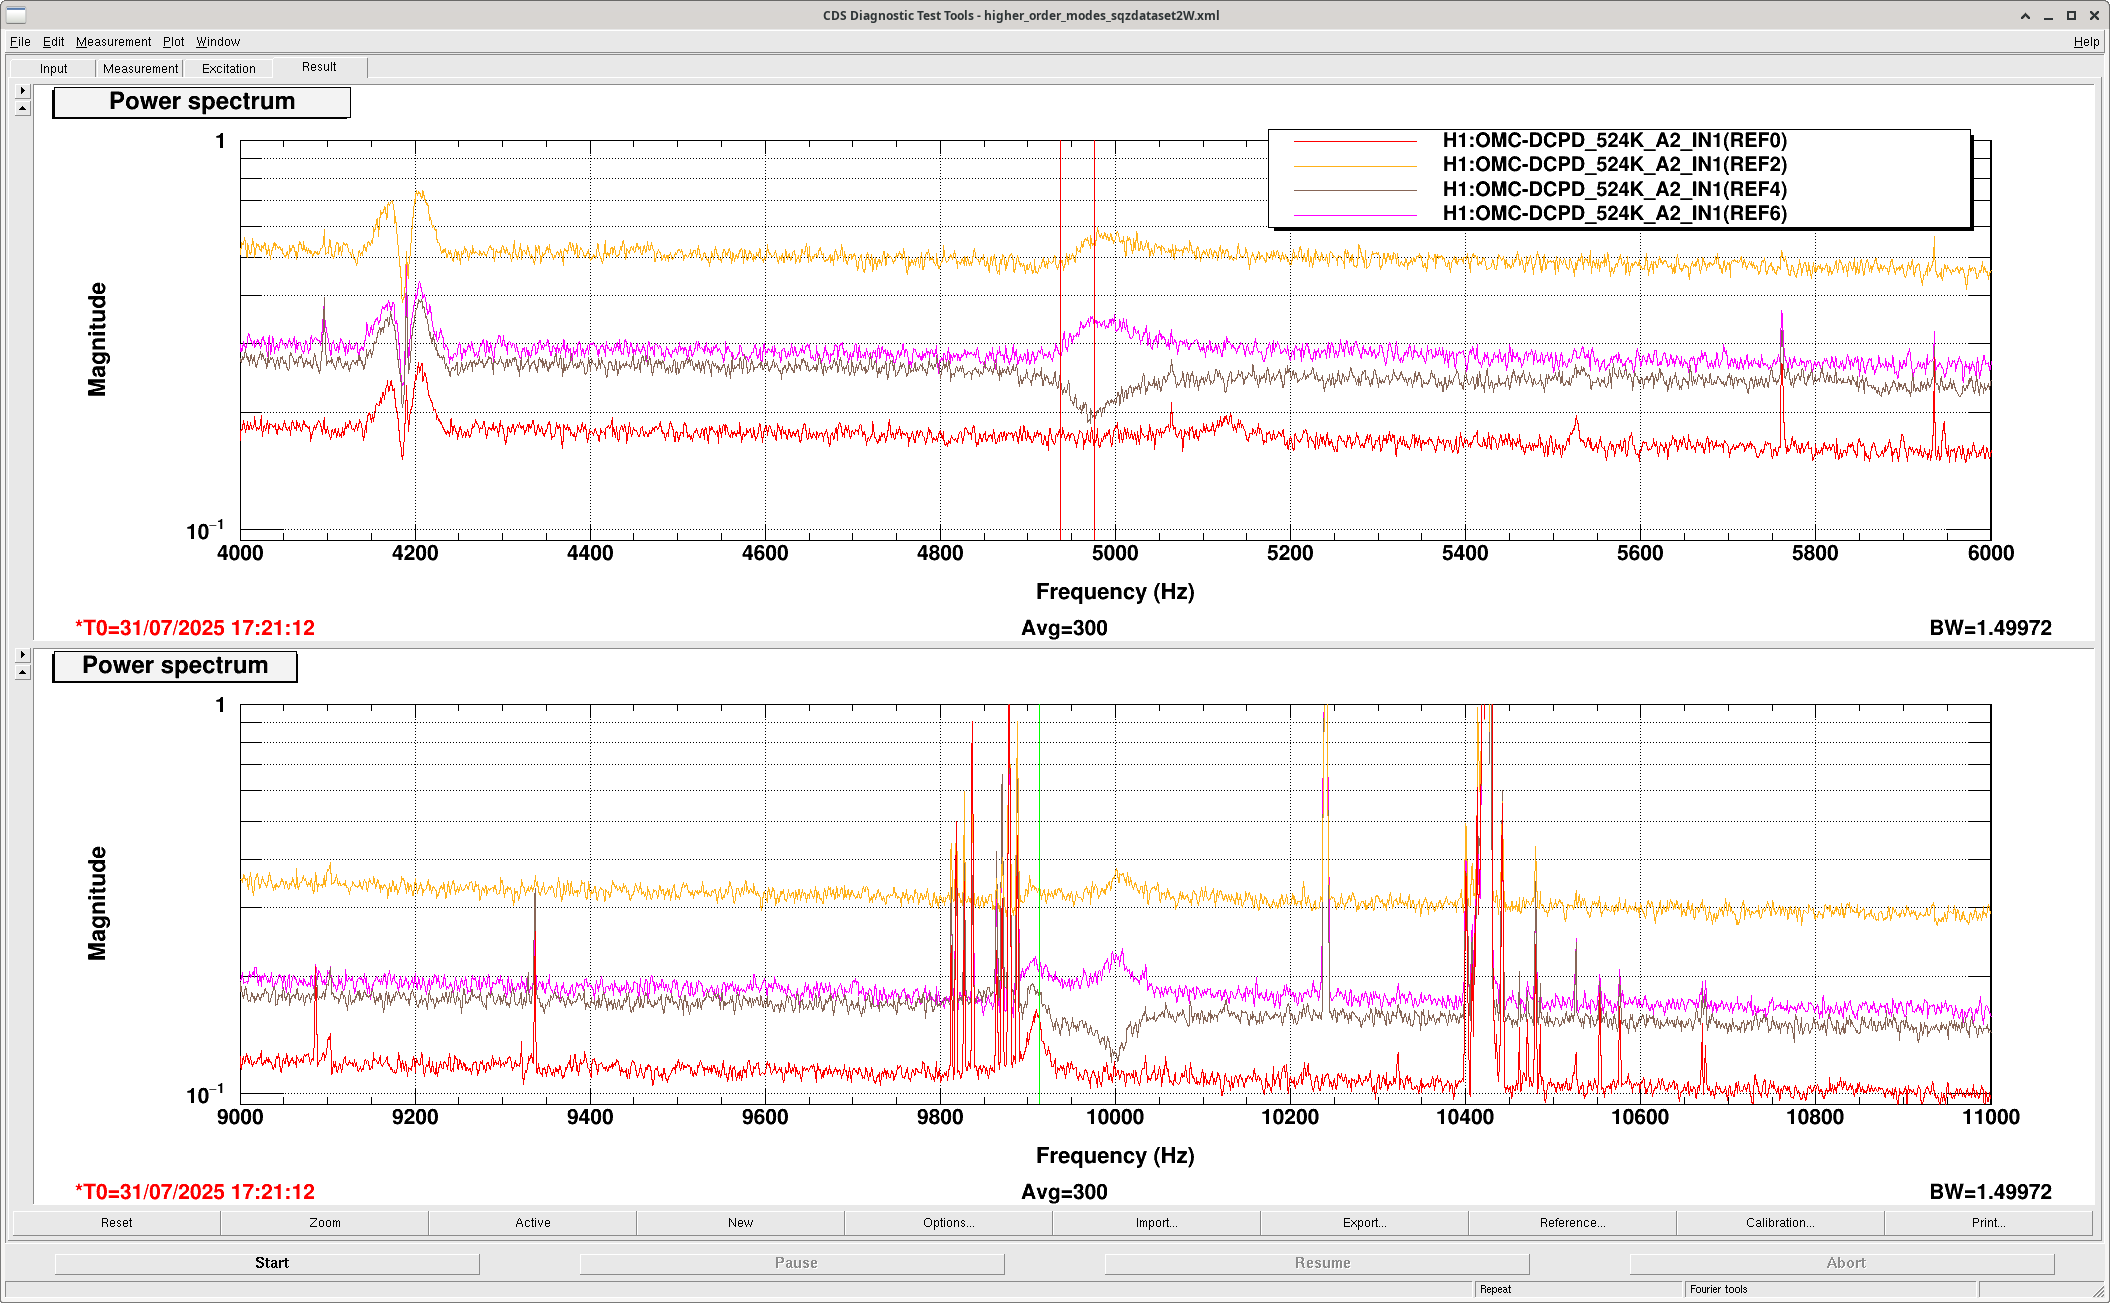
Using a cursor to find the edges of the rotation from the three mid sqz traces that Camilla tok, the 5kHz mode frequency is 4956.5+/- 20 Hz, and the 10kHz mode is at 9981.5 +/- 19.5 Hz. This suggests that the second order mode is at 99% of 2* first order mode frequency, similar to the ratio that we saw at full power. 86107. In the attached screenshot, the top panel shows where I put the cursor to measure the location of the 5kHz mode, the lime veritcal line in the bottom plots shows twice that frequency, 9913 Hz, which is clearly below the sqz rotation caused by the HOMs.
The hour times in my data table are all incorrect, should be starting at 17:20UTC.
When we started the data taking with NO_SQZ at 15:20UTC, the IFO had been down and the CO2 lasers off for 2hours 5mins.
At Matt's request I revisited this data.
We didn't plan on doing subtraction on this data at the time we took it, so we didn't save the high rate individual PD time series to do the cross correlation. Instead, I made a rough shot noise model (a line in a semilog plot), subtracted that in quadrature from the no squeezing data to estimate the non quantum noise and subtract that from the squeezing measurements.
Above I wrote that there is only one mode at 5kHz, and one at 10kHz, but after doing the rudimentary subtraction this data does seem to suggest that there are two modes at 10kHz, which we would expect since the ring heater settings are different for the two arms. The rotation that is partially hidden by quantum noise and is around 9875-9900 Hz, and seems to rotate in the opposite direction from the more visible one at 10kHz. (This is different from what was seen at full power in 86107 and in the similar ADF measurements in Kevin's comment).
The code used to make these plots is based on 86107 and is available here.
Note: The pink trace in this plot is labeled anti-squeeze, but it is not, it is actually a mid squeezing angle that is somewhat close to anti-squeezing.
The site has been abuzz as of late. For the past few months, western honeybees have turned LIGO from interferometer to apiary. The first swarm, near the LSB lift station was reported in early May. Since then, Facilities group and others have been combing the site, and some 15 colonies have been captured and extracted with the help of Phillip Johnson from The Bee Team (seen in buzzworthy photos below).

The bees have been largely indiscriminate about hive habitat selection. To date we have removed them from spools, BTE interiors, irrigation boxes and connexes. It's not clear where the bees came from, or how they got here. The nearest location to site that I could find which would utilize bees, Brainstorm Cellars, is some 6 miles away. This is further than a swarm will migrate. Stranger yet, the habitat between us and the nearest possible location is, to my understanding, not favorable for hive building which would rule out leap frogging to us. Nevertheless, the bees are here and thriving. The queens are prolific egg layers; the forager bees are caked in pollen and the extractions of more established colonies are chalked full with 10's of pounds of delicious, capped honey. Bee temperament is, across the board, very mild. Even during our most invasive extractions they seem largely unbothered.

All that to say, I hope to see the increase of bees across site taper off strongly, especially as we inch closer to Fall. In the meantime, M. Landry has recently reached out to the WSU Honeybees and Pollinators Program to help us understand how we came to find this abnormal explosion of bees. That meeting has yet to take place.


C. Soike, M. Robinson, T. Guidry


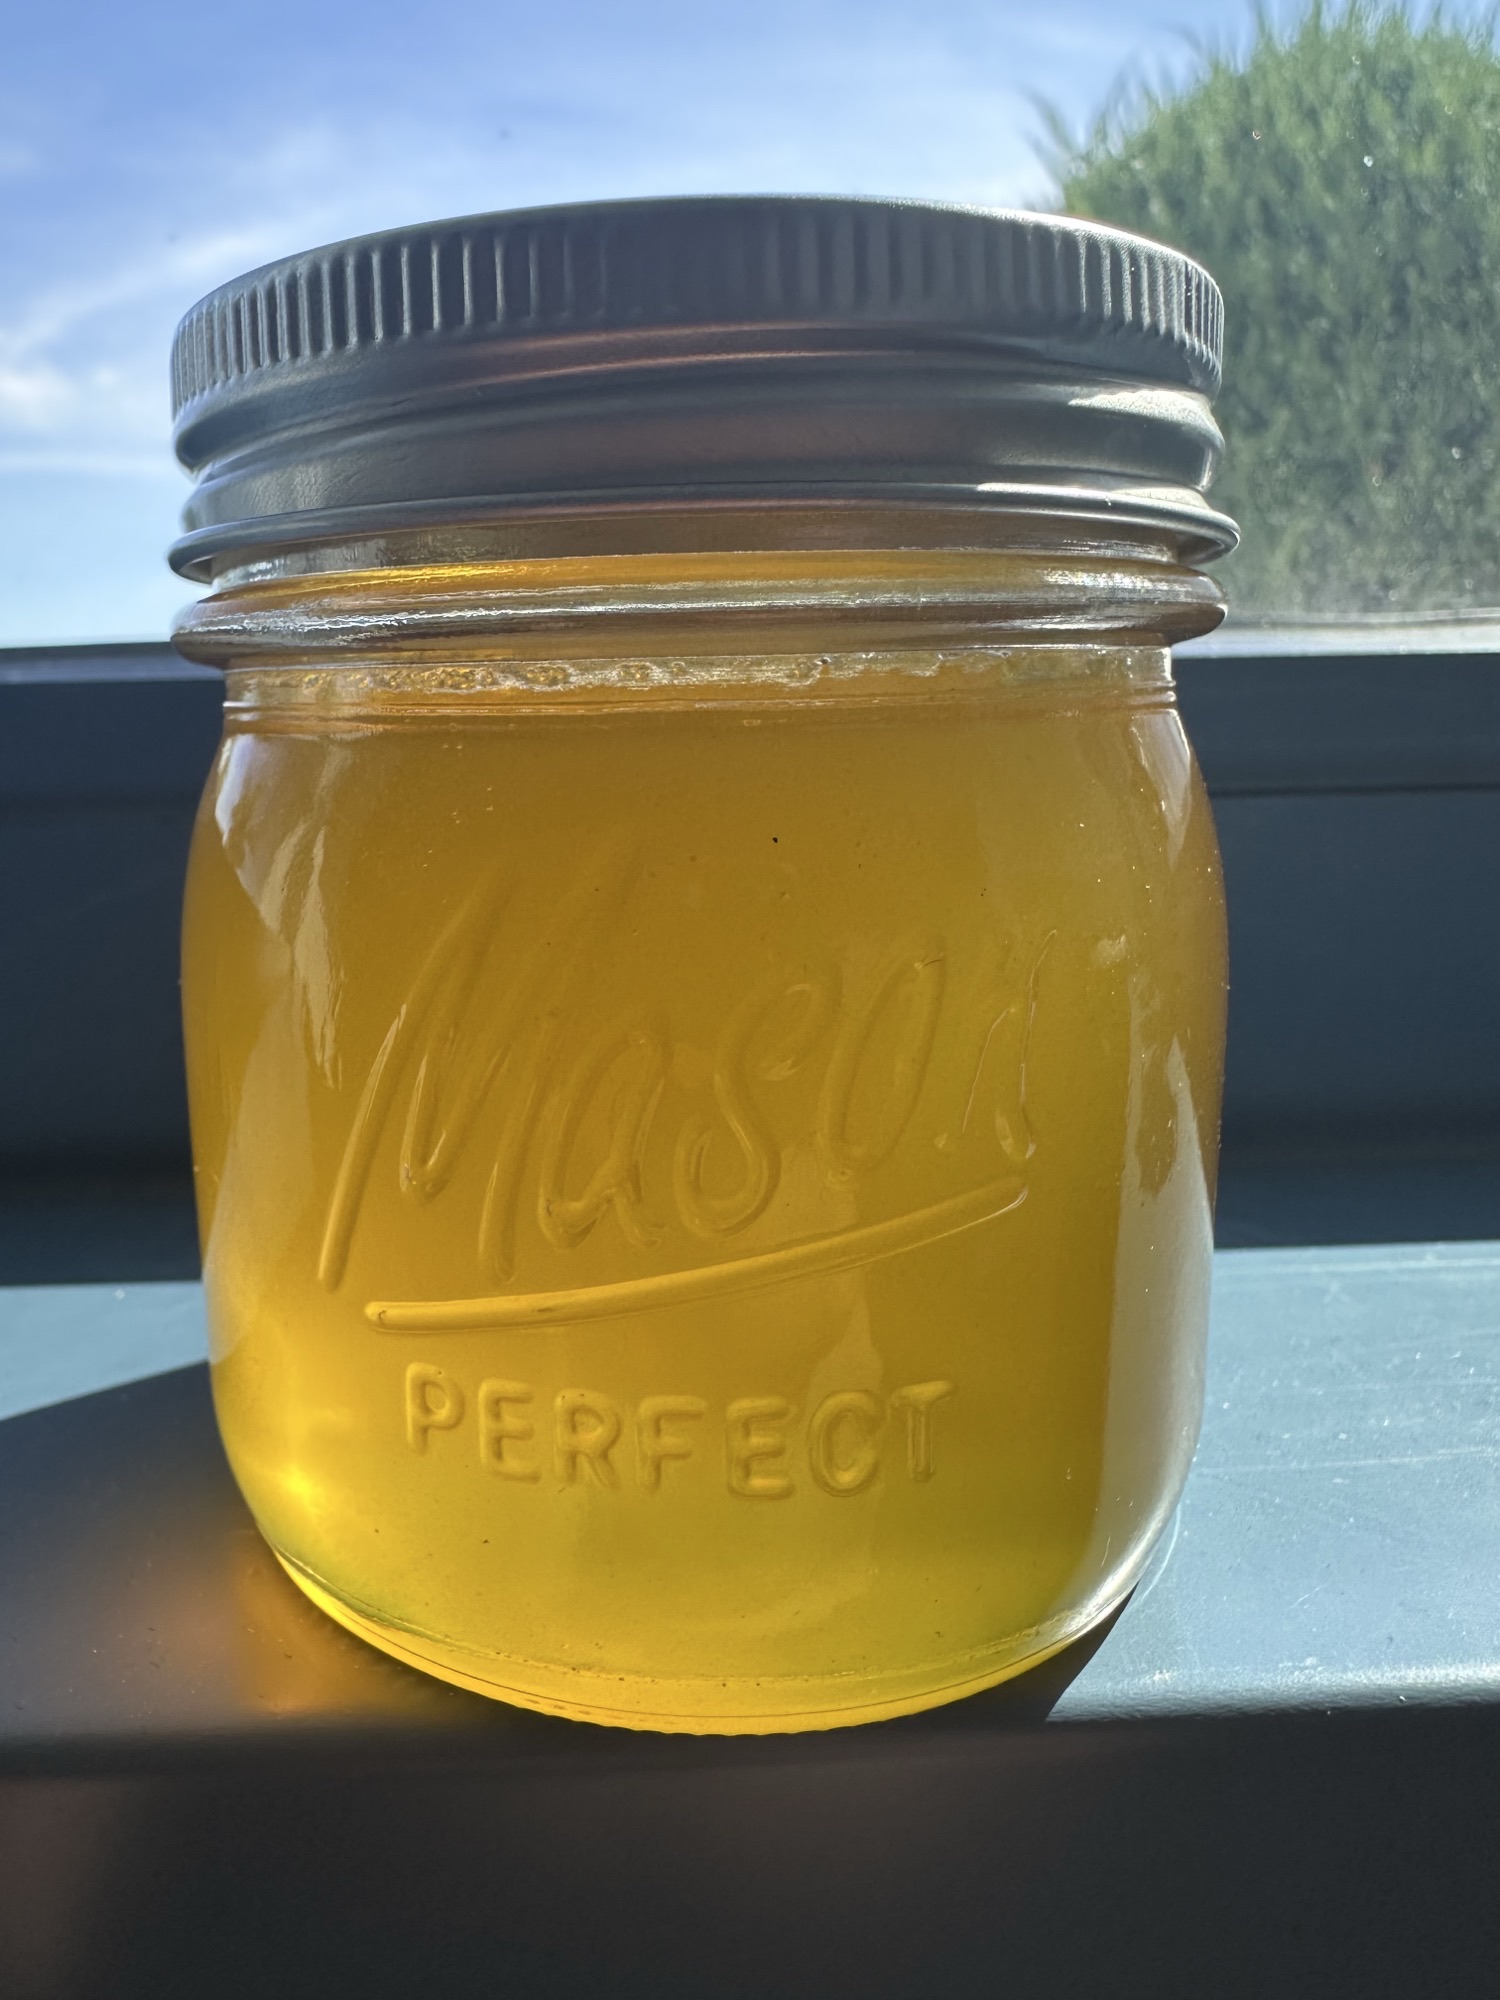

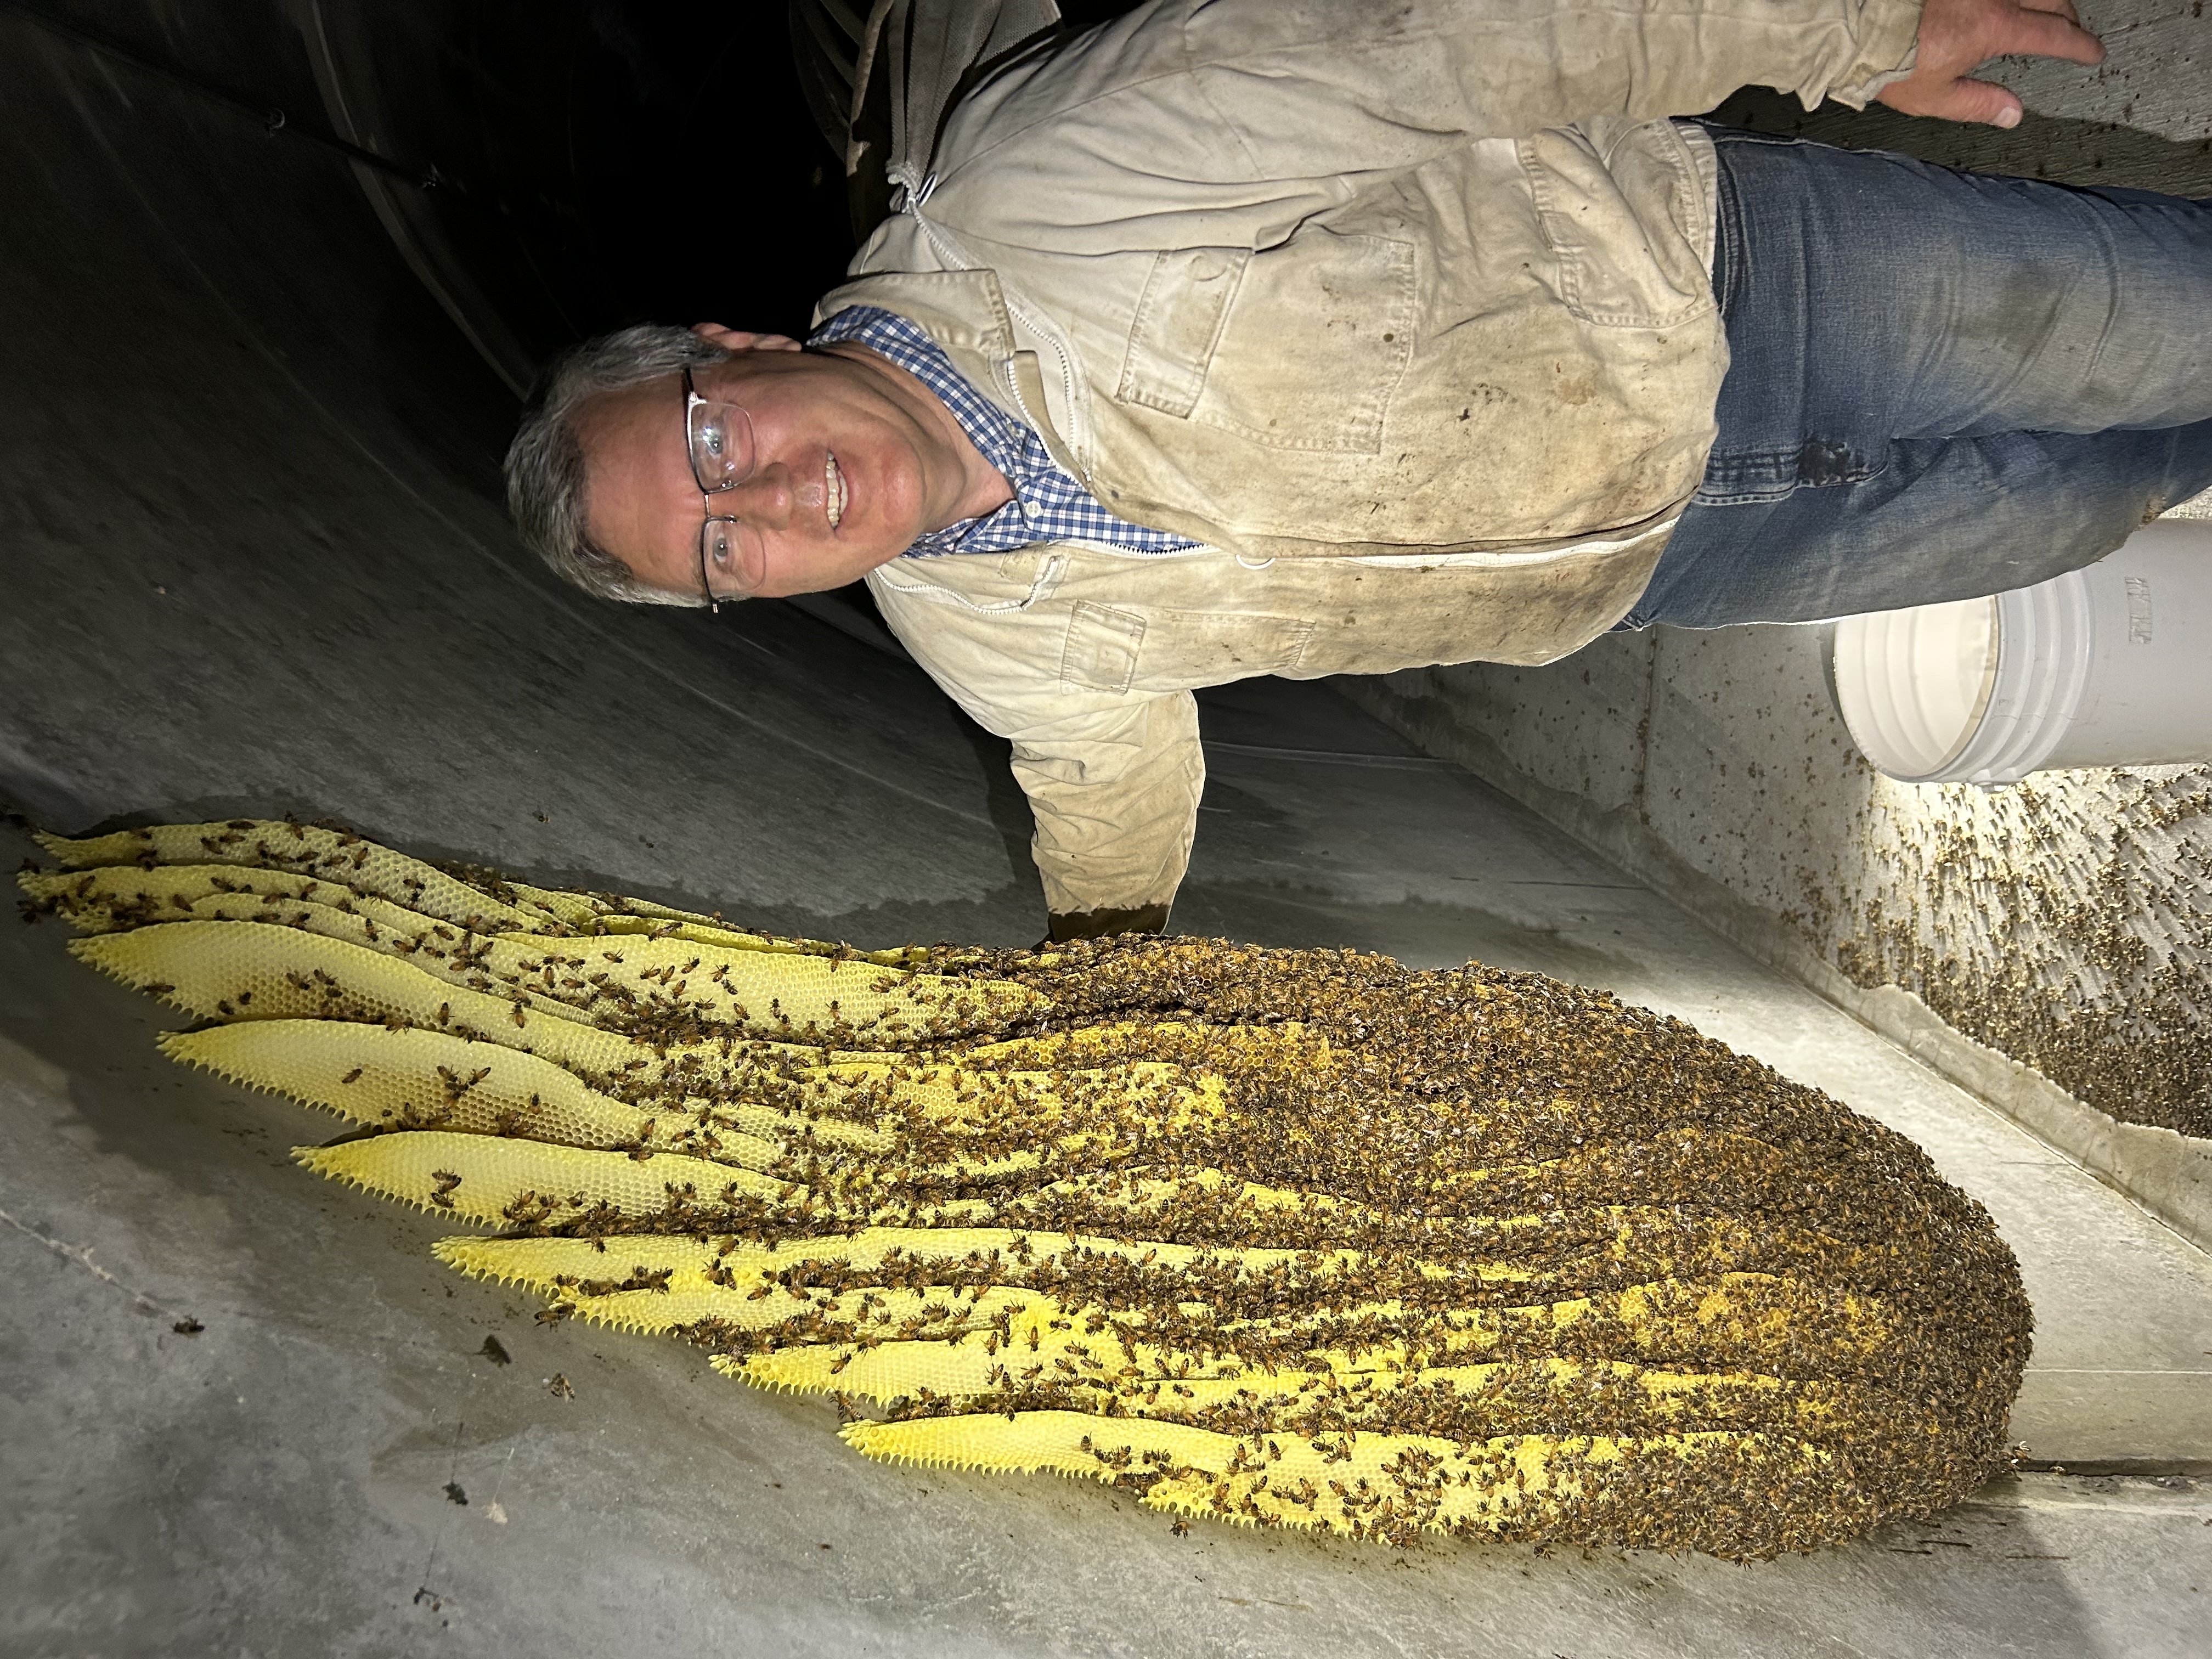

This work demands we the dust off the ol' LHO Paper Plate Award!!

"This buzz-worthy award goes to Tyler Guidry, Phillip Johnson, Mitch Robison, Chris Soike, and Kim Stewart for LHO's Un-bee-lievble Summer (LHO aLOG 86102)."

Congratulations!

SEI_CONF transition to EQ.
Transitioned back to WINDY around 21:00. Forgot to log the exact time since Hugh just fixed the SDF issue so we no longer drop out of Observe and I don't have a Verbal timestamp.
The SDF issue dropping us out of observing was the ETMX ISI Stage1 X Y Z CPS T240 & L4C BLND NXT filters. ETMY/ITMY & ITMX all had these filter banks Not Monitored. These ETMX channels were switched to Not Monitored.
For longer term study, I've opened FRS Ticket 13123.
Travis's 4-word aLOG claimed the 50000th aLOG and thus we honored this amazing achievement with the attached LHO Paper Plate Award!

"This award goes to Travis Sadecki for his 5 words in the 50,000th aLOG (LHO aLOG 50000)."

A truly astounding achievement.
Who will claim the 100000th aLOG???

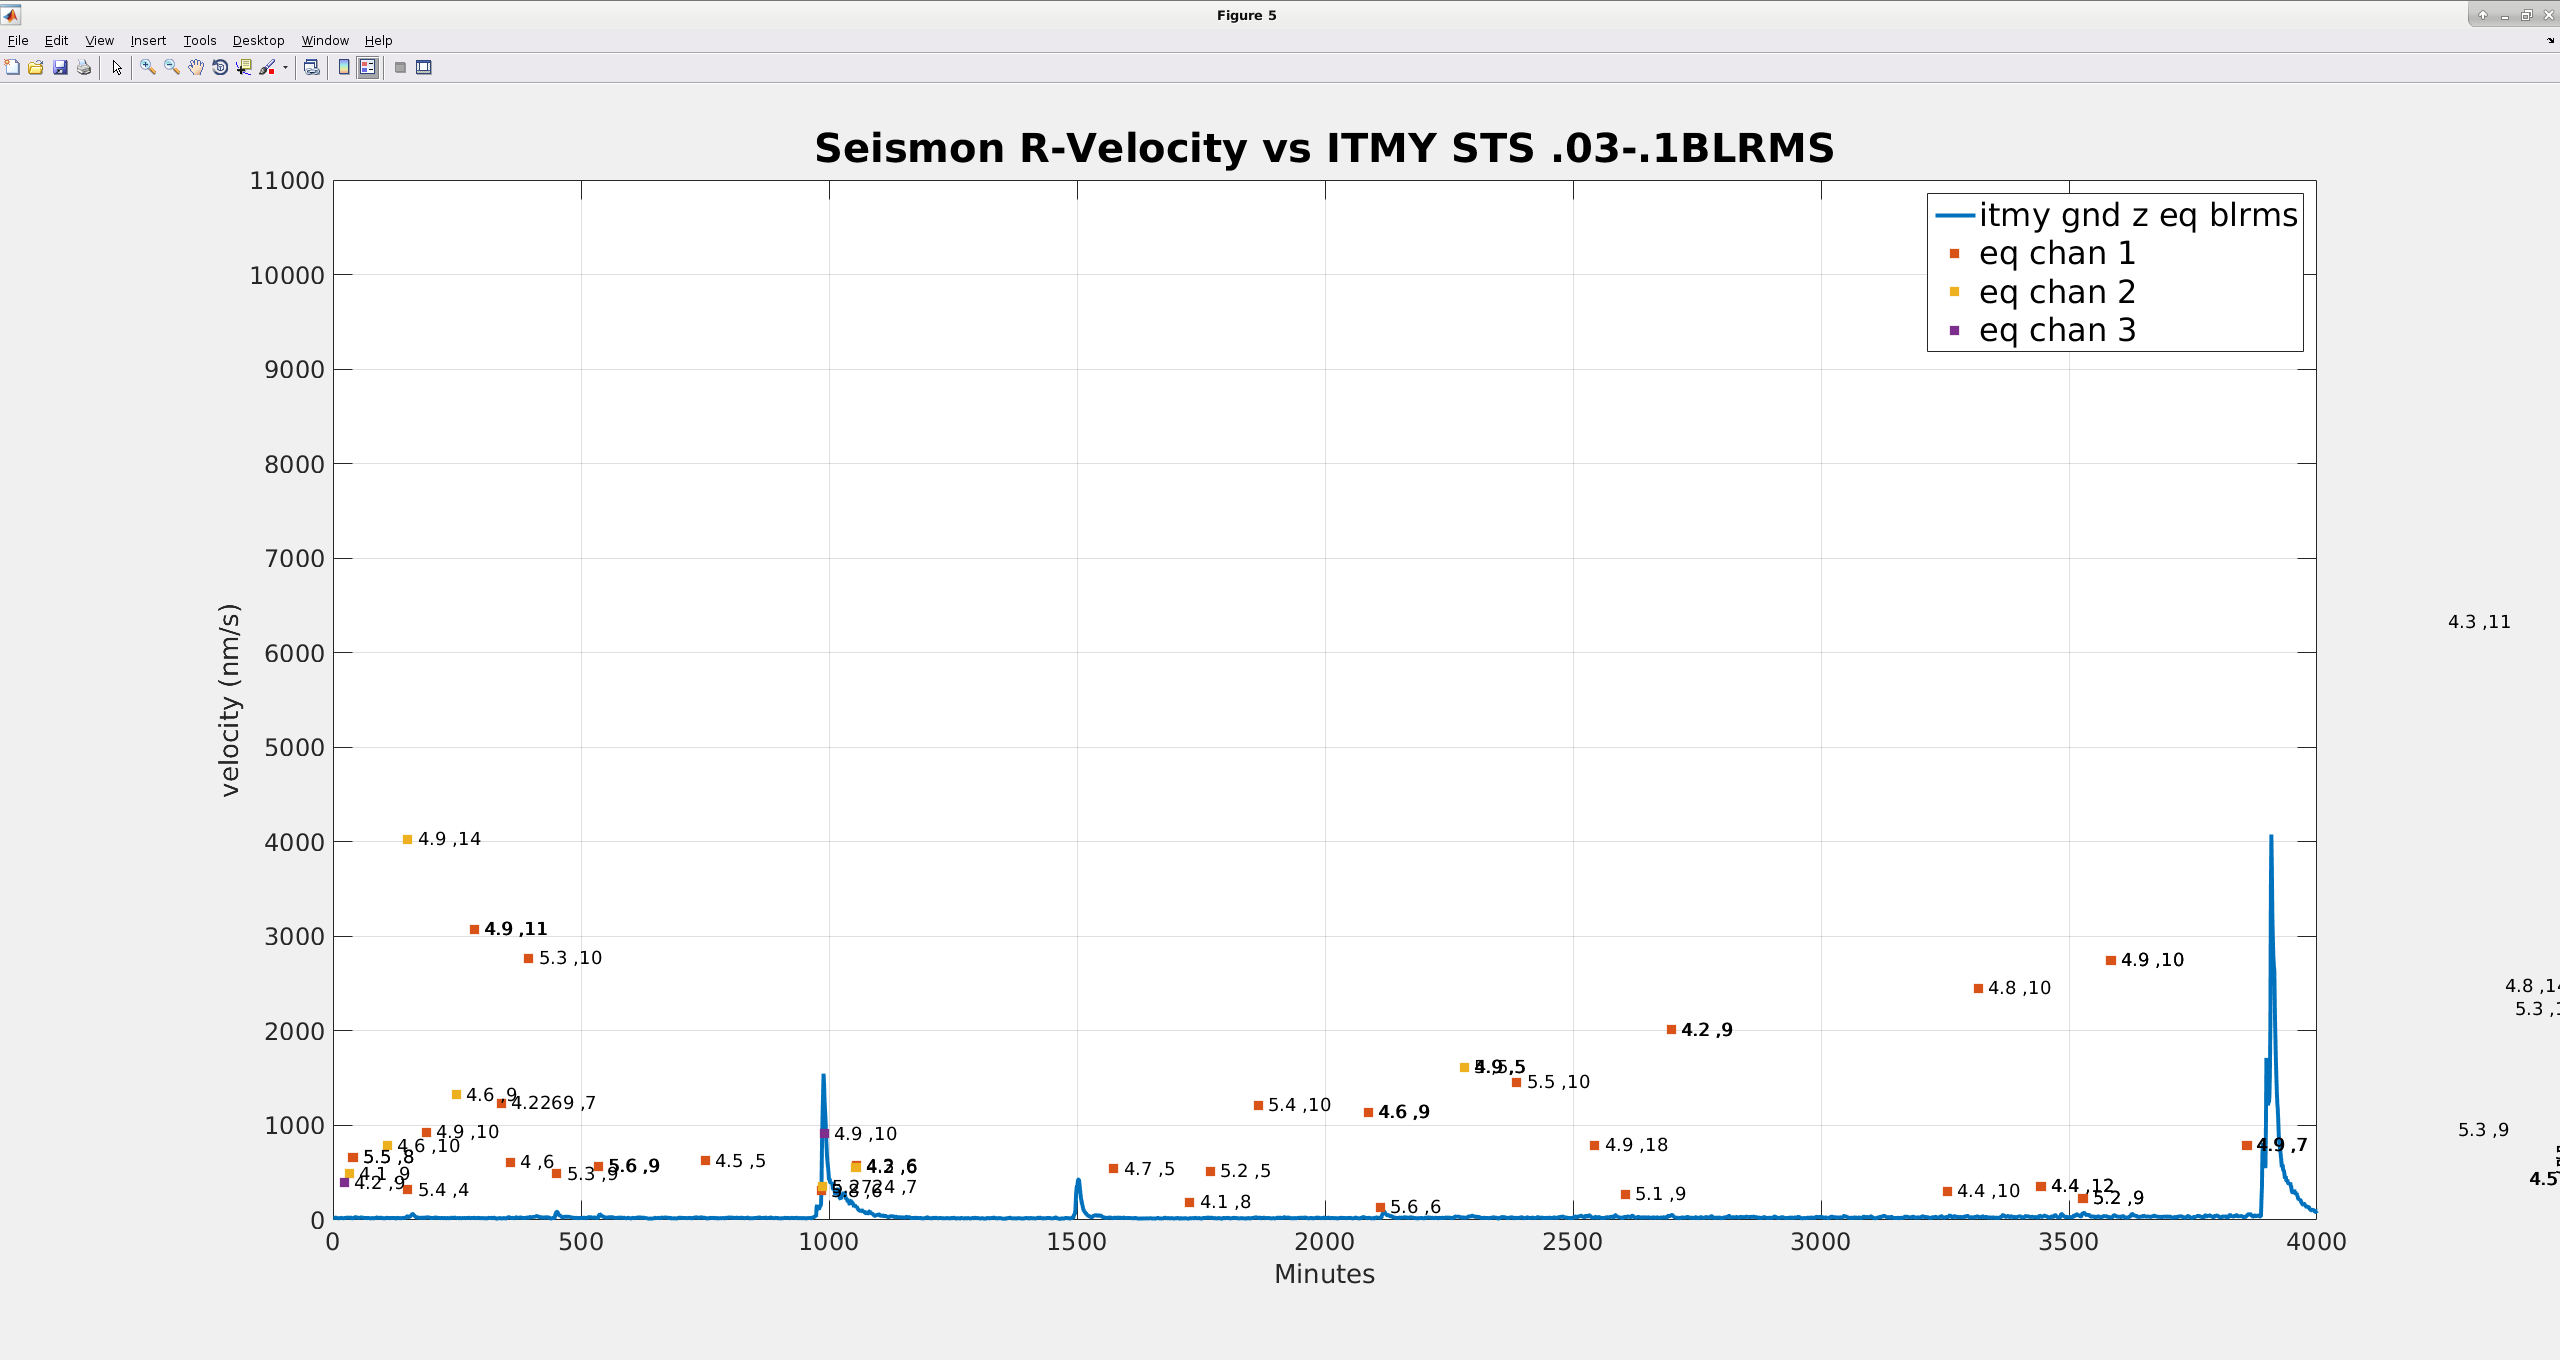
I actually started this a long time ago, but got swamped with other work and buried by snow. Our seismon code does not seem to give an accurate prediction of ground velocities. Attached plot compares the timeseries .03-.1hz rms ground velocity measured by the ITMY STS in Z (solid blue line) and the seismon predicted ground velocities for 5000 minutes of data from this month. Each dot represents the predicted velocity and arrival time for each earthquake seismon found over this time period (seismon can give up to five active predictions, eq chan 1,2 & 3 are the first 3 predictions, typically the "live" ones if seismon has given us early warning). The numbers by each prediction point are the magnitude and distance in 1000km of the earthquake (so 5.8, 10 is a 5.8 magnitude earthquake 10,000 km away). The earthquake at 4000 minutes actually has a arrival time prediction , but the predicted velocity is up around 60 micron/s, which made the rest of the plot hard to see, so I cut it off.
I would expect that if seismon was accurately predicting ground velocities, the dots would follow the blue line in some way. If there is a systematic relationship between the dots and the line, I don't see it.
The good new is that for other time periods when there were large earthquakes, seismon usually gave us early warning, which is the primary goal. But it would help deciding what the response to a notification should be if we could get a believable prediction of the velocities.
This aLOG has earned the inaugural LHO Paper Plate Award.

"This award goes to Jim Warner for Most "meta" aLOG in 2019 (LHO aLOG 47200)."

The award has been endorsed by our operations manager, in the presence of Jim and a witness -- our site safety officer.
Jim has received the award in person, smiled, and sends his "thank you"s.


References on what a "Paper Plate Award" is for those who've not heard of it:
- The best definition (but by example) I could find
- Some other examples of how they're used in practice.
- A story of the award's power from  SportsEngine
- An anecdote from the .

For posterity -- the LHO Paper Plate Award was given for the first iteration of this aLOG that was posted -- it had only contained a title and an attached screenshot of the aLOG draft. Jim was aware of the issue within the 24 hour "set in stone" editing time limit, so he's since updated the aLOG to have its originally intended content and completeness.

