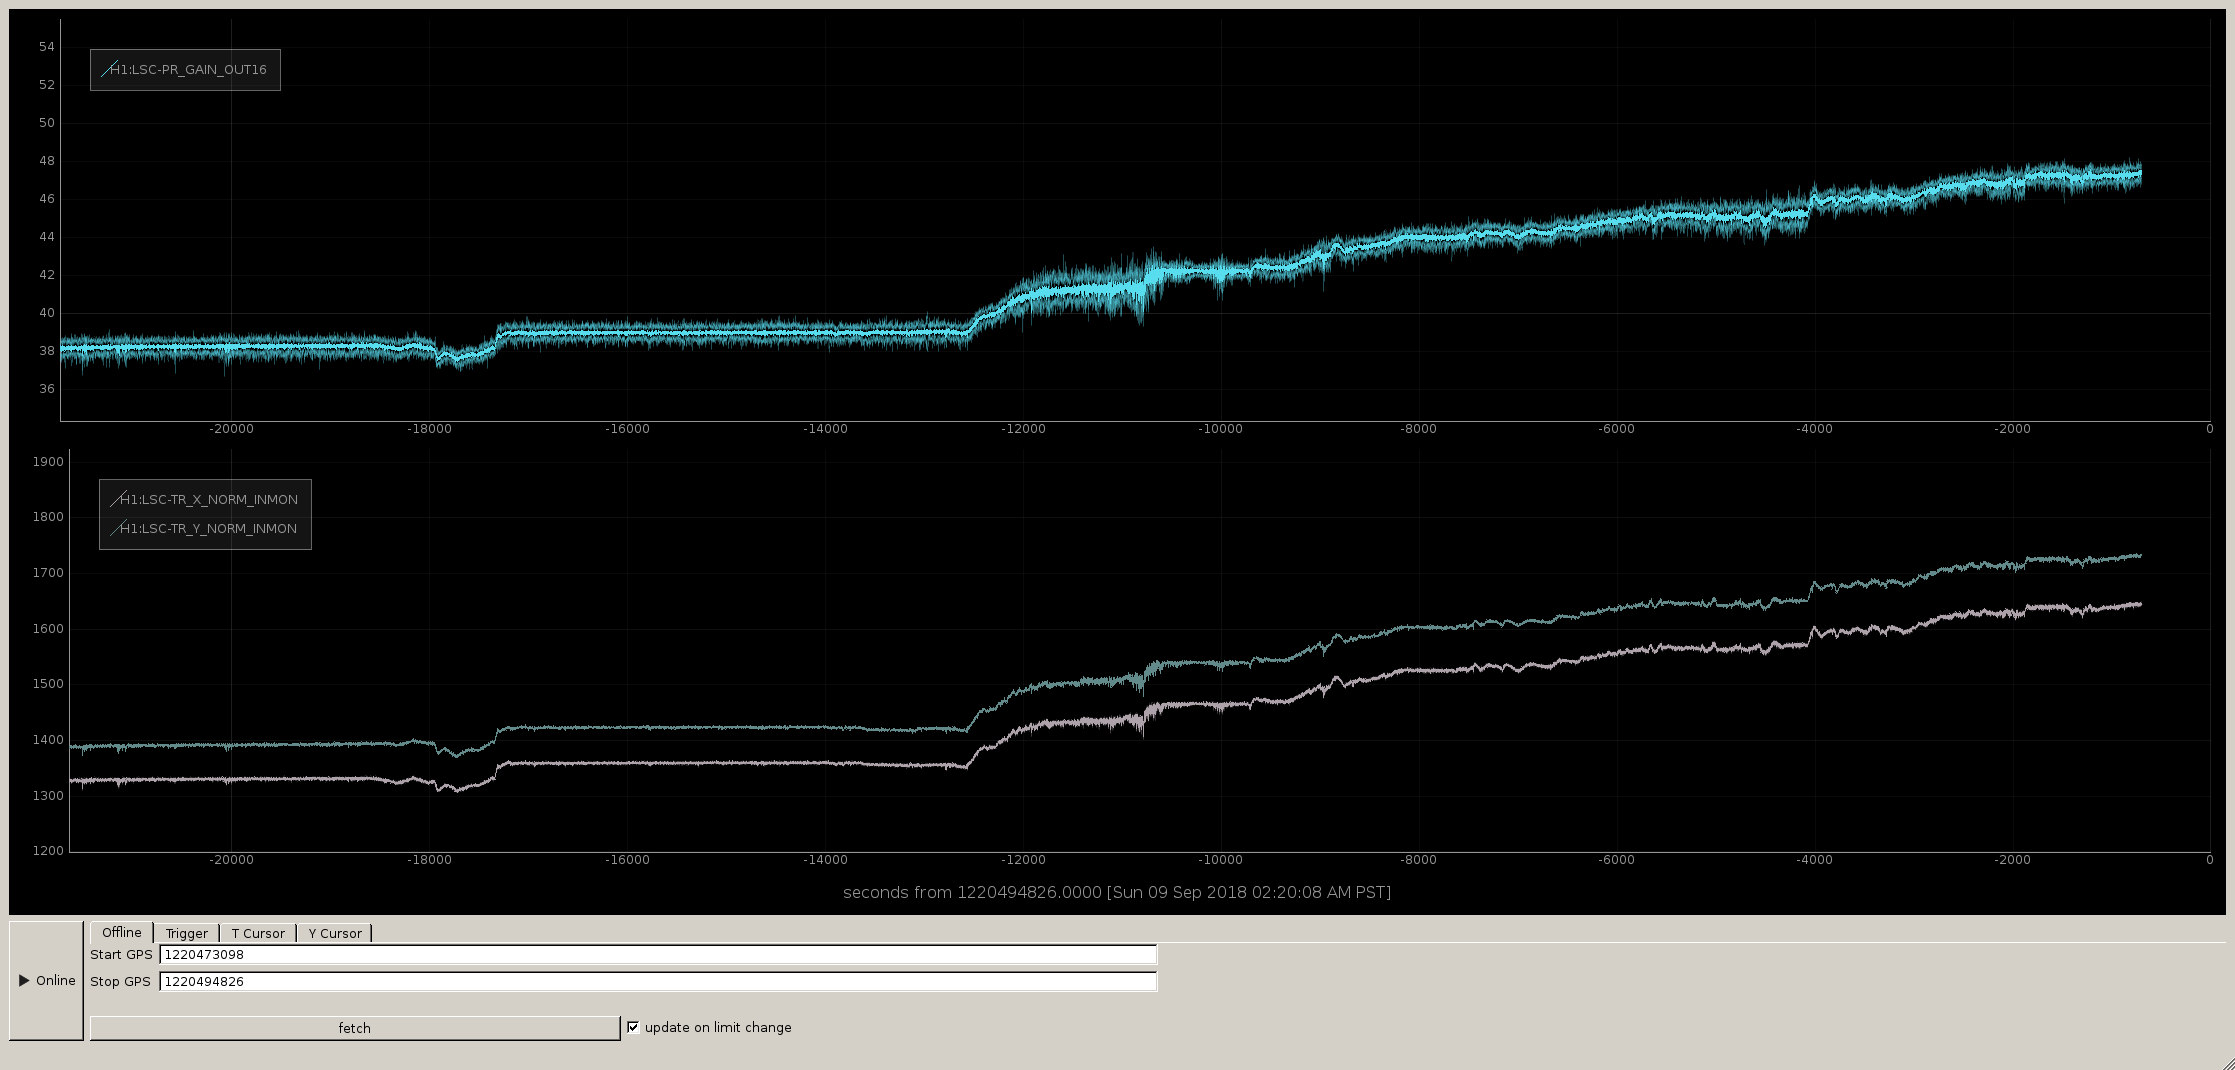
Locking with higher recycling gain:
Hang Georgia and I spent some time on the steps in the guardian in CARM_5_picometers, similar to what we did a few weeks ago after an increase in recycling gain (43787). We mainly adjusted the CARM offsets at which things happen: The step where we digitally increase the CARM gain (LSC-REFLBIAS) and engage the boost is at 65% of the ARM cavity build up, which now means a TR_CARM offset of -48, while the transition to the REFL9 happens at 85% of the arm cavity build up as before (now TR_CARM offset = -54). This has made the build ups more stable during these last steps of the transition and we have succeeded both times we have tried since making the changes. The TR_REFL 9 input matrix element is now 2, where it used to be 3.
In DRMI on POP, Hang adjusted teh DRMI gains by changing the input matrix. The MICH ugf is around 9 Hz (as it has been) SRCL is around 40 Hz (it was 60 Hz earlier today), and PRCL is around 50 Hz (was around 30 Hz earlier today).
In the last few locking attempts we have locked with the ASC error signals close enough to zero that we could engage the ASC loops without any problems, although I know that was not true earlier in the day. I'm not sure if people reset alignment references.
HARD Y loops:
In alog 27832 Jenne shows some measurement of HARD yaw loops that do not have the non minimum phase feature that has been bothering us.
Hang and I re-ran Gabriele's template for measuing CHARD Y, and see that the spot centering efforts haven't changed that feature much. We also saw that DHARD Y is fairly cross coupled to the CHARD, you can see that our CHARD excitation shows up in the DHARD error signal about a factor of 3 smaller than in the CHARD error signal.
I sent a line at 8.1 Hz to both ITMs, and adjusted the output matrix to minimize the signal in DHARD Y, I found that I needed a gain of 1.07 in ITMX (with 1 for ITMY) to balance them. I tried the same for the ETMs, but they were closer to balanced. I changed the output matrix element for CHARD and DHARD Y to ITMX to see if this would have any impact on the transfer function or the cross coupling to DHARD, but it didn't have much of an impact.
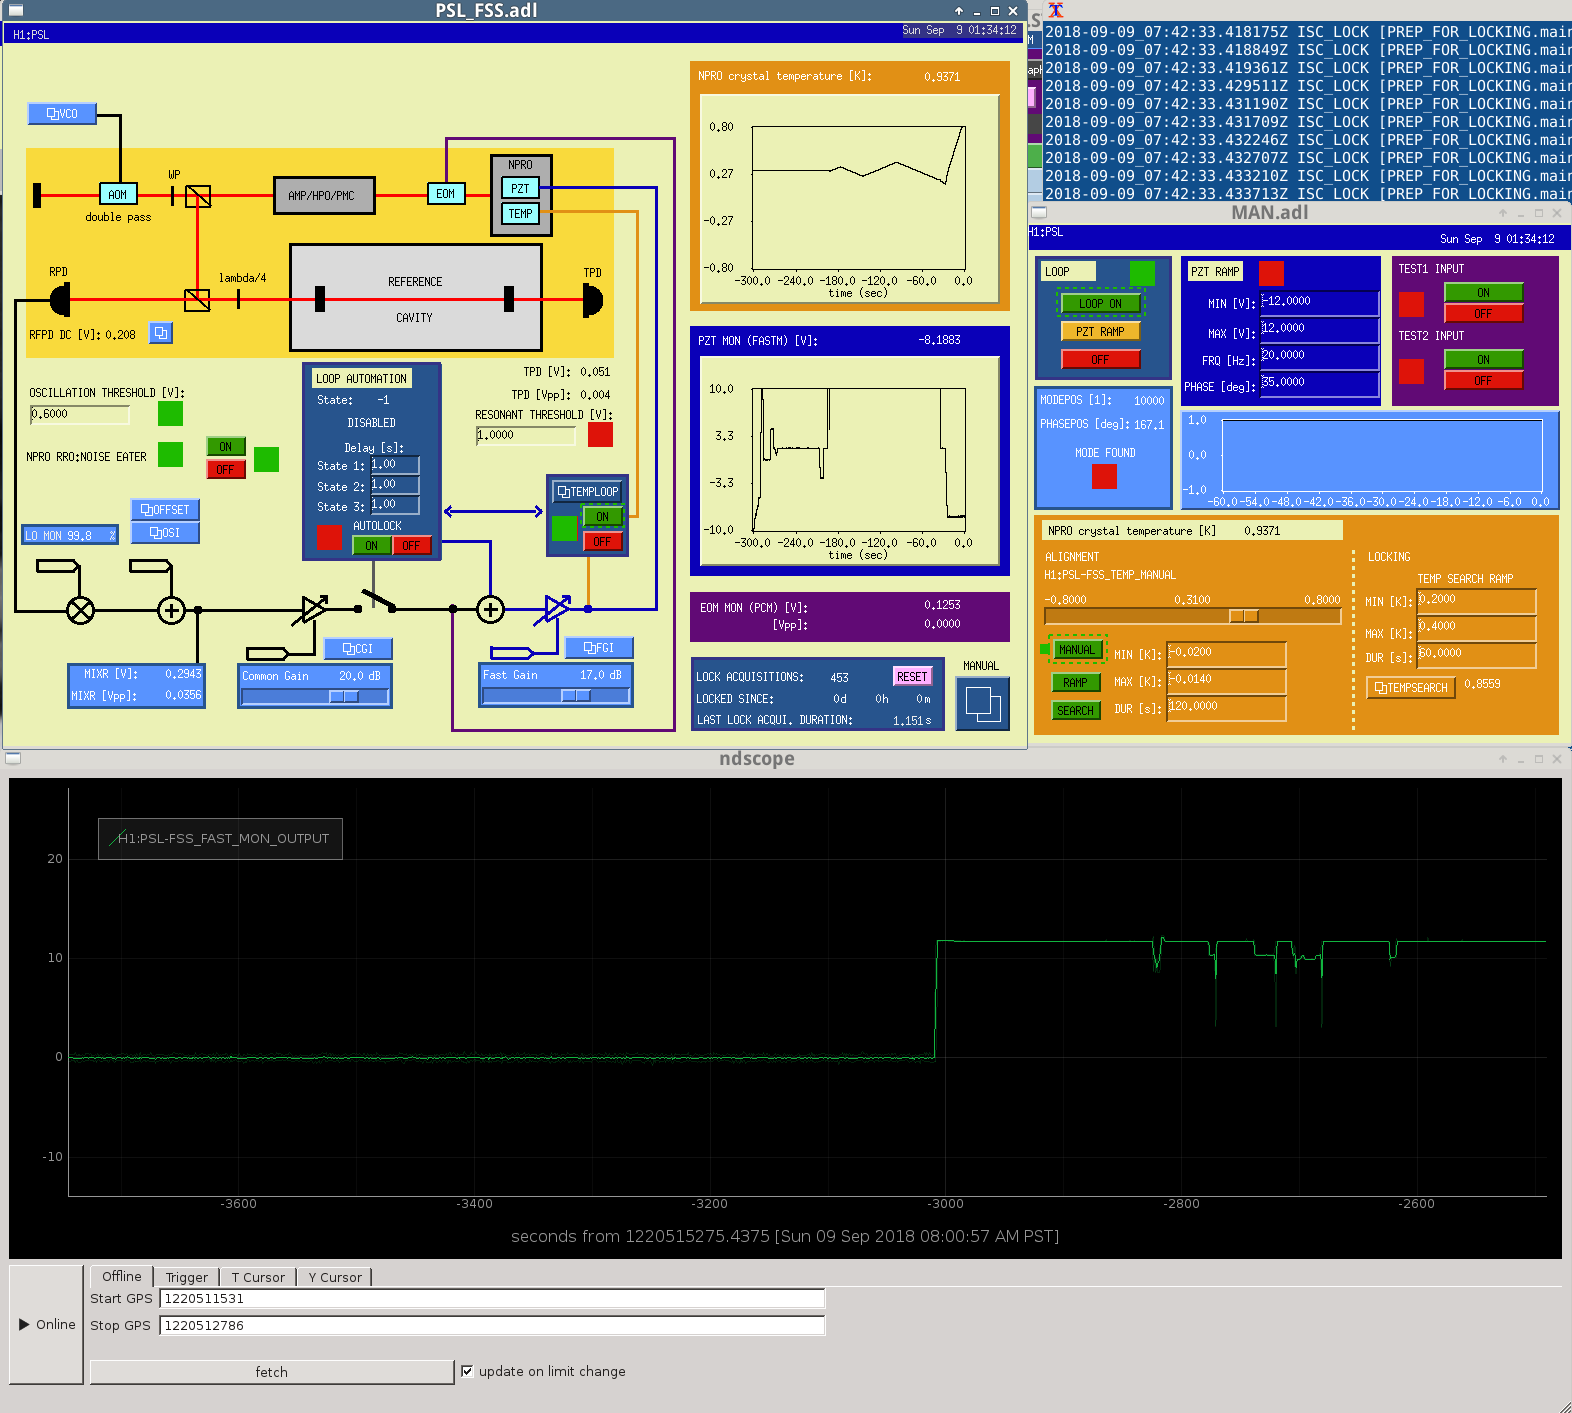
Leaving IFO locked
I am leaving the IFO locked at DC readout with 2 W input power, a2L is running. I used the guardian to engage violin mode damping, it is damping 7 modes on each test mass, and they all seem to be fine.


On 9/3/18, P. King tweaked the mode matching into the 70W amplifier. As Cheryl says, yesterday I took a beam propagation measurement for mode matching into the PMC. To give an idea what the beam now looks like, I've attached a picture of the beam profile taken ~695mm from the 70W amplifier.
As there is a power drop somewhere between the 70W amplifier and the PMC, we did a quick a power budget using the water-cooled power meter; all measurements were done with the ISS OFF:
The largest power loss is at the ISS AOM, where we lose 3.4W. We had suspected clipping at this AOM, and it looks like that is the case. We will have to re-think our PMC mode matching scheme to get the beam smaller at the ISS AOM.
With the 70W beam looking better, I wanted to get an idea of where we are now in regards to PMC mode matching. Without changing the mode matching scheme for the PMC, I took a quick measurement of the PMC visibility using the locked and unlocked voltage from the PMC locking PD. This was also done with the ISS OFF:
Simply by cleaning up the 70W beam (via Peter's 70W amp mode matching tweak), we are at >80% visibility. This is, however, somewhat disconcerting. Looking at the above power budget, we are only transmitting ~73% of the power incident on the PMC, so something isn't quite adding up here. Something to think about before next Tuesday.