(I learned from T0900486 "IO Stray Light Analysis and Baffle Design" that the IFI input baffle is called HA3, IFI output baffle is HA6, the baffle right in front of IM4 is actually supposed to be a pair of HA12-a and HA12-b but there's only one baffle which I suppose is HA12-a, two-hole baffle for ISS array is HA11, and the last IFO REFL before the beam leaves HAM2 is HA13.)
Clipping on the IFI input baffle (HA3) might not be real
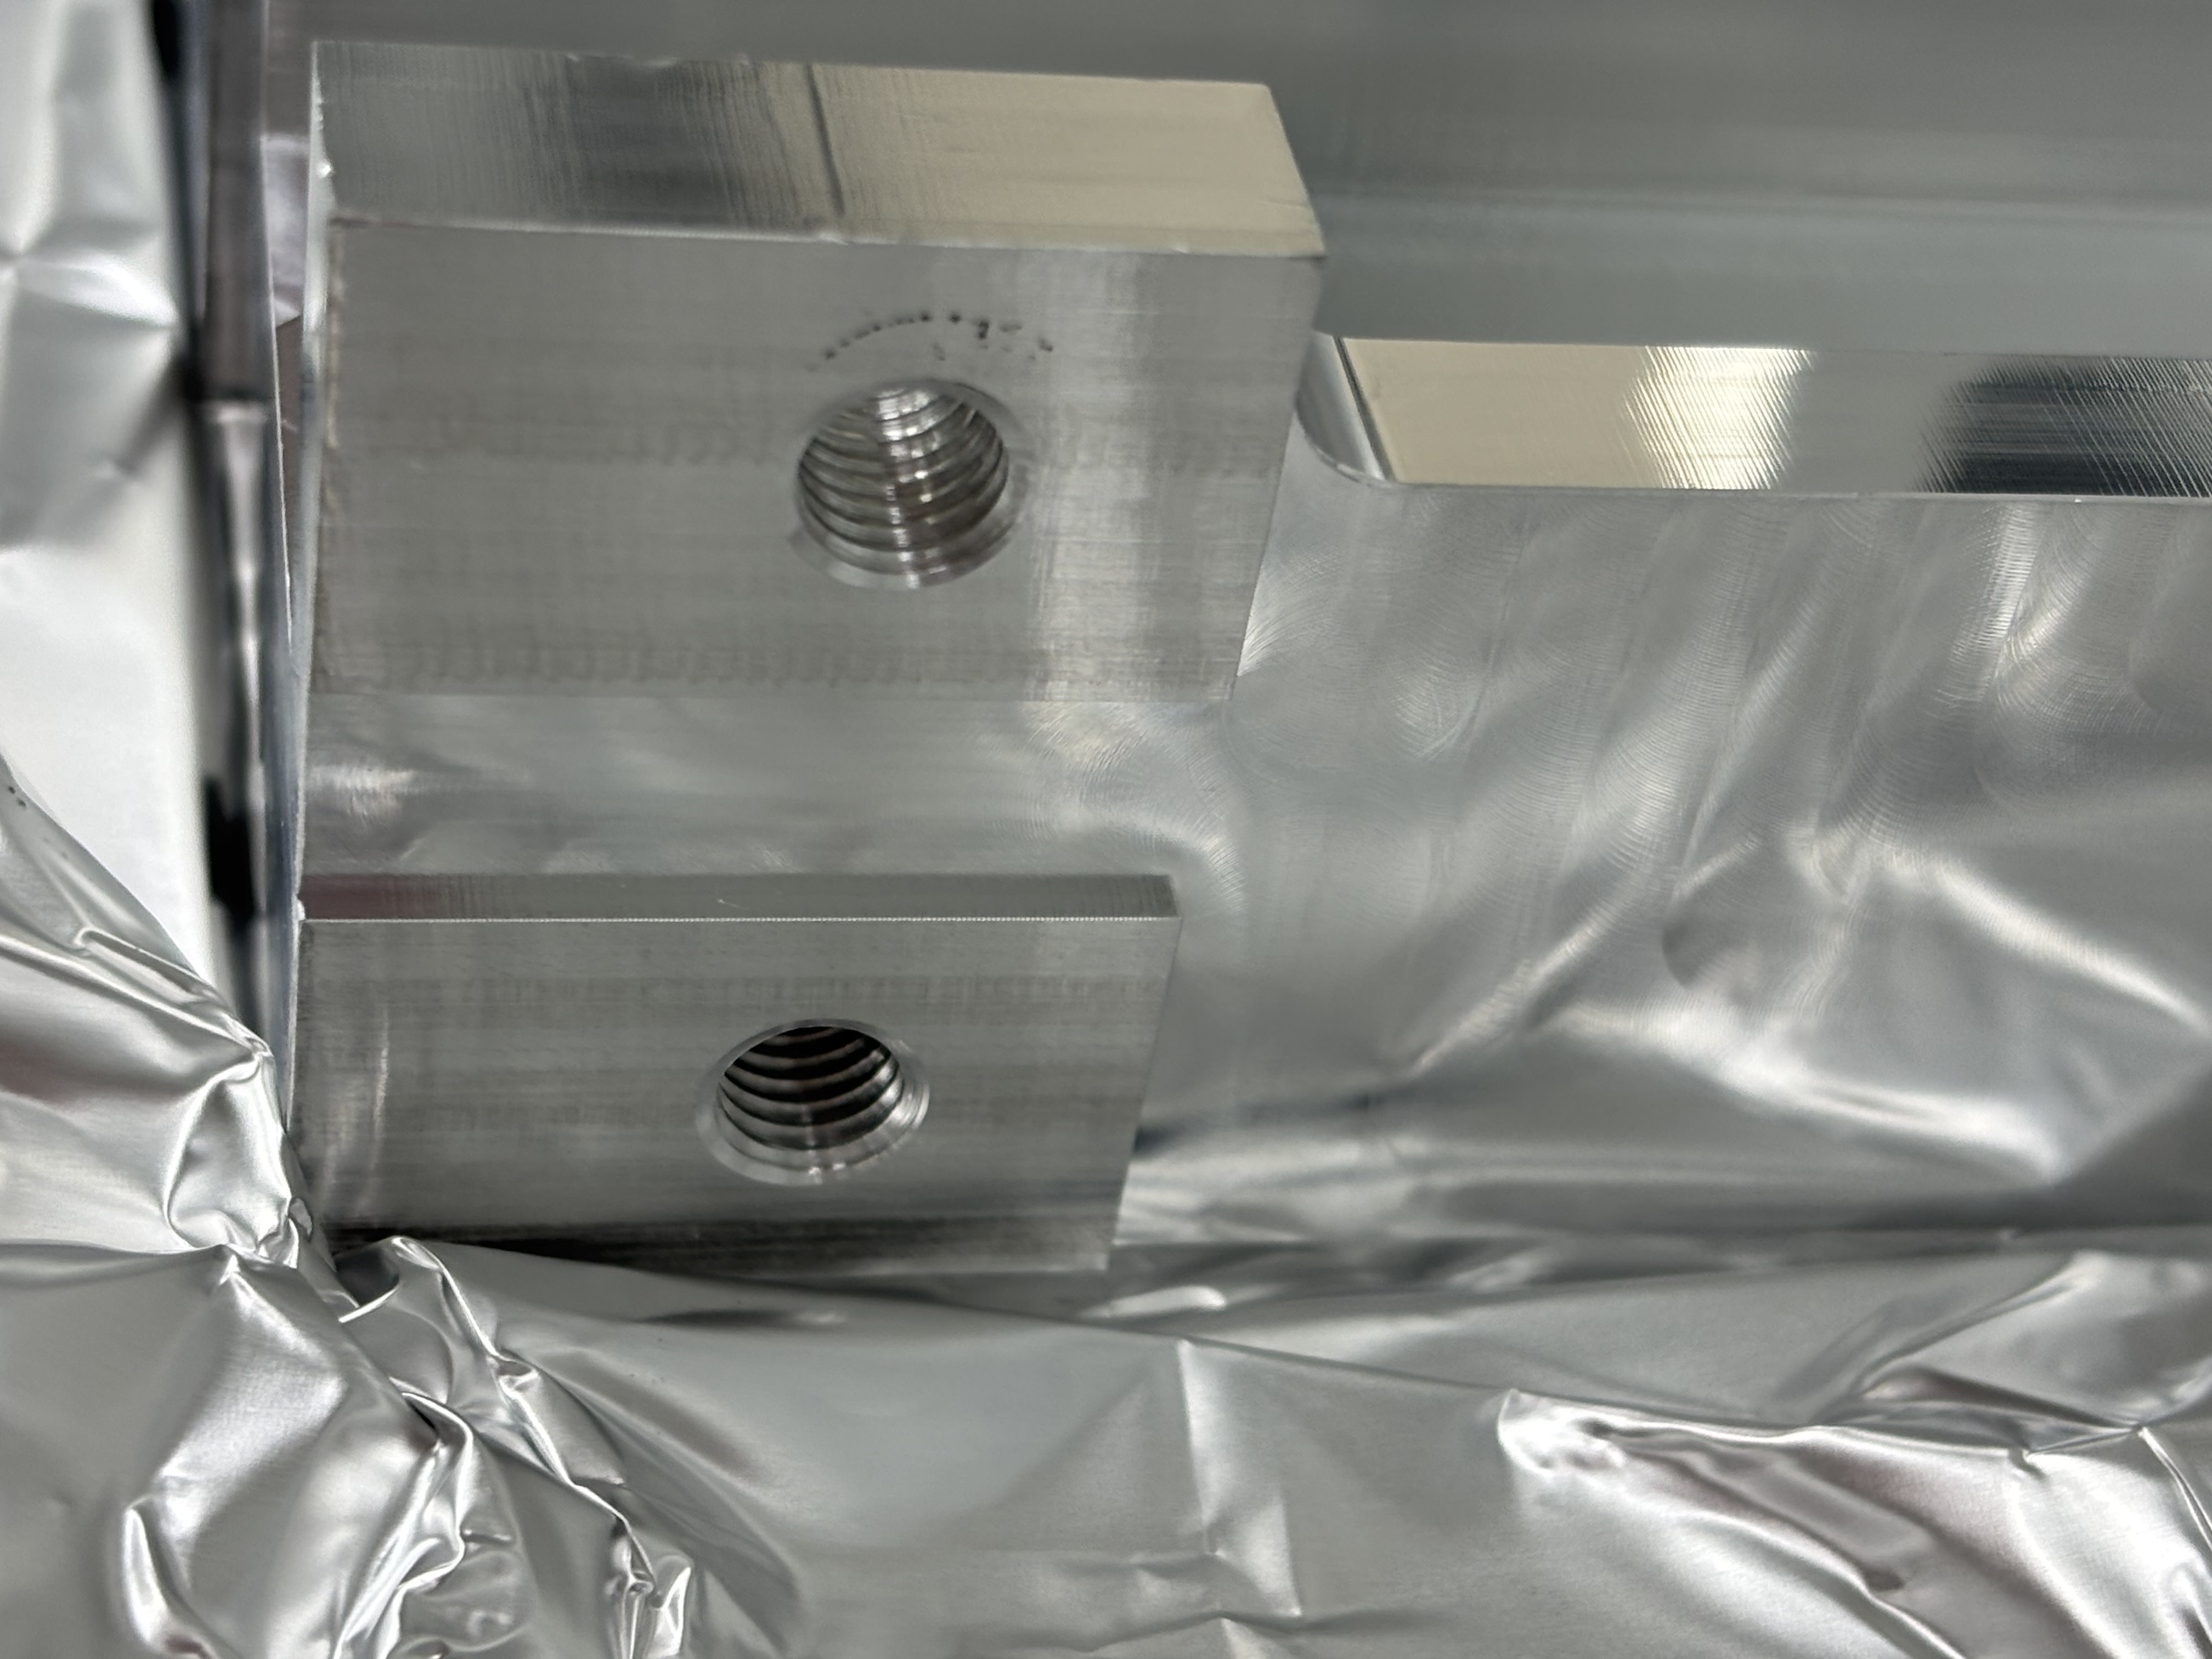
The beam spot on this baffle was OK before we did anything to IM1 on Tuesday (IFIinput_before.jpg). It's low and toward +X, but nowhere near clipping.
This baffle is right in front of the calcite wedge that deflects the IFO REFL beam away from the incoming beam path from IM2 (HA3_calcite_wedge.png). The lever arm from the wedge to the baffle looks to be an inch or so at most. Hard to imagine that the REFL is clipped while forward going beam is not, but the scattering goes away when I block the beam between PRM and IM4.
The reported "IFO REFL beam clipping" on this baffle is either because the PRM is not retroreflecting, or maybe it's some kind of ghost beam produced from the PRM reflection somewhere.
If we establish that the main IFO refl is NOT clipped when PRM retroreflects, we don't have to worry about this baffle too much (though ghost beam is still a problem).
We will have to bring a card with a hole to make sure that the beam is retroreflected as good as we can.
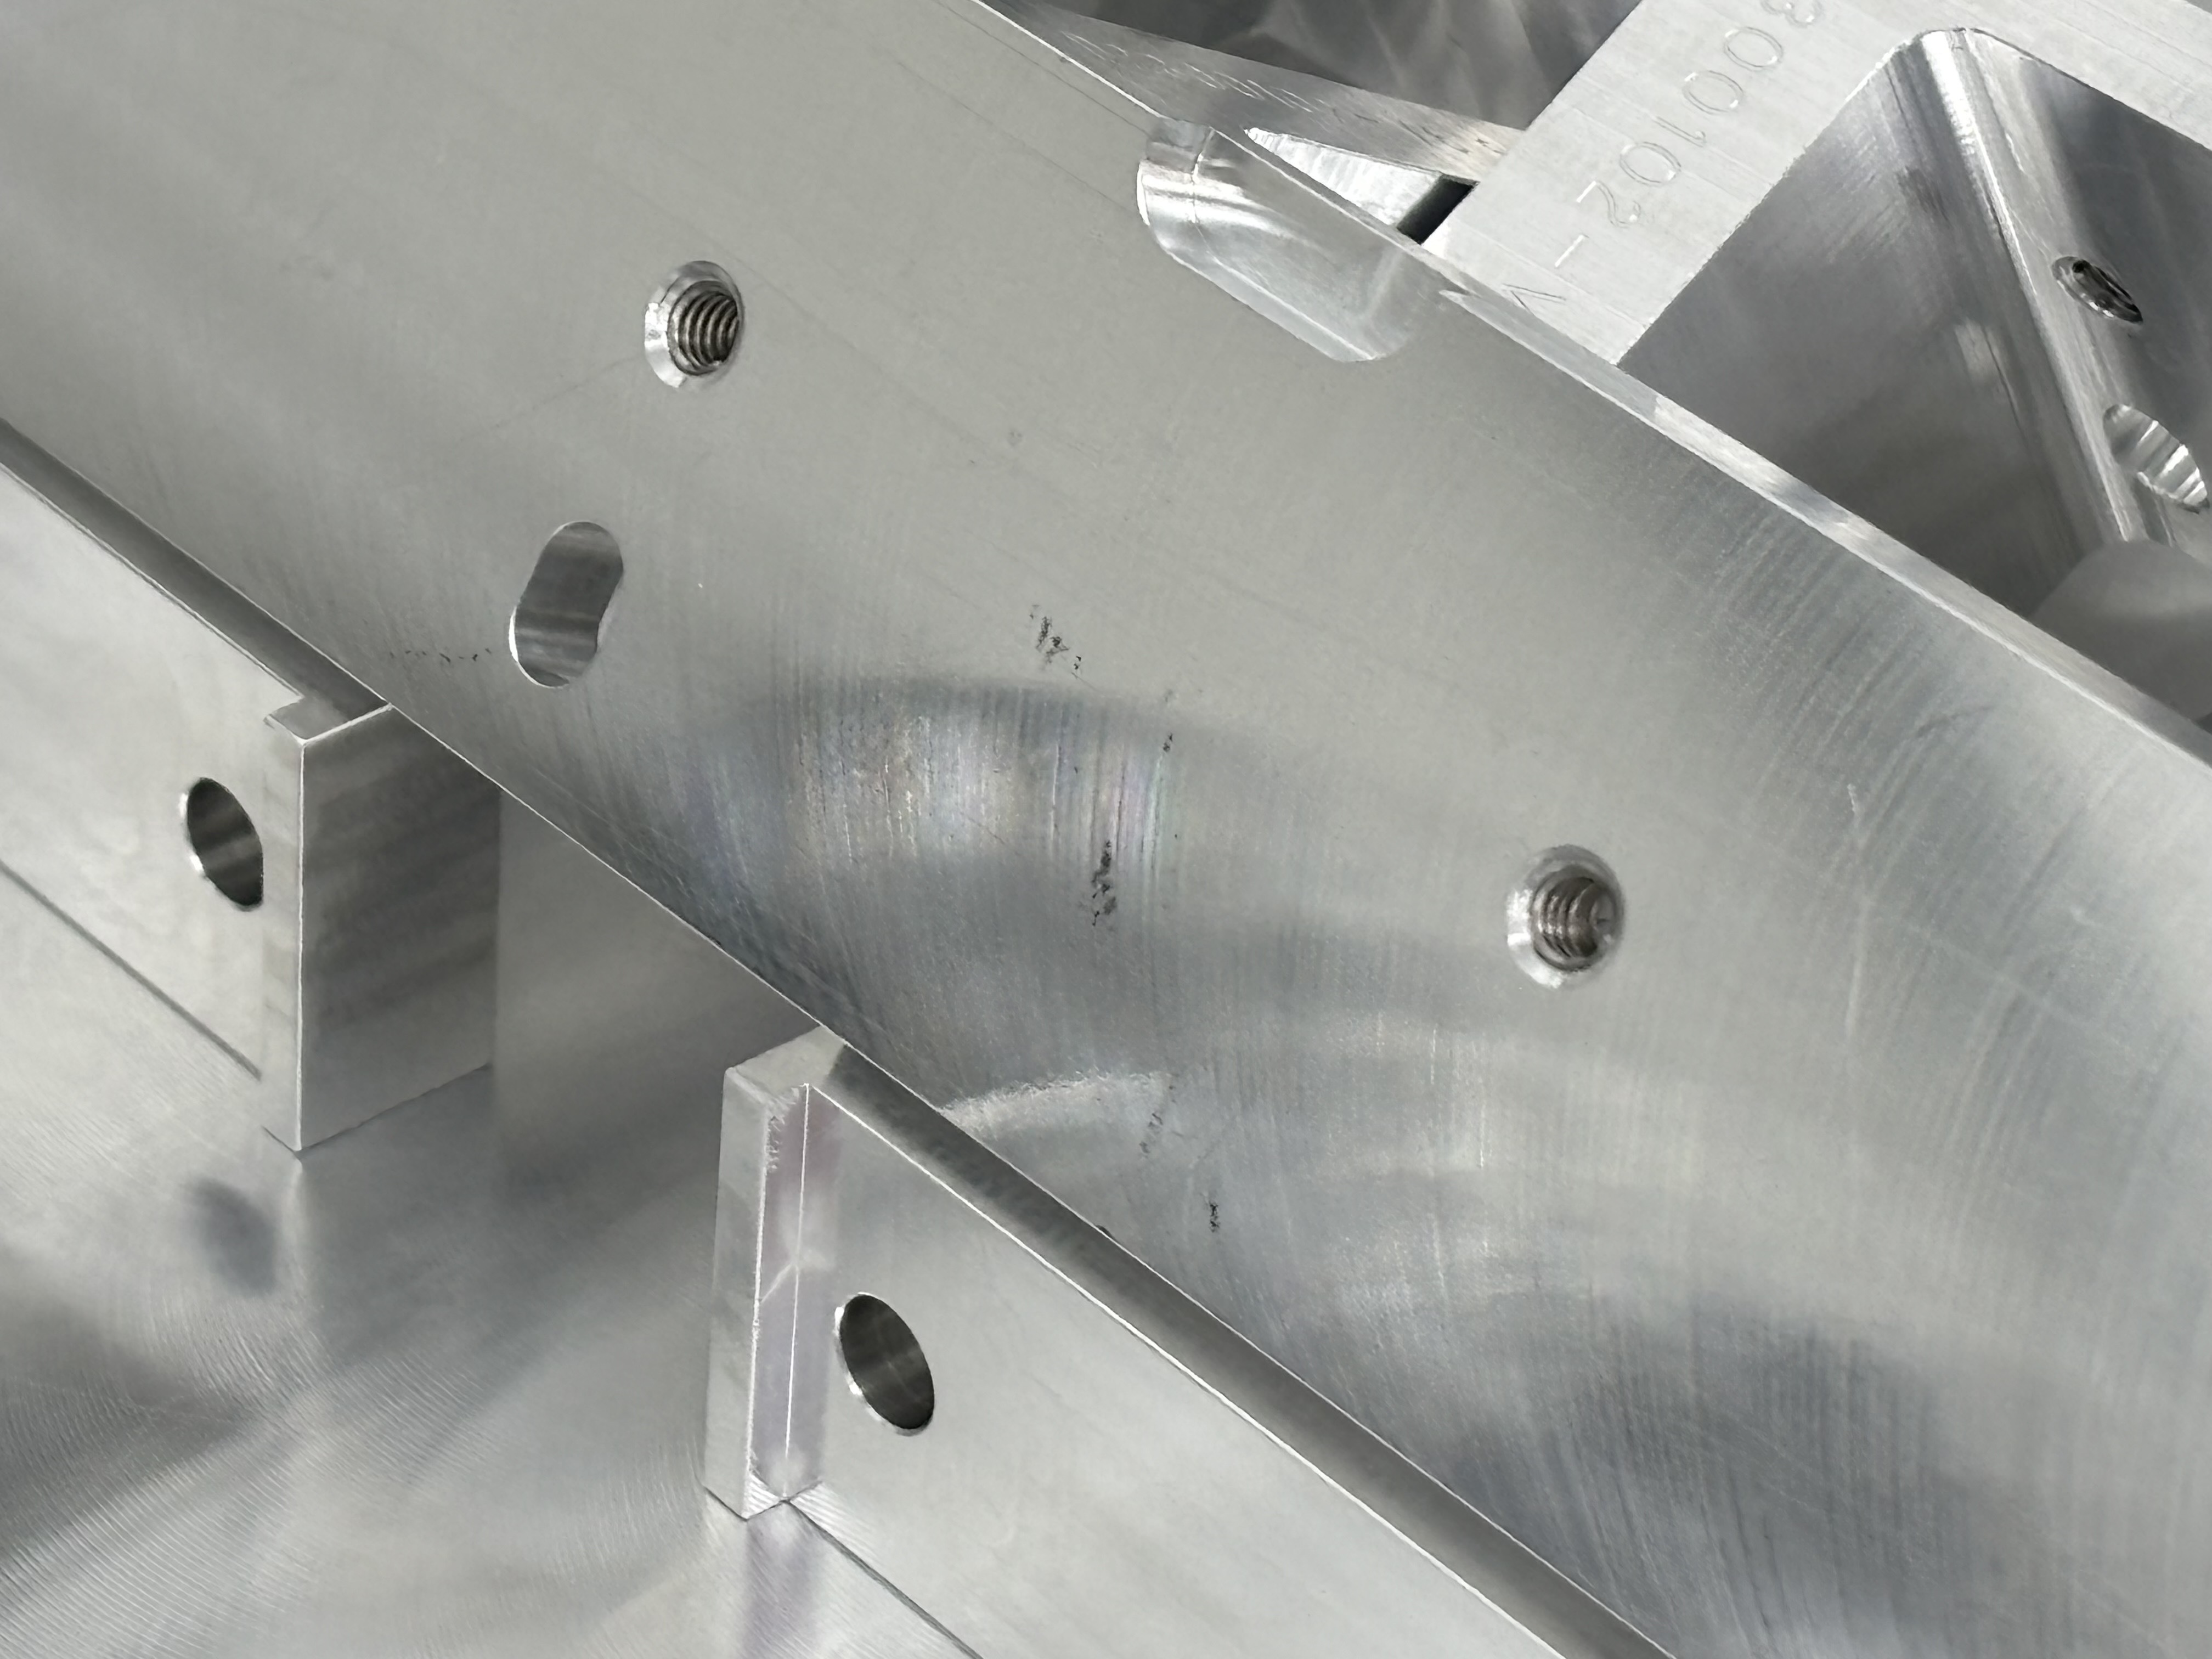
FYI, IFIinput_aftercentering.jpg shows the same baffle after we made a huge change in IM1.
We THINK that the beam on the IFI output baffle (HA6) is OK too but we need to check
We don't have any good view of that baffle so it's hard to assess, and we forgot to check it before making changes to IM123.
However, given how small the change was on IFI input baffle, we don't expect that it was very bad before. We'll have to revisit and confirm.
IMC beam spots
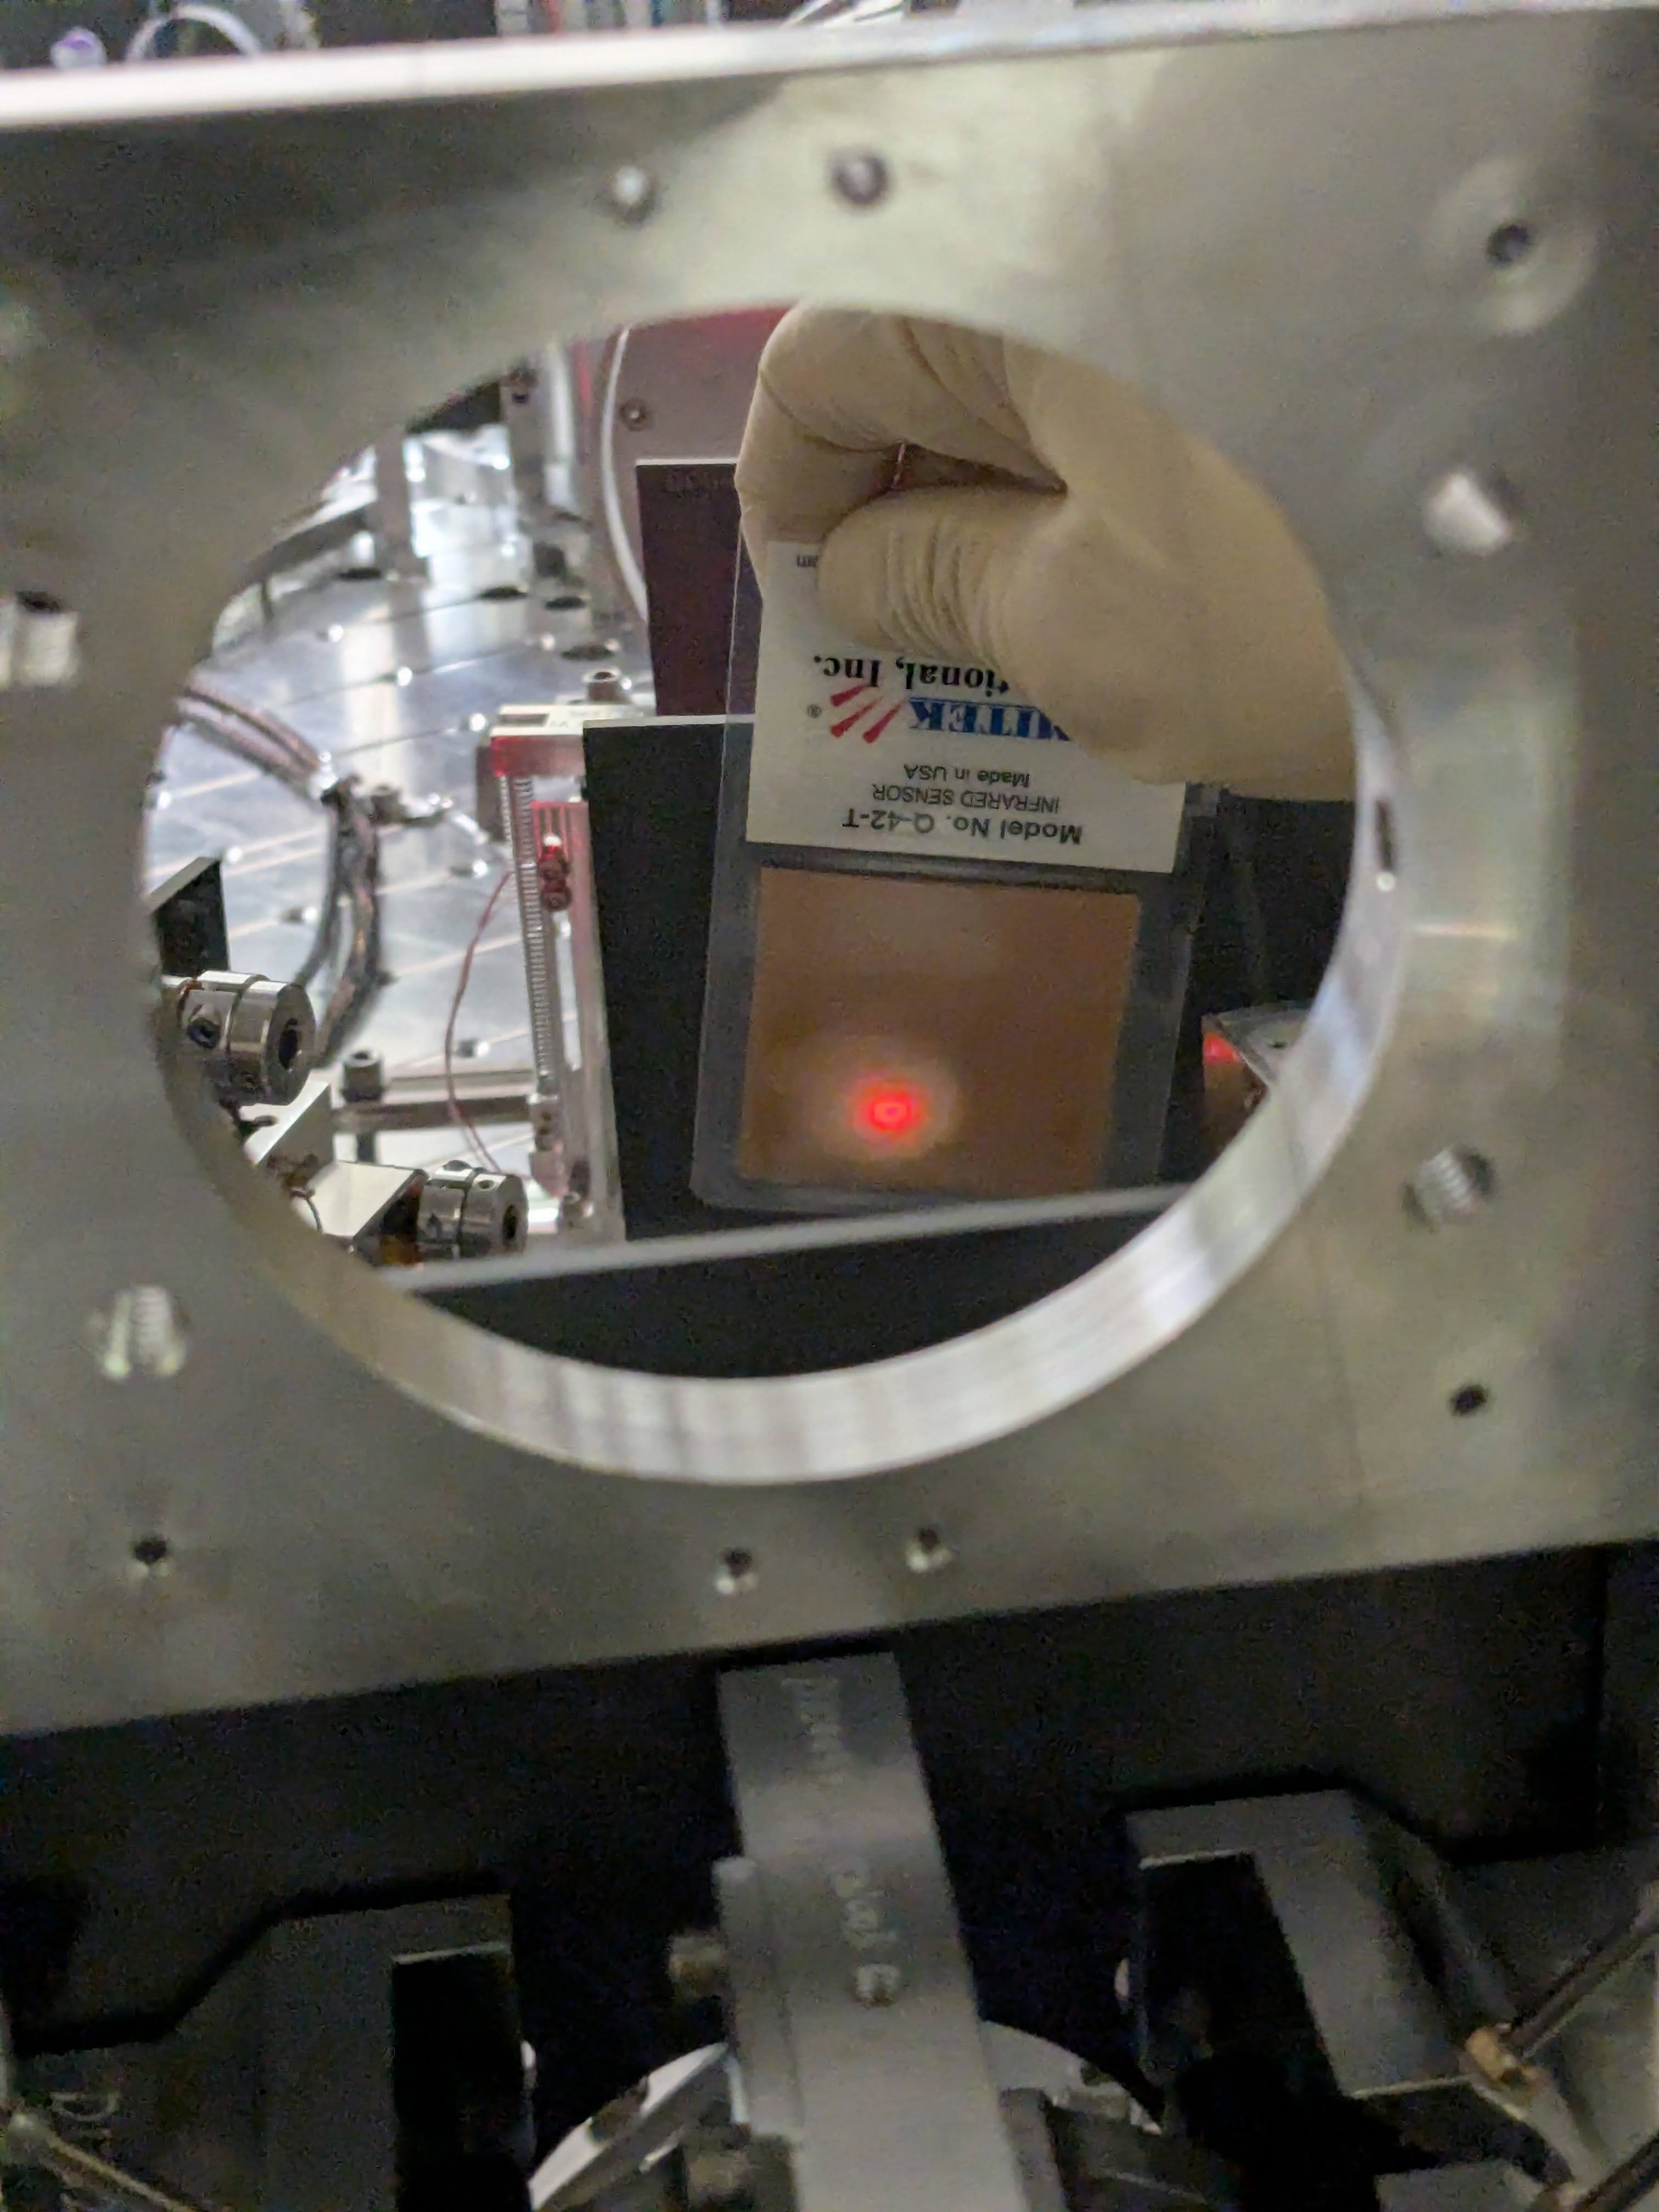
As of now, the measured beam position in front of MC mirrors are as follows this. For measurement points, see mc_beampos_measurement_cartoon.jpg. The height is pretty good for all. MC3 is great horizontally too. Beam spot on MC2 and MC1 are both shifted in -Y direction. MC2 by 3.6+-1mm, MC1 by a couple +-1mm.
| |
Height from ISI measured [nominal] |
Horizontal shift in Y direction from the nominal beam position |
| MC1 |
154.3 +- 1.3 [155.5] |
-1.9 +- 1 |
| MC2 |
167 [166.7] |
-3.6 +- 1 |
| MC3 |
154 +- 0.5 [155.5] |
+0.3 +- 1 |
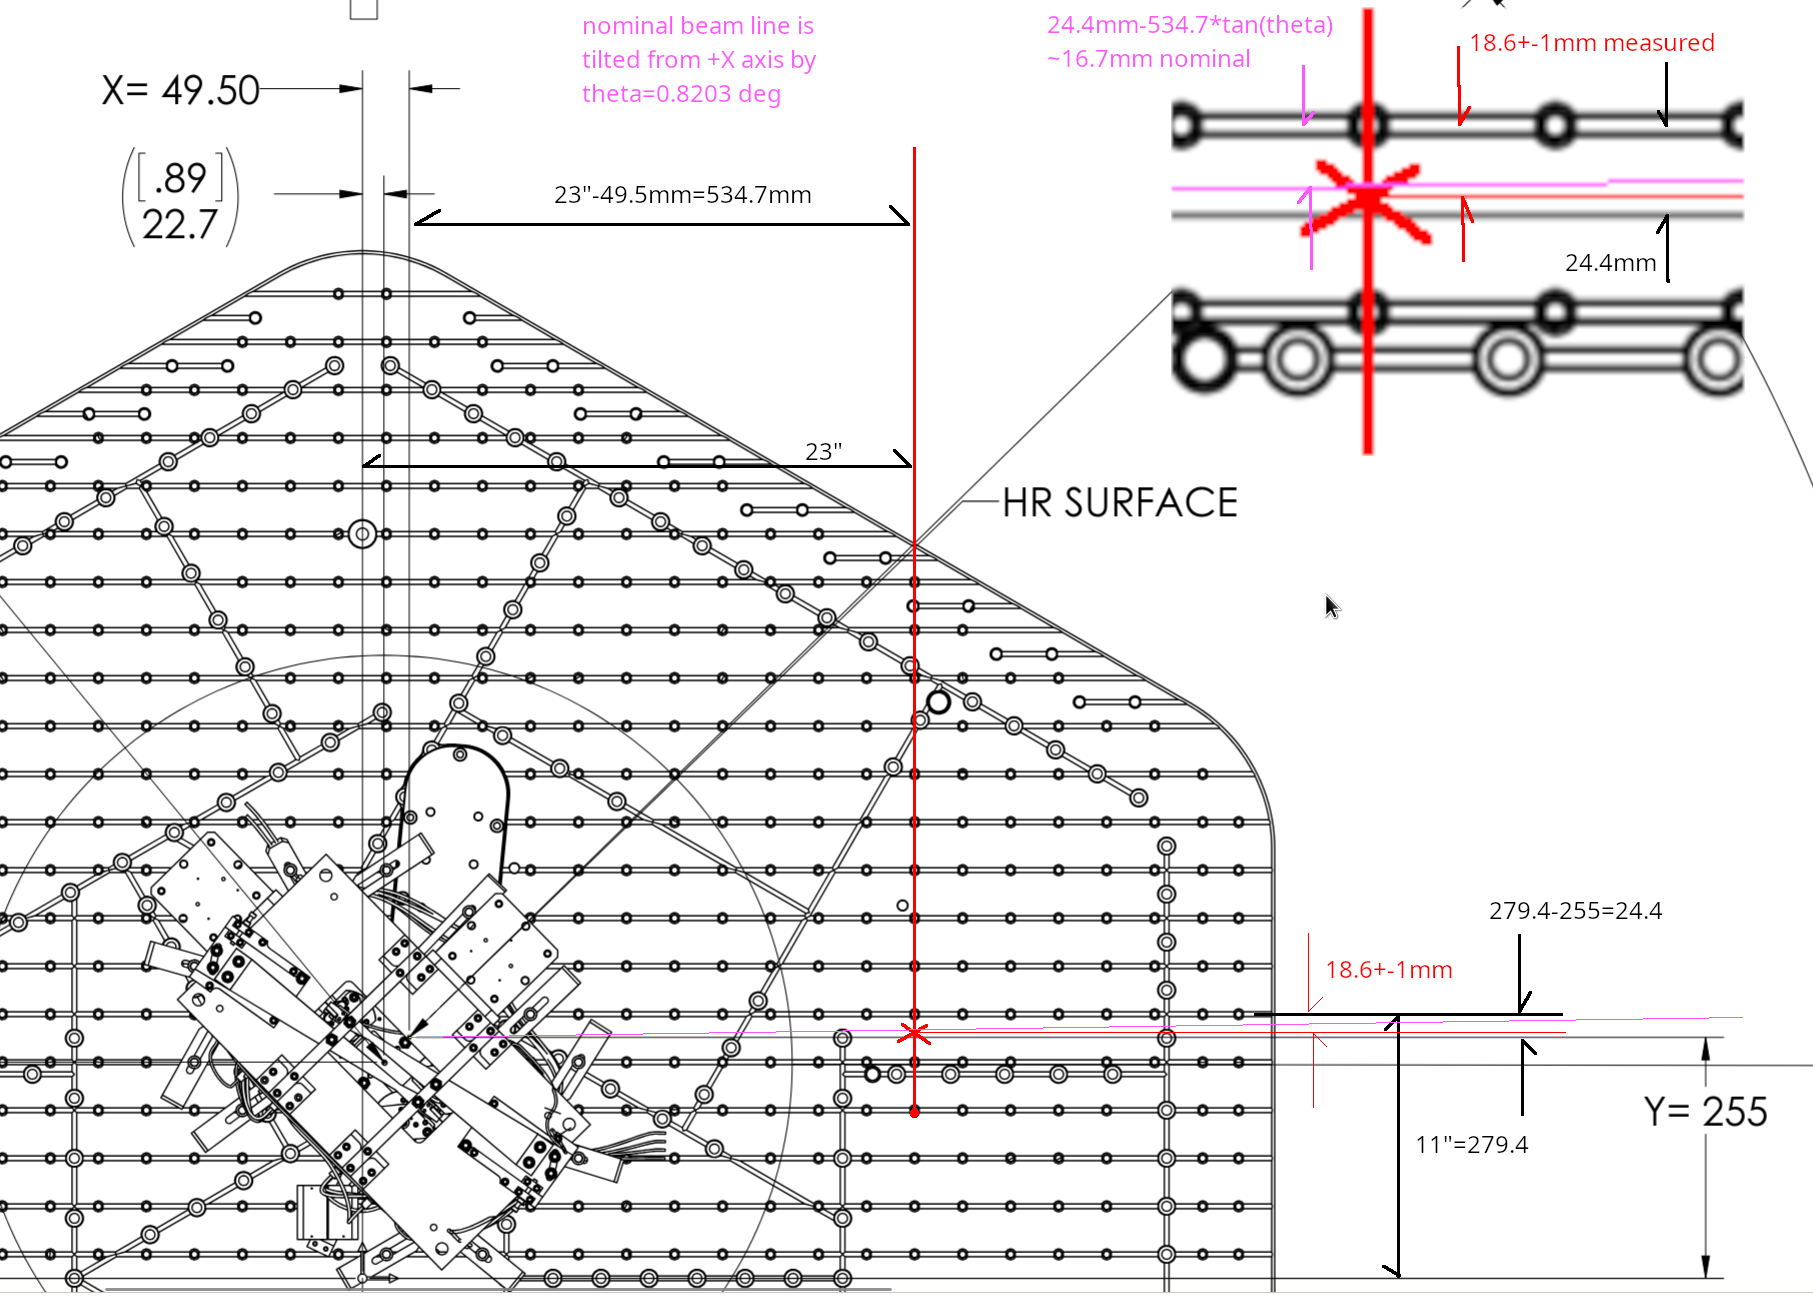
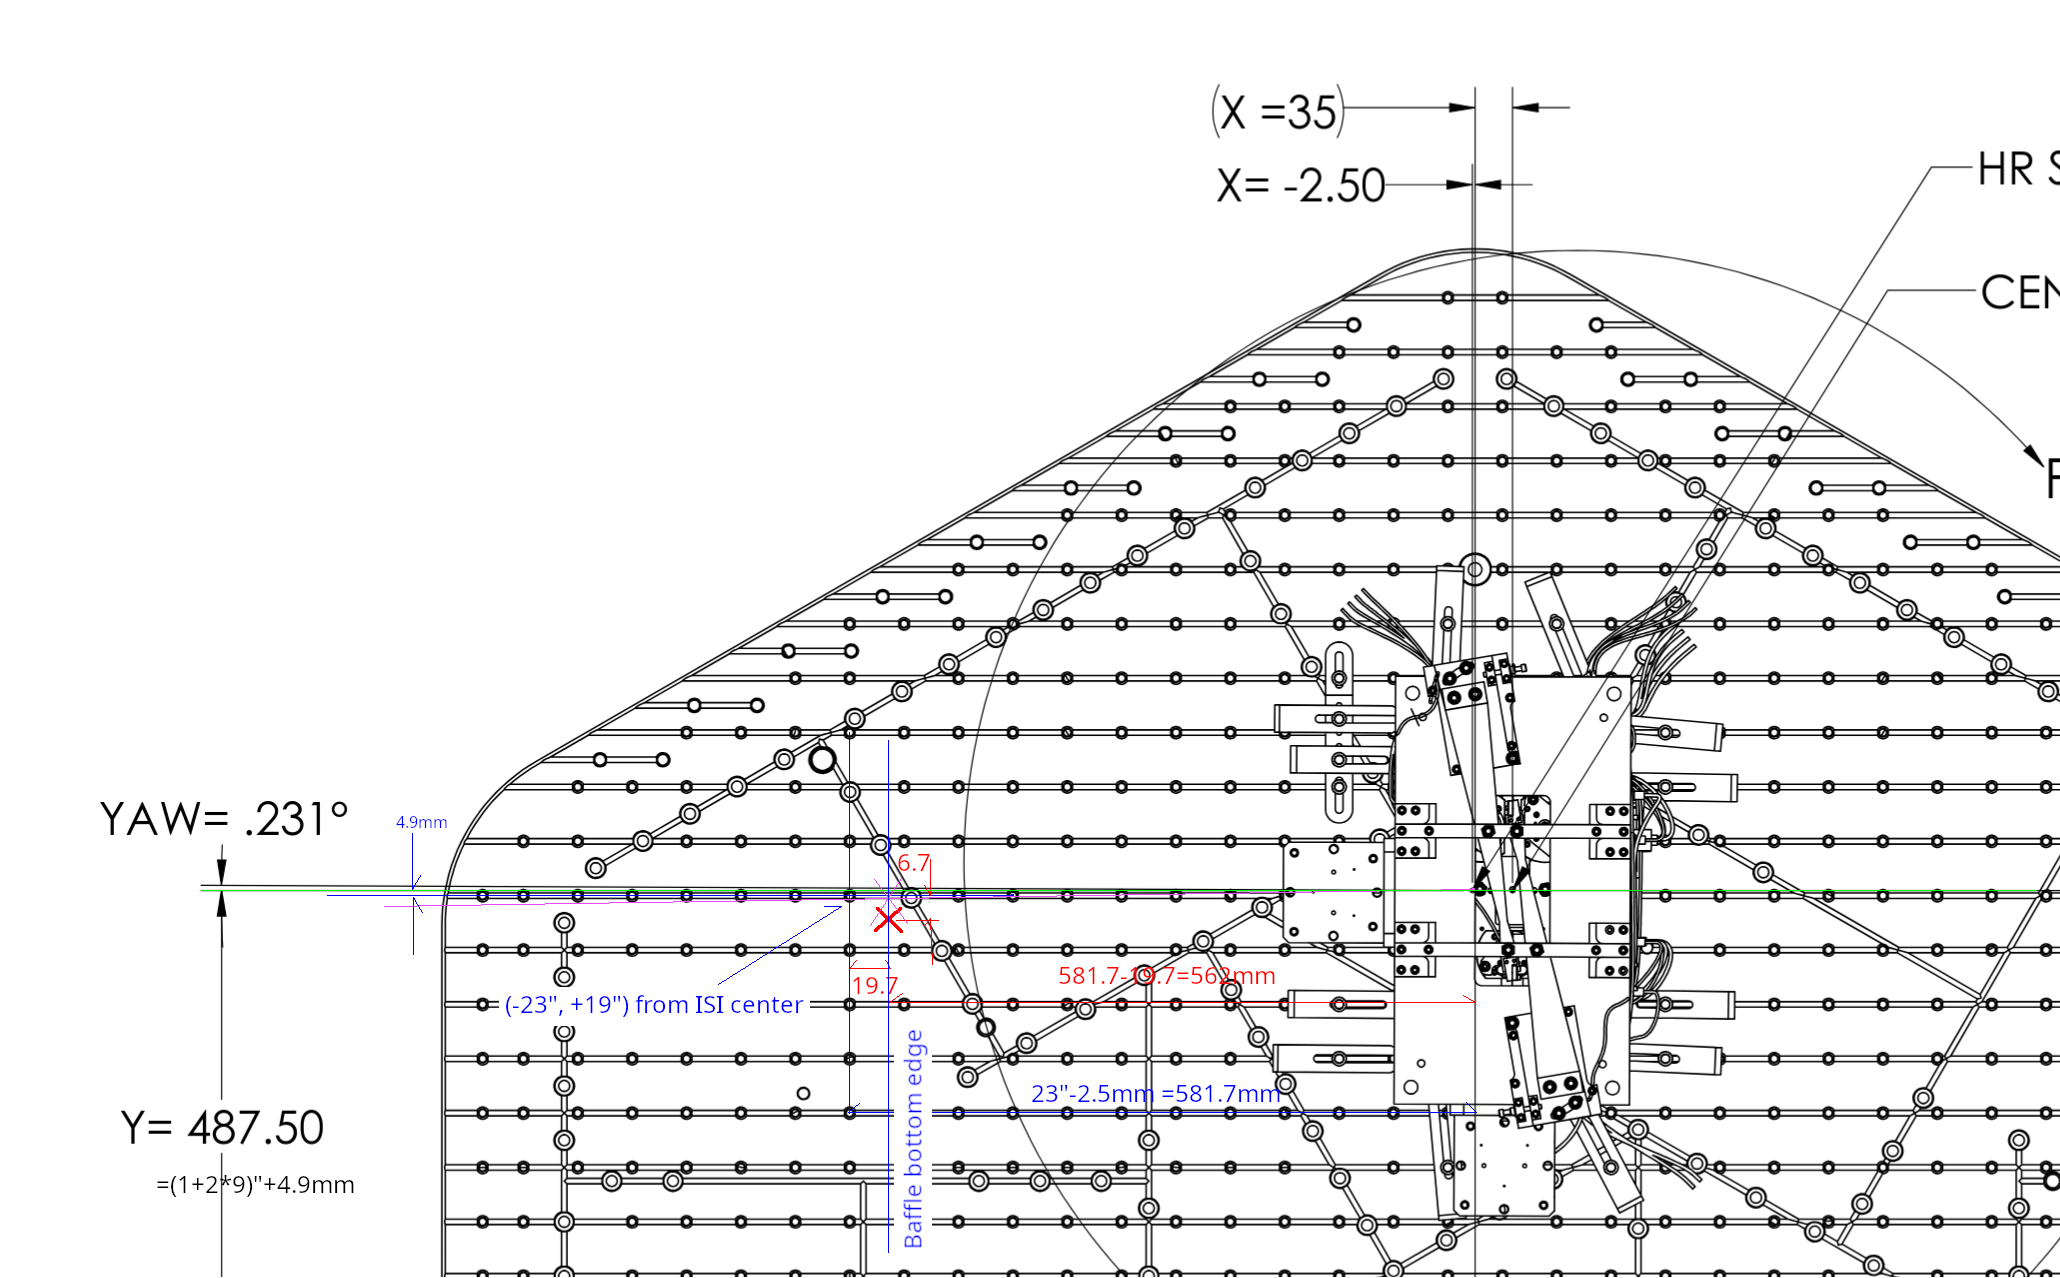
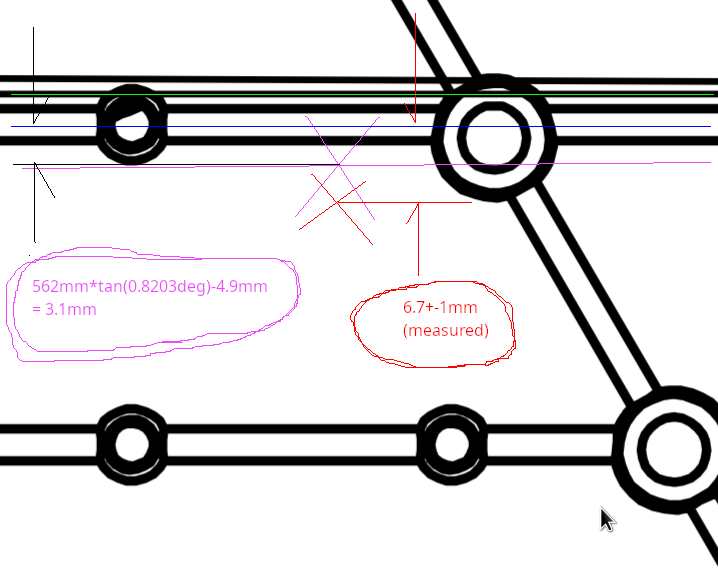
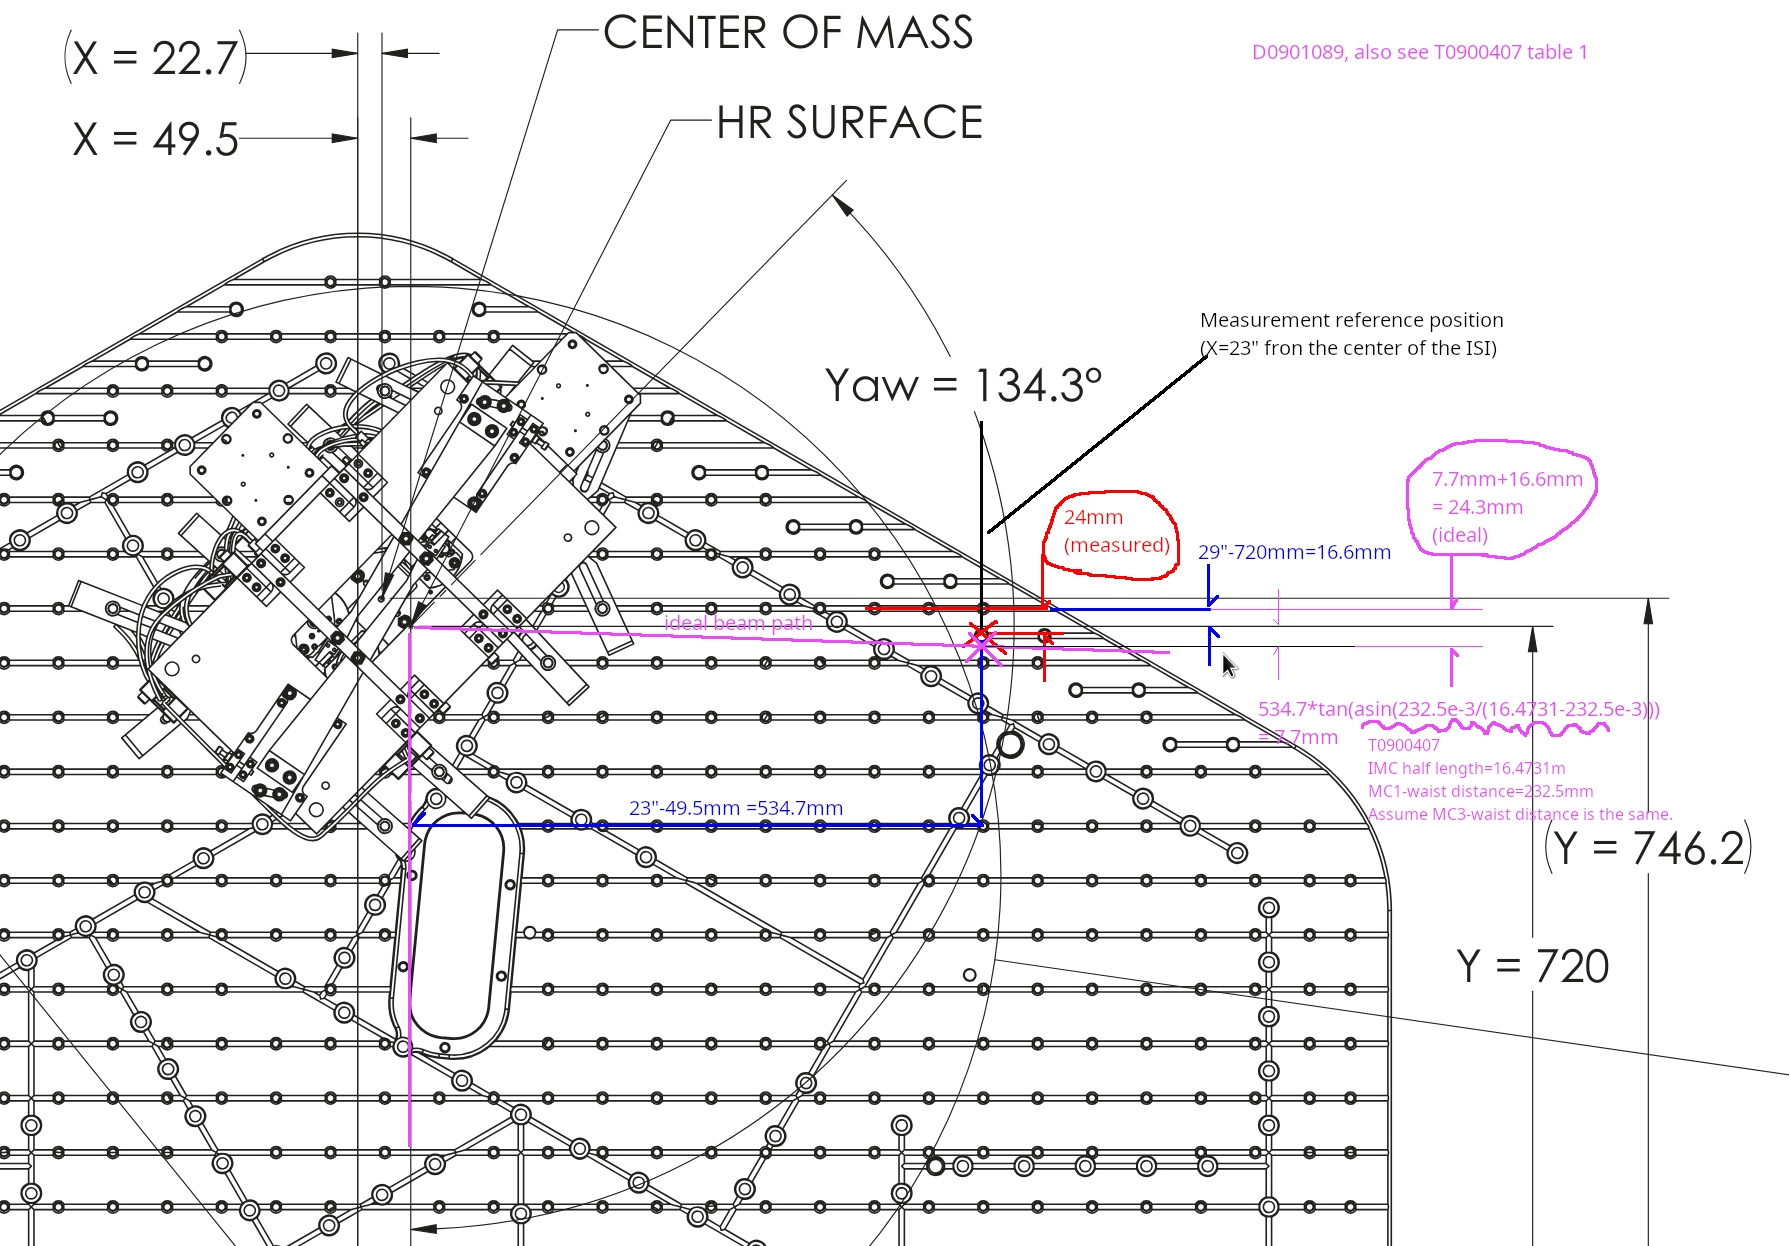
Horizontal positions were determined by covering half of the beam with a vertical hard edge (ruler etc.) and then measuring the position of the edge relative to the neighborhood screw holes using a small ruler, and then using the drawings (D0901088, D901089, D0901099) as well as other IO documents (e.g. T0900486) to figure out the nominal beam location. As an example of tedious work done, see ham2mc1.png. Due to the way it was done, we cannot determine the horizontal position of the beam much better than maybe 1/2 of the beam radius. I just put +-1mm error for all measurements. Height numbers were measured off of a ruler, the error bar (if any) is the difference between Rahul's reading and mine divided by two.
What if we move MC2 or MC3 beam spots (or both) to unclip IM4 baffle (HA12)
To get more sense of magnitude of IMC motion relative to the beam motion on IM4, I calculated how much the IMC alignment should be changed to move the beam on IM4 by 3mm in -Y direction (comfortably far from clipping but not enough to center) without moving IMs.
There are many linear combinations of the MC3 spot position and the angle of the beam coming through MC3 that will move the beam on IM4 by 3mm, so I just chose "parallel transport of MC2-MC3 line" (i.e. no angle change of the angle of the beam coming out of MC3), "rotate MC2-MC3 line around MC3" (i.e. no beam displacement on MC3) and something in-between ("rotate around MC2").
See cartoon_IMC_alignment_to_unclip.png (not to scale but the sign of displacement/rotation is correct along the entire path) and IMC_to_unclip_HA12.png (actual calculation). IMC is not the only thing that moves, we can also move IM2, but anyway. In the "parallel transport" case the beam will be move further away from the center of MC2 (remember it was already 3.6+-1mm in -Y direction to start with so the end result will be 6.8+-1mm in -Y direction). OTOH in the "rotation around MC3" case, the beam on MC2 will move by 11mm in +Y direction so the end result will be 11-3.6+-1=7.4+-1mm in +Y direction.
In all cases the beam will likely still hit the IM4_TRANS because the QPD (Excelitas C30845) has a huge 8mm active diameter, but it will likely be completely in one quadrant. So all of these will be bad solution if we believe that the IM4_TRANS position should be close enough.
Note that the "rotation around MC3" case will result in about 1mrad beam angle change on IM4. This needs to be absorbed by IM4 rotation by about 500urad to send the beam to PR2.
It's also worth noting that IM4-PRM HR distance is almost the same as IM4-IM4_TRANS distance.
What if we fix the beam on IM4_TRANS?
Instead of IMC alignment, now let's think about the beam positions from the end point (IM4_TRANS).
Again, assume that we want to keep the IM4 TRANS beam position. We tried two different IMC alignment, and the beam was clipped on IM4 baffle (HA12) after bringing the beam back to the target IM4 TRANS position.
Moving the beam position on HA12 by 3mm in -X direction without changing the IM4_TRANS position means that we shift the beam position on IM3 by about 8mm. IM3-IM4 path beam angle changes by 4.8mrad counter-clockwise. This is an absolutely huge change.
PRM should be moved by 2.4mrad, and 8mm on IM3 is already the radius of IFI output baffle (HA6) so we'll be worrying about clipping there. There seems to be no solution where the beam is far enough from the IM4 baffle (HA12) edge AND the beam is on the same position on IM4_TRANS as in vacuum.
As far as we assume that IM4_TRANS is trustworthy, it's very likely that the beam was clipping or at least very close to clipping on HA12 in O4.
However, if IM4_TRANS path moved after HAM2 was opened (i.e. somebody bumped something), IM4_TRANS position as of now doesn't mean anything. We have to at least grab and wiggle the steering mirror as well as the QPD for that path to make sure that nothing is loose. (I already did that test for MC2 TRANS, and they didn't move.)


