Gabriele, Hang
We were able to close all the DRMI ASC loops, including SRC2 (AS_C -> a combination of SRM & SR2; as Gabriele pico'ed the beam to the center of AS_C).
=====================================================================
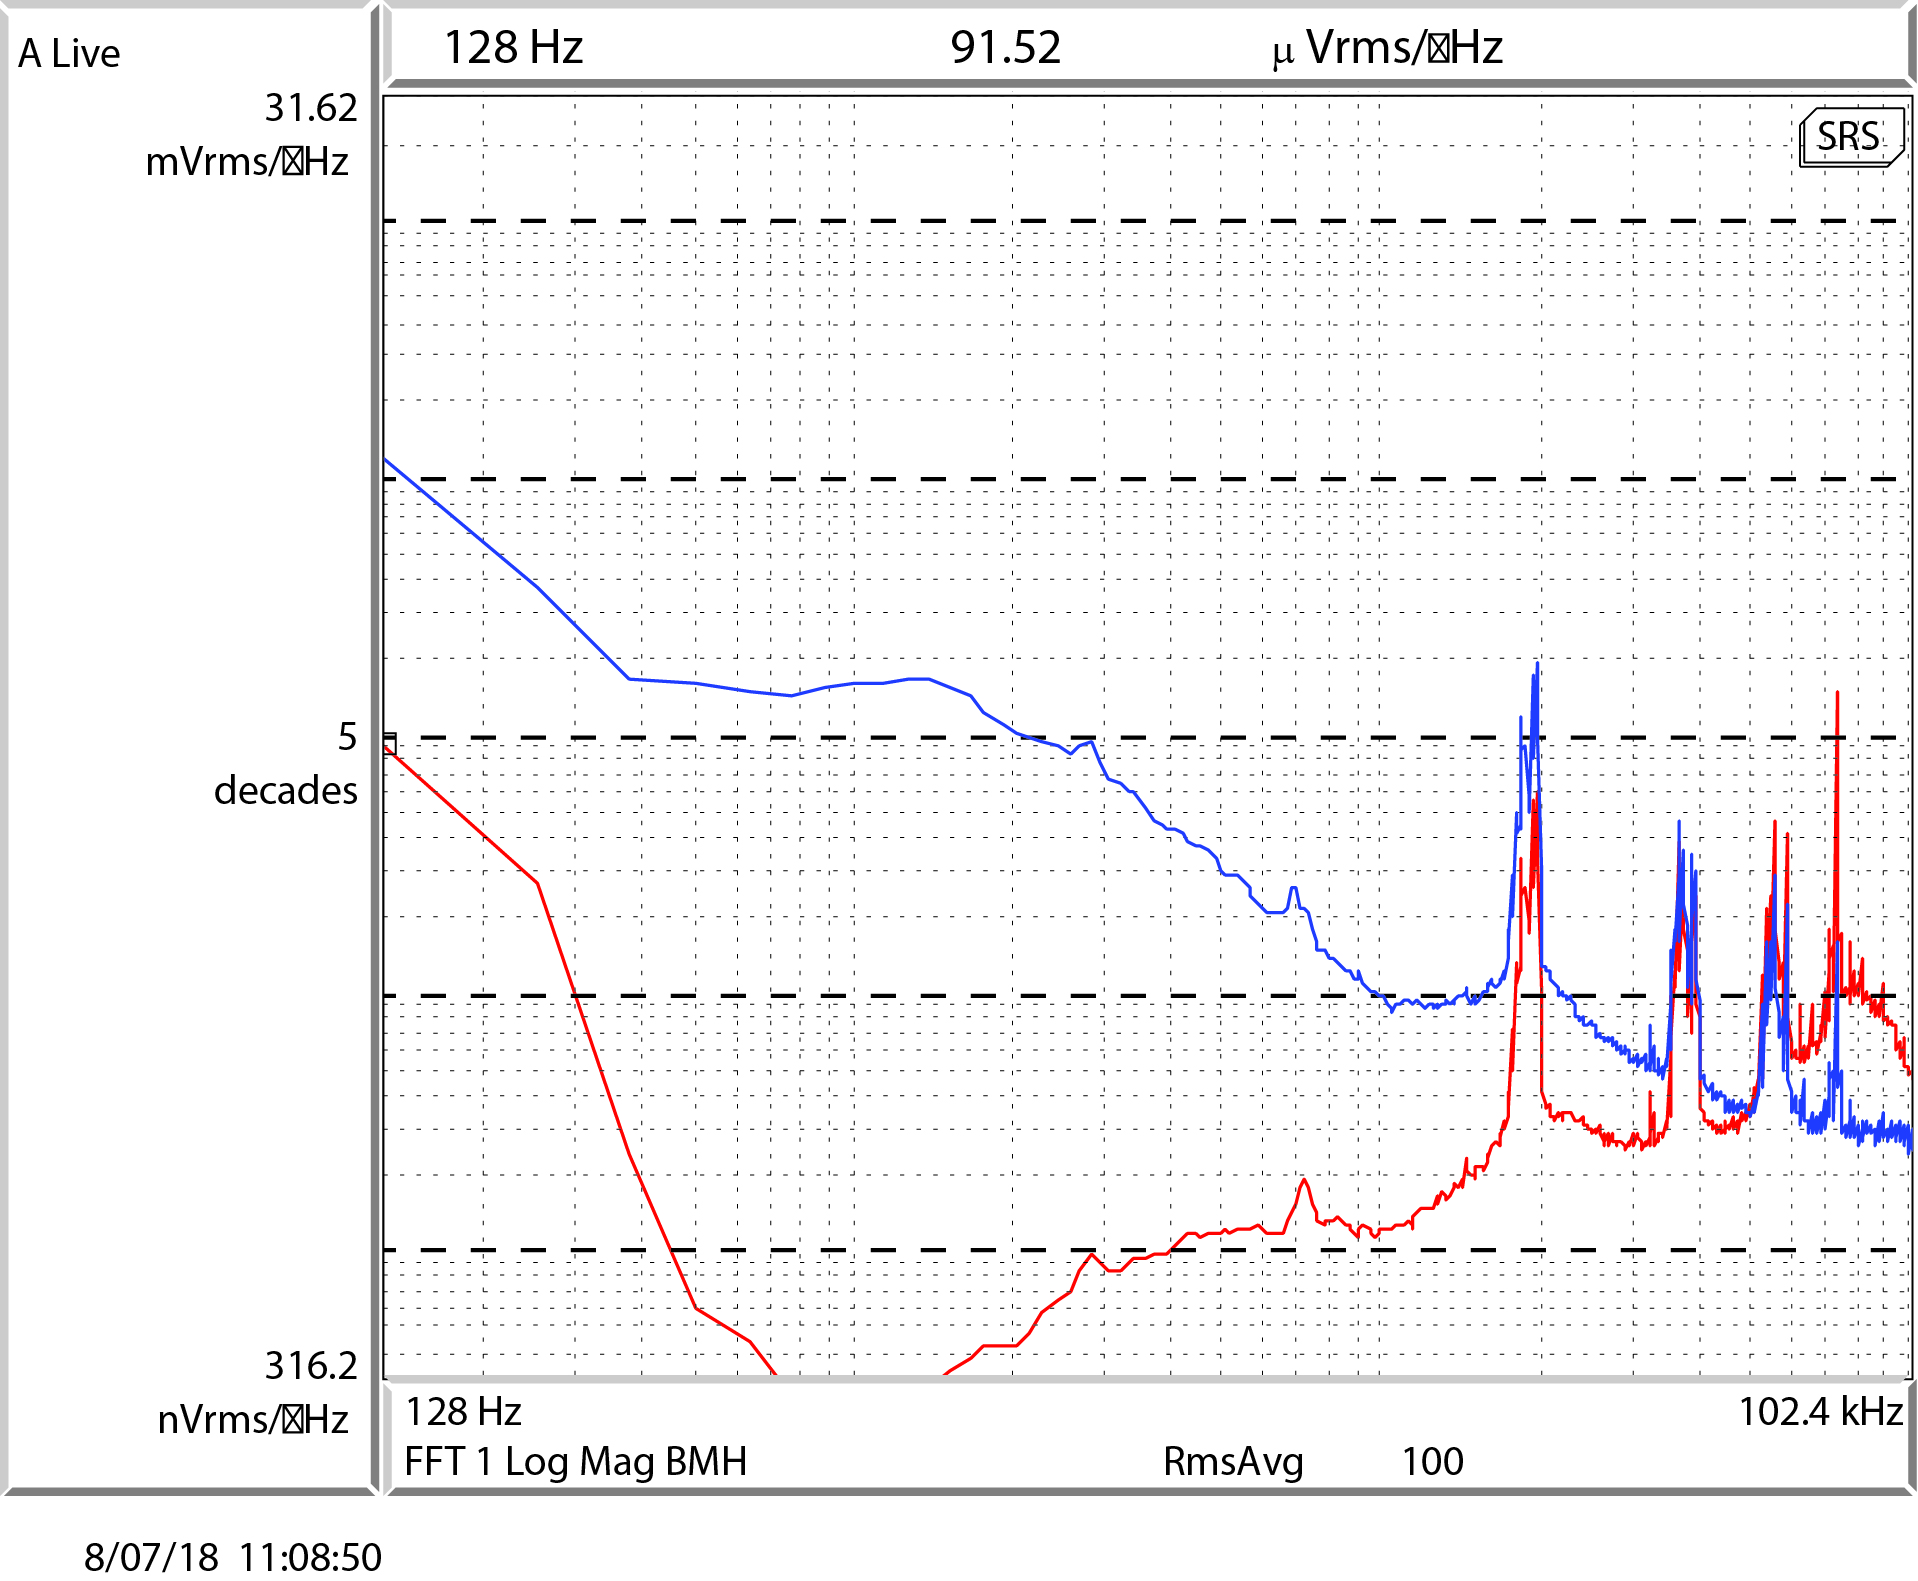
Earlier today we had difficulties closing the AS72 PIT loops for BS and SRM. At the same time we also noticed that the POP18 was much noisier than what we had on the past Saturday. The previously used AS36 signal also showed large offsets in PIT locking point (we tried to close the AS36_I -> SRM loop once using the o2 settings and once it was closed the POP90 started to increase).
We then realized that the whole IFO plane drifted in pitch, and our Saturday locking point for PRM (i.e. offsets in ASC POP A QPD) was no more good. After adjusting the PIT offset in ASC-POP_A_PIT_OFFSET from -0.85 (Saturday value) to -0.96 (new value), the POP18 became much cleaner and the AS72 worked again. However, now we are on the edge of the POP QPD. If the drift continues at the current pace, we will soon lose our error signal for PRM. We might need to walk the whole IFO alignment to compensate for this drift.
This issue was only in pitch, for yaw no significant drift was noticed. The AS72 for yaw also seemed to be pretty robust (as the sensing matrices measured at different times were pretty consistent for yaw).
To make the things a bit more robust, we also did the following modifications:
1. When first engaging the BS loops in DRMI+ALS, we used the AS_B_45_Q signal which was a true wavefront sensor signal and thus was more robust than AS72. The SRM was directly locked with AS72.
2. For the AS72 sensing matrix, we modified it to the following:
| PIT | AS_A_72_Q | AS_B_72_Q |
| BS | 1500 | 0 |
| SRM | 0 | 500 |
| YAW | ||
| BS | 0 | 750 |
| SRM | -300 | 150 |
For PIT this matrix did not well decouple the two DOFs, yet the signals we used were relatively robust. We need to have some gain hierarchy here. For YAW the matrix was consistent with what we had on Saturday.
3. After BS zeroed AS_45 signal, we adaptively adjust the AS72 phase so that the DC power is phased into I-phase. This is currently done in the DRMI guardian ENGAGE_DRMI_ASC state. If people don't think this is the most elegant place to do the adaptive adjustment, we can think about other places to do it.
4. After the phase adjustment, we transition the BS signal to AS72 for CARM offset reduction.
=====================================================================
The above procedure was put into guardian. I tested it twice by directly calling the guardian to engage the loops (before adding the adaptive phase adjustment part). It succeeded once. The other time it failed at the input part. It was probably because the PRM started from a place too far away from its locking point and the PRC1 loop was not fast enough to keep up with the INP1 and PRC2 ones.
After adding in the adaptive phasing, I could not relocked the IFO because the ALS_YARM complained about fiber polarization and I do not know where to adjust it. Nonetheless I tried it once in the DRMI only state (no arms). It seemed fine to directly calling the ENGAGE_DRMI_ASC guardian state to lock the ASC loops.


For the TCS team.
I ran the ring_heater_schedule.py scripts for both ITMX and ITMY after the ALS_Y stopped working.
The settings were
./ring_heater_schedule.py ITMX -s now -d 0.2 -p 2.0
and similarly for ITMY. This is slightly different from what TVo suggested (lower power with shorter heating time) as I was concerned if the ITMs can cooled down sufficiently by the coming morning.
For X it finished at GPS 1217758107, and for Y it finished at 1217758157. The powers have backed to 0.