We kept losing our YARM alignment recently on the timescale of a day. It drifts so much that we need to realign the YARM by hand almost everyday.
To investigate this issue, we looked at the osem signals at two different but adjacent days with the arms locked in green.
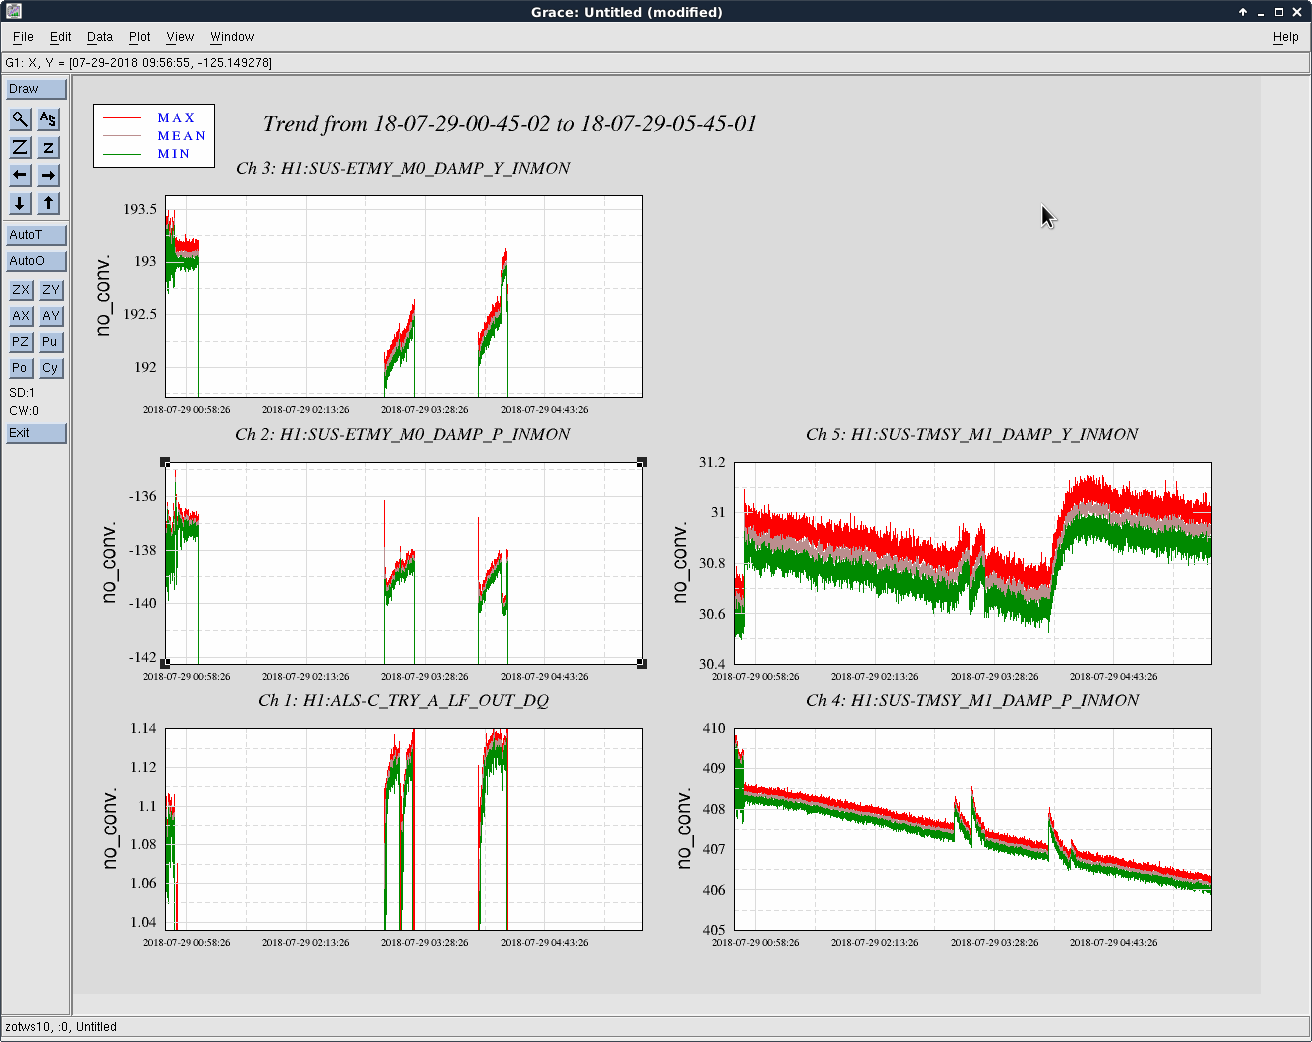
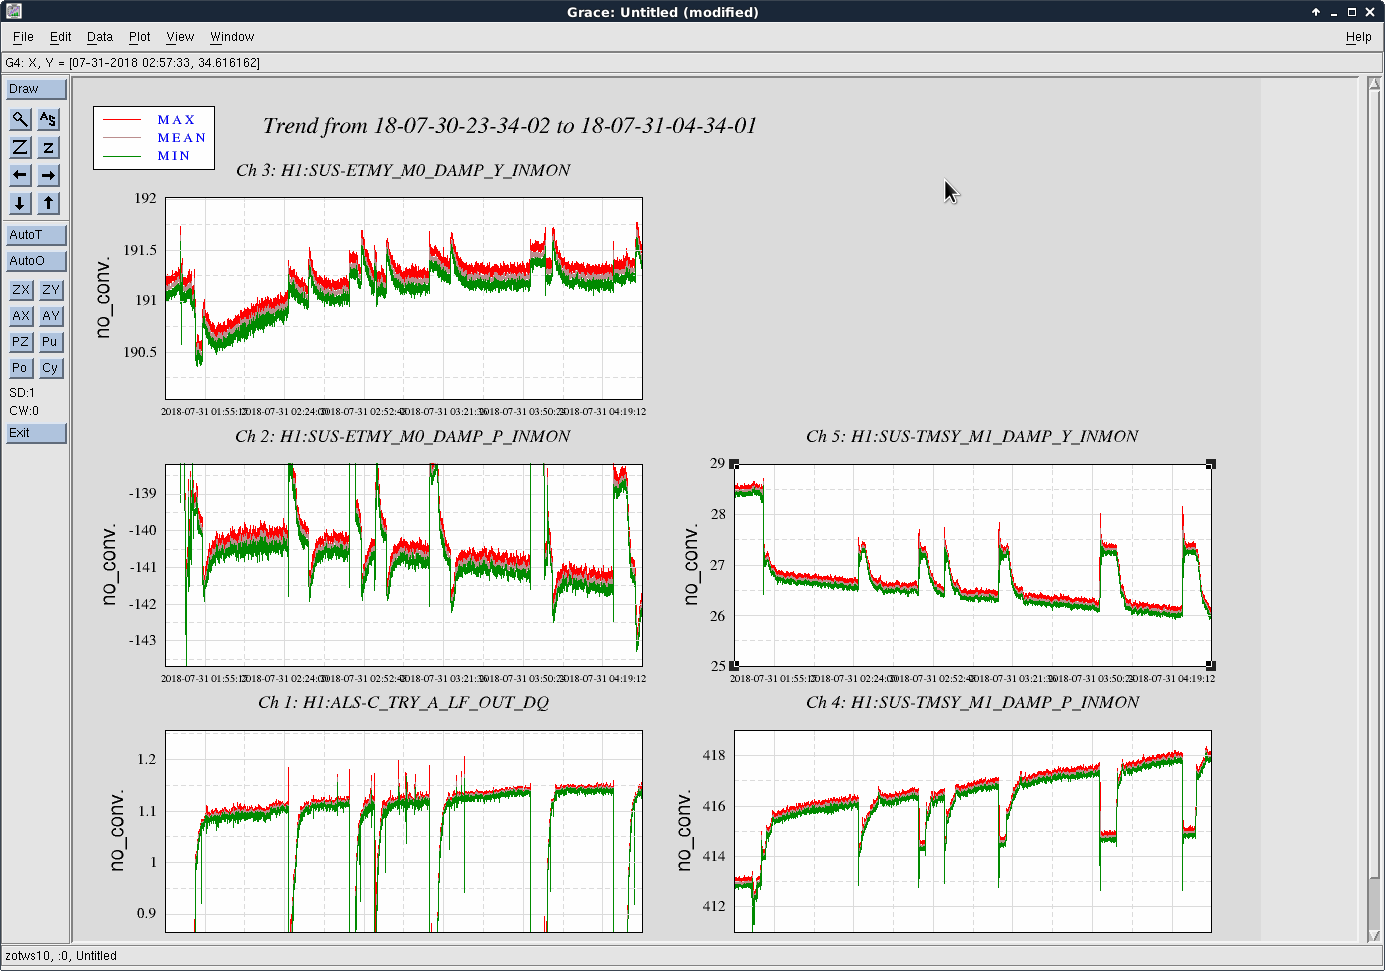
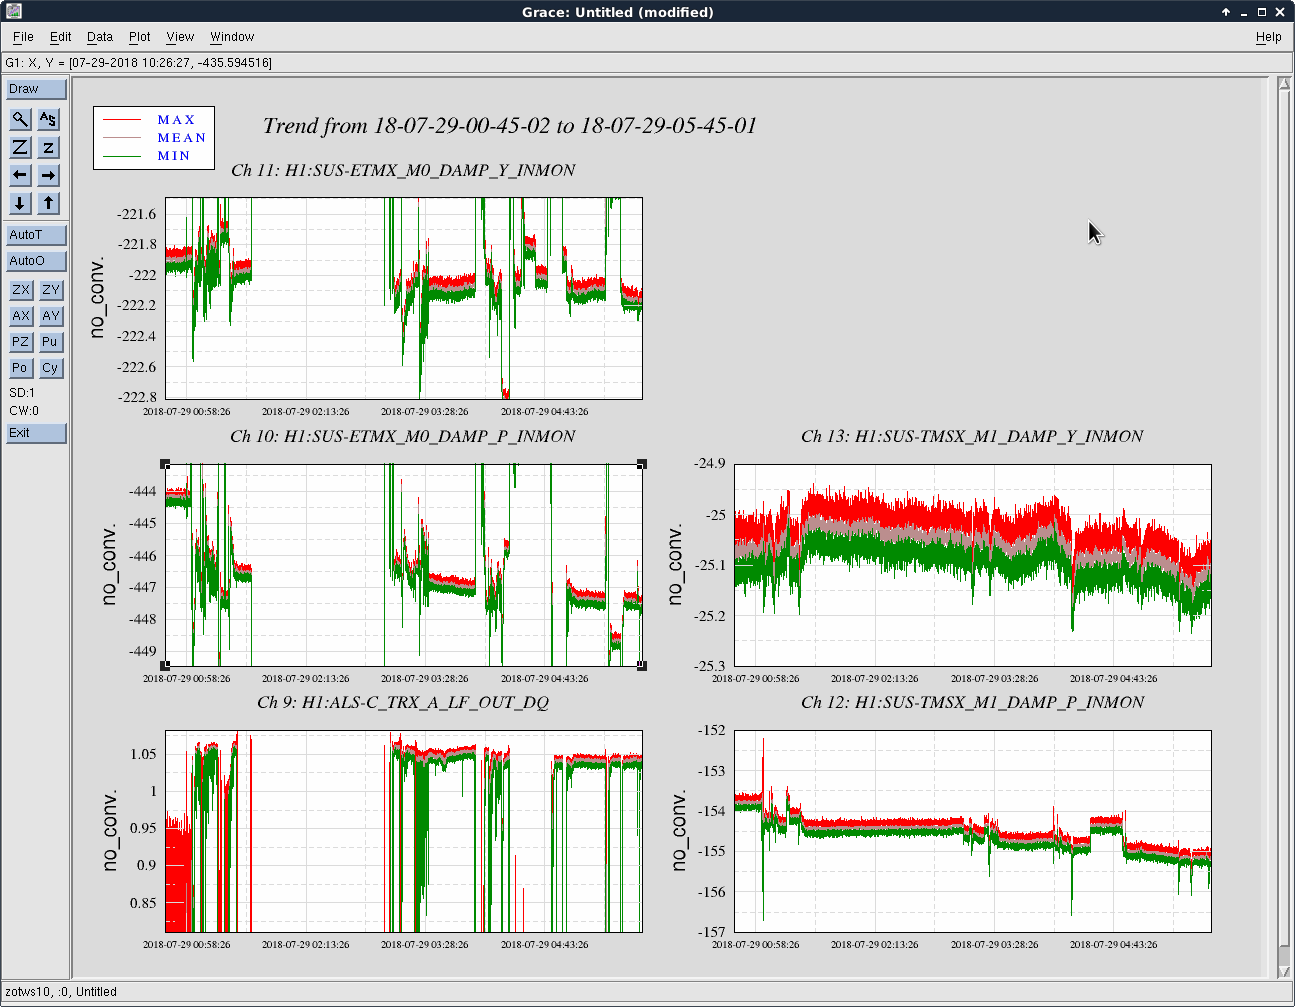
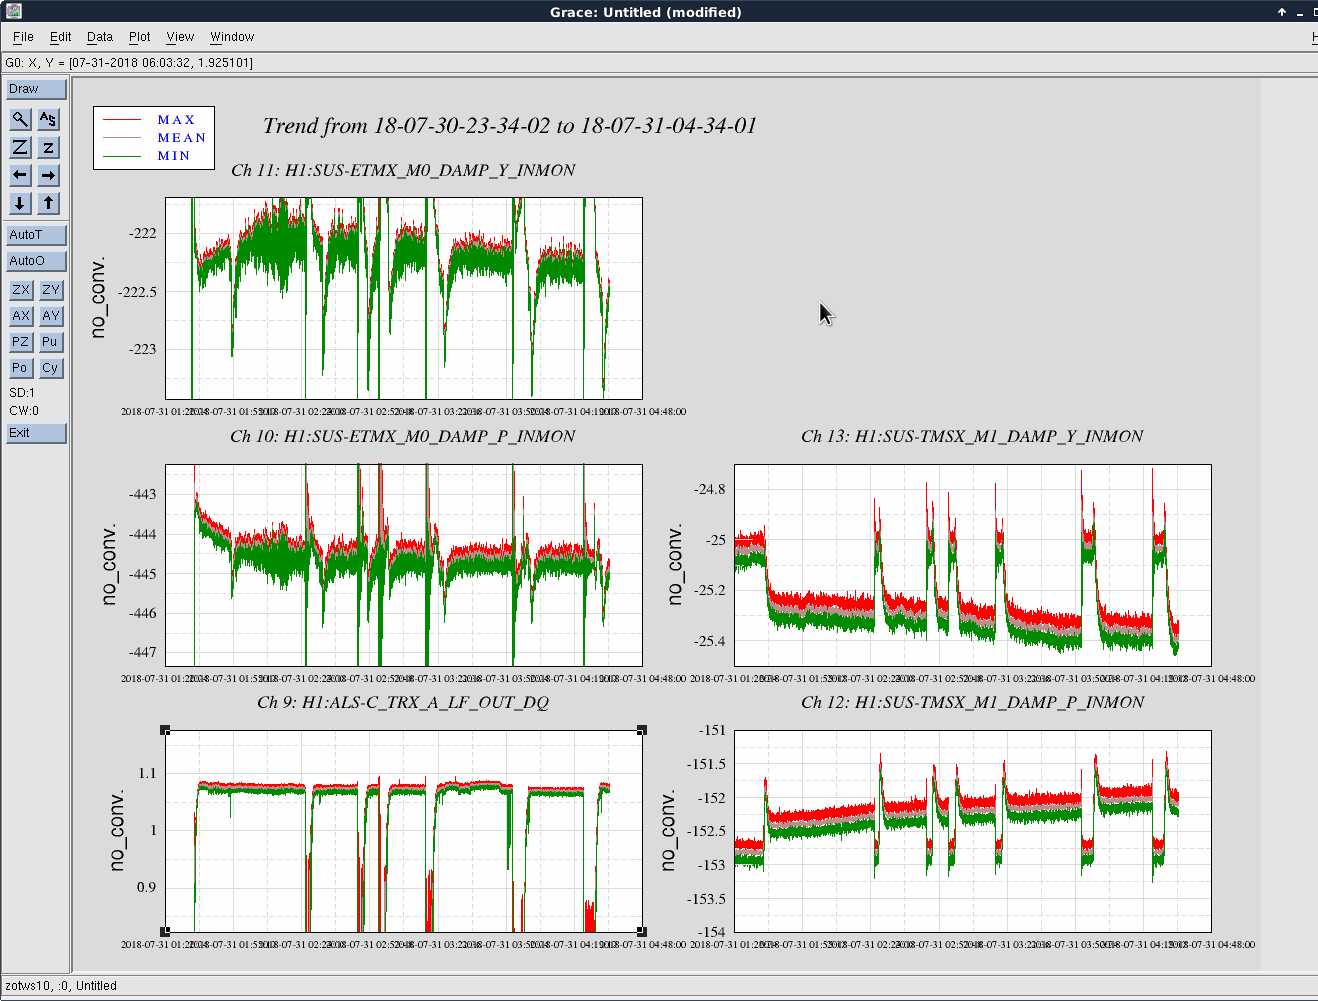
The first and second plots showed the comparison between ETMY/TMSY at the two days, and the third and forth plots showed the similar things for X.
We see that the locking point of TMSY drifted by 5 urad in P, and 10 urad in Y. As a comparison, for TMSX the drift was 2 urad in P, and < 0.5 urad in Y. The TMSY seemed to be drift in Y significantly more than TMSX.
The drift in ETMX/Y seemed comparable at 2-3 urad level.
===================================
Also currently at 01:40:00, Aug 2nd UTC, we also have both arms locked in green. The top mass (M0) osem says that ETMY P = -154, Y = 189, TMSY P = 435, Y = 21. The pitch values were significantly different then the ones we have two days ago. For X, ETMX P = -448, Y = -222, TMSX P= -151, Y=-25, similar to what we had in the past days.
Sheila, Jenne, Gabriele, Georgia, Craig, Hang
We locked DRMI on 3F with the arms controlled by ALS.
The first 3 attachments are the OLGTFs measured with DRMI locked on 1F with the arms, we kept the gains that were in guardian for PRCL and MICH and lowered the SRCL gain by a factor of 2.5 (from -45 to -18).
We transitioned to 3F with only minor issues (we added a path in the guardian to allow us to skip the DRMI ASC for now). The next three screenshots are the DRMI 3F OLG measurements, we didn't adjust any of the loop gains. We did retune the 27I->SRCL input matrix element to cancel a PRCL excitation in the SRCL error signal. We also added a 27I matrix element to the MICH input matrix to cancel the PRCL excitation in the MICH signal. (We had previously not used this).
Kenneth Rainer Corley, Dave Barker Earlier today we went to CERX, CERY, and MSR to perform TDR length measurements on some 1PPS cables used for the timing diagnostic system (to compare our timing system's signal to independent watchdog clocks). **This will have NO IMPACT on anything outside of timing diagnostics.** The four affected timing diagnostic channels will have outages in their signals lasting a few minutes: H1:SYS-TIMING_C_MA_A_PORT_2_SLAVE_CFC_TIMEDIFF_2 H1:SYS-TIMING_C_MA_A_PORT_2_SLAVE_CFC_TIMEDIFF_3 H1:SYS-TIMING_Y_FO_A_PORT_9_SLAVE_CFC_TIMEDIFF_3 H1:SYS-TIMING_X_FO_A_PORT_9_SLAVE_CFC_TIMEDIFF_3 The disconnected/measured cables were the CNS II diagnostic GPS clocks at CERX/Y, the diagnostic symmetricom GPS clock at MSR, and the NTP server in MSR.
For those who aren't Jedi-level 9: TDR = Time Domain Reflectometer.
I sprayed helium around the areas of interest on IP12 today and again, like yesterday, experienced a response on the leak detector, albeit, a delayed response. This seems like some sort of cross-talk to a remote leak or, perhaps, permeation is taking place. The signal falls off when the locally mounted turbo is isolated implying that IP12 is the source of helium. Even so, I went ahead and energized the HV while the turbo was still valved-in followed by valving-out the turbo after the initial liberation of gas had been pumped away. I monitored the ion pump controller (GammaVacuum LPCe) while the HV "slowly" ramped up to 5,800 volts. The current/pressure is higher than I would have expected. Perhaps this can be explained by the fact that it has only had ~4 hours of turbo pumping (10 L/s net) since having been vented (dry N2) and installed (exposed to room air for "hours"). Also, the controller displayed "High Voltage not Detected" a couple of times during the ramp up and the HV had to be re-enabled in order to get this message to clear. I suspect that this could be due to a poor grounding of one of the two SHV connectors at the pump end as neither connector has both mounting screws (threaded hole galled with broken-off screw).
I'll continue tomorrow - coordinating with the commissioners.
16:00 Nutsinee to ISCT6
16:30 Gerardo to EX
17:00 Kyle to EX
17:15 Dave and Columbia students to CER to make timing measurements
17:15 Dave and Columbia students to EX
18:15 Travis to LVEA
18:15 TJ Danny to EX to transition to laser hazard
18:15 Nutsinee to HAM6 tables
18:45 Robert to PSL to run make-up air
20:45 Dave and Columbia student to EY
23:45 Robert to electronics room
Sheila, Georgia
This morning when we were trying to check the phasing of ASC-REFL_A_RF9 and ASC-REFL_A_RF9 for the ASC loops, we found something was ringing at ~2 Hz. The 2nd DC centering loop - ASC-DC2 - was ringing and railing RM2.
Sheila and I took pitch and yaw transfer functions, templates here:
/ligo/svncommon/IscSVN/iscmodeling/trunk/ALIGOH1/ASC_loops/Measurements/DC_centering
We found the current filters to be suboptimal, and made and implemented a new filter. The new filter, “ctrl", has a pair of 1.5Hz poles just below the suspension resonance frequency, and a pole at 0.1 Hz. This replaces the "1:300" filter.
TJ Massinger, Josh Smith
We followed up alog 42816, which detailed switching off alignment control to the M2/M3 stages of MC2 (FRS ticket 11040).
Looking at a 3 hour window surrounding when the alignment control was switched off, we picked two times before and after the switch in which the IMC state seemed consistent. We plotted ASDs of IMC-F, IMC-L, and IMC-WFS_{A/B}_I_{PIT/YAW} before and after the switch to look for evidence that IMC performance was affected by switching off alignment control to the M2 and M3 stages of MC2.
Attachment 1 shows the IMC input power, MC2 TRANS, and IM4 TRANS trended over 3 hours, showing consistent power levels.
Attachments 2 and 3 show the alignment switches being disengaged and the pitch and yaw inputs to the relevant drivealign matrix going to zero.
Attachments 4 and 5 show ASDs of IMC-F and IMC-L before (17:00 UTC, 17:30 UTC) and after (19:00 UTC, 19:30 UTC) switching off alignment control.
Attachments 6, 7, 8, and 9 show ASDs of WFS PIT/YAW readouts before and after switching off alignment control.
There don't seem to be any systematic changes to the above ASDs or IMC power levels that indicate performance changed after switching off alignment control to the M2 and M3 stages of MC2.
Oli Patane, Josh Smith, with input from Robert Schofield and others, In O2 there was a somewhat common type of glitches called “scratchy” or “blue mountains” that seem to have been related to the swiss cheese baffles at LHO (and likely also LLO). On May 9, 2017 rubber cork dampers were installed at MCA1 at Hanford to damp the swiss cheese baffle (alog). Here we show that this increased the repetition rate of the bright spots in each scratchy glitch, but decreased how often scratchy glitches happen. We also show that scratchy glitches happen much less often at L1, but roughly match the spots per second rate of H1 pre-damping. For H1, we compared all the H1 Scratchy glitches identified by GravitySpy Machine Learning (using the ligodv-web glitch search tool) from the beginning of O2 to May 9th, to the scratchy glitches identified from that date to the end of O2. Fig. 1 shows a typical H1 scratchy glitch before May 2017 and Fig. 2 shows a typical scratchy glitch after May 2017. The glitches before generally have less bright spots per second; before May the average number of bright spots was 11.6/sec, and after May the average went up to 18.3/sec. Fig. 3 gives a histogram showing the distribution of bright spots per second at H1 before and after the rubber cork dampers were installed. From this plot, there seems to also be a decrease in the number of Scratchy glitches after the dampers were installed. In the five months from December 2016 to May 2017 H1 had at least 195 Scratchy’s, the three months after the installation only had 60 glitches, when (assuming similar conditions) we might have expected ~117. We also investigated scratchy glitches at L1. Fig. 4 shows a typical scratchy glitch at L1. Fig. 5 shows the H1 histogram now including L1. For the entire run, there were only 16 scratchy glitches identified by GravitySpy. Their average bright spots per second was 10.7. This makes sense, considering that rubber cork damping was not installed on the L1 baffle. After O2 the central area of the swiss cheese baffles were removed at L1 and H1. We’re looking forward to seeing whether this eliminates scratchy glitches entirely.
[Jenne, Georgia, Gabriele]
We found the PRMI locking from time to time, and managed to realign it on the fly and acquire a stable lock. Afterwards we aligned the SRM using SRY, and moved on to DRMI.
We can lock DRMI without major problems and tweaked the alignment. POPAIR_B_RF18_I_NORM was as high as ~19 counts, and POPAIR_B_RF90_I_NORM as high as ~7 counts.
We then tuned the MICH, PRCL and SRCL loop gains, by measuring the open loop gain and tuning so that the unity gain frequency is at the maximum phase margin:
Then we checked the phasing of the REFLAIR signals. We drove a PRCL line at 138 Hz, notched it in MICH and SRCL, and tuned REFLAIR_9 demodulation phase to minimize the line in Q. The phase was -17 (deocupling I/Q ~ 10) and we moved it to -17.5 (decoupling I/Q ~ 100).
Similarly we injected a 138 Hz line in SRCL (and notched in MICH and PRCL) and minimized the line in REFLAIR_45_Q. The phase was 80 (decoupling I/Q ~ 12) and we moved it to 84 (decoupling I/Q ~ 100).
Finally, we retuned the REFLAIR_9 element in the LSC matrix, by injecting a line in PRCL, measuring the ratio REFLAIR_9_I / REFLAIR_45_I and tuning the matrix element to cancel the PRCL contribution to the SRCL error signal. The previous value was -5.03, the new value is -5.508.
Retuned phases with DRMI locked with arms, including 3F:
REFLAIR_A_RF9: -21.0
REFLAIR_A_R45: 82.0
REFLAIR_B_R27: -89.0
REFLAIR_B_R135: 115.0
A late post of some of the pictures that Jeff B took for us on Friday. We were curious to see if the cameras that are looking at the ITMs could see the CO2 crosshair alignment lasers. The hope was that we could see how well aligned we were on ITMX so we wouldn't have to heat them up to determine our centering.
So can we see the alignment lasers? No.
We first tried with the ALS unshuttered, but the green would be too dominant. We then shuttered ALS and played with different length expose times with the alignment laser on and off. No luck. Jeff then suggested that we take images of ITMY as well to make sure that it isn't just an atrocious alignment on IX. Same result. The only thing that might be a hint of the alignment laser is a spec of red seen at the top edge and side edge of the test mass that would not be seen when we had the alignment laser off. This could have just been an odd reflection from somewhere else though, since commissioners where working on other parts of the interferometer at the same time.
Pic1 - ITMX with misaligned green, alignment laser on
Pic2 - ITMX, no green, ~60sec exposure, alignment laser on
Pic3 - ITMY, aligned green, alignment laser on
Pic4 - ITMY, no green, ~45sec exposure, alignment laser on
Pic5 - ITMY, no green, ~45sec exposure, alignment laser off
Because I suspected electronics noise in HAM4, Richard and Dave power cycled the HAM45 computer and rack. When I tried to recover the ISI, it still tripped, so I took some open loop measurements. In pretty much all dofs there is a new (at least compared to the original measurements from 2014 that we used to design the controllers) feature at ~52 hz. First attached plot is the open loop measurement for the X dof I took today, the lump at the vertical cursor is the new feature. Second attached plot is the design plot from 2014 This feature is eating up all the phase margin at this frequency, hence the table is unstable. Looking back to my measurement from the November closeout of this chamber, the feature is visible in those tf's as well, but it's kind of small, and there are other features in the neighborhood that are due to HEPI that go away when HEPI is fully unlocked. So far the table is stable with the lower UGF "medium" isolation filters, but we lose some performance between 1-10hz. In order to run for now, we have to pause the SEI_HAM4 guardian and use the ISI and HEPI guardians separately to manage the seismic components in this chamber. I think I have all the data to redesign the loops to accommodate the new feature.
There's also the matter of 10 degrees phase margin...
Ed Marc Daniel
We swapped the ALS PFD again with a tested unit that had its LO TNC/PCB/SMA/SMA/coax/SMA input arrangement replaced by a simple TNC/coax/SMA. Furthermore, the TNC connectors are no longer isolated. This should reduce any crosstalk inside the PFD between the 2 ALS VCOs.
SN of the modified tested spare which was installed Tuesday is S1000756, SN of the chassis that was removed is S1000761.
Round 1 of this work is in this ALOG
This completes WP7740
FRS 11049
After DaveB swapped the BIO card from the I/O chassis, we tested the switching and saw no change in the behavior: switch worked fine with python command and HAM2 failed the switch when attempted by guardian.
After the swap, I isolated the ISI where the gains remained in the SAFE state. The gain/whitening where then switched to the run state (analog gain & whitening) with the COMMANDS python script; this switch worked fine. I then modified the guardian code for HAM2 to do the switching and changed the requested state to damped and the the platform trip immediately when guardian changed the gain & whitening filters. Likewise when going back to isolated, the platform tripped when the filters were changed.
Bottom line, no change in behavior with the new BIO card.
BS and ITMY have some elevated ST1 signals, not high enough to be a problem, but otherwise nothing looks out of the ordinary.
[Daniel, Sheila, Craig, Hang, Jenne]
We think that we have found our problem with the apparent PRC recycling gains.
All of our calculations were using the expected modulation depths, as set in May this year (alog 41889 for 45MHz, earlier alog for 9MHz). But, since the modulation RF depths were hard-coded in the DOWN state of ISC_LOCK (because we change them as we go to NomLowNoise, and want to always make sure we start the acquisition sequence with the same value), when we first ran the DOWN state on July 9th (alog 42829) we went back to the old modulation depth settings. So, since that time, our modulation depths have been lower than they should have been. 45MHz has been 4dB too low, and 9MHz has been 7dB too low.
I have now put the new, correct numbers into the lscparams of the guardian. I think we're chalking this up to forgetting to update the guardian, since we have been changing so many things before having the IFO back. Daniel had set the correct values in SDF, so if we had looked there, it's possible we would have found this. But, since so many things are in flux as we bring the IFO back online, it's hard to differentiate at a quick glance which SDF changes are meaningful and which aren't.
OMC scans are in progress to check that our modulation depths are now closer to what we expected, and we're hopeful that fixing these low modulation depths will help other locking difficulties that we've been dealing with lately (including having to increase a bunch of digital gains to compensate for lower sideband signals).
We reran the single bounce OMC scan now that the RF power levels are back to where they ought to be.Results
Peak Power in OMC DCPD Sum milliamps Carrier = 13.656 mA 9 MHz = 0.159 mA 45 MHz = 0.223 mA Estimated Current Modulation Depths Γ9 = 0.215 rad Γ45 = 0.255 radThe old modulation depths from the month of July wereΓ9 = 0.12 rad Γ45 = 0.20 radas seen from our previous single bounce OMC scan.
Mostly a note to self: When aligning SRY, AS_C pointing isn't trust-worthy. AS_A_SUM values got to about 5500 cts when the pointing on AS_C was far from center, from 4600 cts when AS_C was centered. I did SRY with only SRC1 loops closed, and moved SR2 to get better buildup. We should pico AS_C.
We repeated the PRMI-locked OMC scan. Power recycling gain is much lower... Measured 45 MHz Power Recycling Gain with Arms ~ 9 Modeled 45 MHz Power Recycling Gain with Arms = 91Single Bounce OMC Scan
From our single bounce OMC scan today (see comment above for plot), the 45 MHz sidebands are 7 times more powerful than our July 25th scan:Today's Single Bounce OMC DCPD Sum 45 MHz peaks = 0.22 mA July 25 Single Bounce OMC DCPD Sum 45 MHz peaks = 0.03 mAThese sidebands were well-balanced, so I report them together.PRMI with Arms Scan
However, our PRMI-locked, Arms locked and off resonance OMC scan shows only 2.5 times more power: (see plot 1, all measurements referenced to OMC DCPD Sum milliamps)Today's PRMI with Arms -45 MHz peak = 1.86 mA Today's PRMI with Arms +45 MHz peak = 1.25 mA July 25 PRMI No Arms -45 MHz peak = 0.78 mA July 25 PRMI No Arms +45 MHz peak = 0.67 mAThis is super weird because we would expect to see 14 times as much power in 45 MHz with arms locked: the factor of 7 from the sidebands, and a factor of 2 from the extra reflectivity of the arms. The 45 MHz sidebands are even more unbalanced than before: 59% of the power is in the lower sideband. I plotted the July 25 and today's PRMI scan on top of one another in plot 2, to see if we could see anything obvious, or we weren't actually looking at the 45 MHz sidebands. There wasn't anything obvious to me...PRMI No Arms Scan
I unlocked the arms and misaligned the ETMs and redid the scan. (Plot 3) When I unlocked the arms, the POPAIR_B_RF18 and RF90 powers both fell to 60% of their "with arms" power when I relocked with the same alignment. We expect half the power, so this is at least close.Today's PRMI No Arms -45 MHz peak = 1.10 mA Today's PRMI No Arms +45 MHz peak = 0.76 mAThis gives us an abysmal transmission gain of 1.67 when compared to PRMI No Arms from before. I averaged the two sidebands' calculated PRMI gain together: Measured 45 MHz Power Recycling Gain No Arms ~ 5.3 Modeled 45 MHz Power Recycling Gain No Arms = 48PRMI Model with Arms
The measured PRMI gains of 9 come from the same PRMI math as before, only with arms we have to use a different Michelson reflectivity/transmission and flip a bunch of signs. The model of PRMI with Arms parameters are shown below. PRMI Sideband Gain with Arms:Michelson Transmission:
where
![]()
, including ITM losses of 60ppm
![]()
![]()
![]()
Hang and I had a look and it turns out the single bounce OMC scan was done with 9.5 watts input power, while the PRMI-locked scans were done with 1.9 watts input power. This factor of 5 makes our scan results believable: Measured 45 MHz Power Recycling Gain with Arms ~ 44 Modeled 45 MHz Power Recycling Gain with Arms = 91 Measured 45 MHz Power Recycling Gain No Arms ~ 27 Modeled 45 MHz Power Recycling Gain No Arms = 48
Corey, Georgia, Patrick 3 sets of charge measurements have been run for ETMX and ETMY. We have left the IMC_LOCK guardian in AUTO and OFFLINE, the SEI_CONF guardian at SC_OFF_NOBRSXY, and the ALIGN_IFO guardian in AUTO and DOWN. Georgia added step 4a "LHO temporary additional charge measurements in preparation for ion pump/chevron baffle test" to the wiki which we also ran. We tried to run the analyze scripts, but ran into errors that will have to be addressed later.
I have started to analyse the data that we took this morning in the second ETMX measurement, which is a pit-and-yaw oplev measurement as described in alog-42572. The analysis script is in /opt/rtcds/userapps/trunk/sus/common/scripts/quad/opLevChargeMeasurements/analyserChargeMeas.m and the timestamps for this mornings various driven measurements is in rec_LHO/ETMX_0_Hz_GPS_1217087900.txt
The actuation strength numbers are still off by an order of magnitude which I've not managed to reconcile with previous measurements yet.
After discussions with Sheila I added an additional step in the measurement where the ESD signal quadrants are driven longitudinally, giving a measure of the Beta+Beta_2 parameters as driven by the signal electrodes in addition to that driven by the bias electrode. We expect these results to be similar, though we've looked at the ESD patterns and noted that the ESD bias electrode is not symmetric, the bias electrode passes closest to the bump stops (relevant if charge has been deposited after a bump stop collision), and also that the lower quadrant signal electrodes are delivered to the bottom of the optic around the barrel, which possibly has an impact on actuation strength.
Results
| Pitch | Yaw | |
| alpha [N/V^2] | 1.3e-11 | 1.2e-11 |
| gamma [N/V^2] | 1.4e-11 | 1.4e-11 |
| beta-beta2 [N/V] | 1.7e-9 | 1.3e-9 |
| (beta+beta2)|sig [N/V] | 1.2e-10 | |
| (beta+beta2)|bias [N/V] | 2.5e-9 | |
| Veff [V] | 31 | 26 |
Something interesting: when driving the signal electrodes longitudinally there is good coherence with optical lever yaw (.89) but poor coherence with pitch (0.25), while when driving the bias there is good coherence with pitch (.98) and poor coherence with yaw (0.47). I removed results these poor-coherence-measurements from the results matrix above to avoid confusion. There is also strong coherence (~0.9) between optical lever pitch and the excitation when yaw is driven, and vice versa.
We'll try and take these measurements and the usual quadrant-by-quadrant measurements daily in the lead up to the ion-pump revalving in.
Patrick, Georgia
We ran the ETMX charge measurements again this morning.
We only ran 2 repetitions of the old measurement today to minimise inconvenience for other commissioning activities. Results attached
Attachment 1: a single measurement, showing urad of PIT and YAW (as measured on the optical lever) as a function of bias voltage, for a drive to each ESD quadrant. Can also be compared with these measurements of ITMX and ITMY, and this previous measurement of ETMX (which is shown in the second attachment).
Attachment 2: The trend of V_eff over the last few weeks, now with July 31 and August 1 data.
I reran these this morning as well and got the same results as listed in the table above to within 1 decimal point.