WP12709 Replace EX Dolphin IX S600 Switch
Jonathan, Erik, EJ, Dave:
The Dolphin IX switch at EX was damaged by the 06apr2025 power glitch, it continued to function as a switch but its nework interface stopped working. This meant we couldn't fence a particular EX front end from the Dolphin fabric by disabling its switch port via the network interface. Instead we were using the IPC_PAUSE function of the IOP models. Also because the RCG needs to talk over the network to a swich on startup, Erik configured EX frontends to control an unused port on the EY switch.
This morning Erik replaced the broken h1rfmfecex0 with a good spare. The temporary control-EY-switch-because-EX-is-broken change was removed.
Before this work the EX SWWD was bypassed on h1iopseiex and h1cdsrfm was powered down.
During the startup of the new switch, the IOP models for SUS and ISC were time glitched putting them into a DACKILL state. All models on h1susex and h1iscex were restarted to recover from this.
Several minutes later h1susex spontaneously crashed, requiring a reboot. Everything as been stable from this point onwards.
WP12687 Add STANDDOWN EPICS channels to DAQ
Dave:
I added a new H1EPICS_STANDDOWN.ini to the DAQ, it was installed as part of today's DAQ restart.
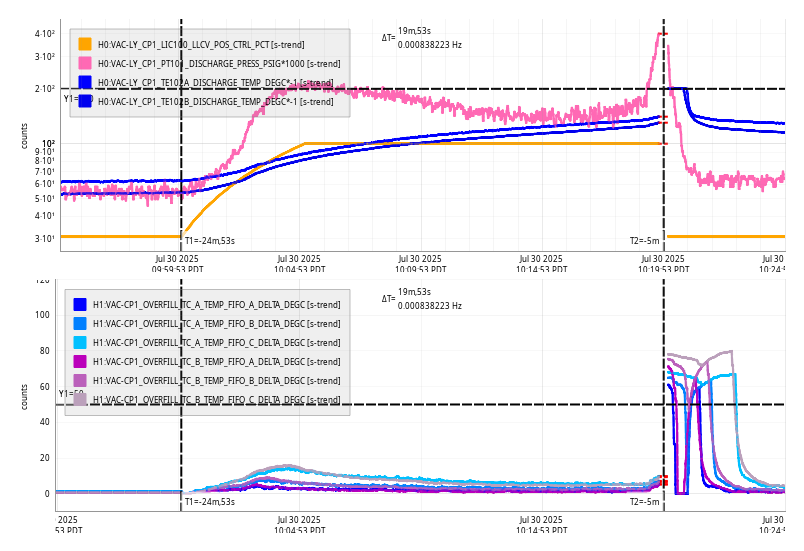
WP12719 Add two FCES Ion Pumps and One Gauge To Vacuum Controls
Gerardo, Janos, Patrick, Dave
Patrick modifed h0vacly Beckhoff to read out two new FCES Ion Pumps and a new Gauge.
The new H0EPICS_VACLY.ini was added to the DAQ, requiring a EDC+DAQ retstart.
WP12689 Add SUS SR3/PR3 Fast Channels To DAQ
Jeff, Oli, Brian, Edgard, Dave:
New h1sussr3 and h1suspr3 models (HLTS suspensions) were installed this morning. Each model added two 512Hz fast channels to the DAQ. Renaming of subsystem parts resulted in the renaming of many fast and slow DAQ channels. A summary of the changes:
In sus/common/models three files were changed (svn version numbers shown):
HLTS_MASTER_W_EST.mdl production=r31259 new=32426
SIXOSEM_T_STAGE_MASTER_W_EST.mdl production=r31287 new=32426
ESTIMATOR_PARTS.mdl production=r31241 new=32426
HLTS_MASTER_W_EST.mdl:
only change is to the DAQ_Channels list, added two chans M1_ADD_[P,Y]_TOTAL
SIXOSEM_T_STAGE_MASTER_W_EST.mdl:
At top level, change the names of the two ESTIMATOR_HXTS_M1_ONLY blocks:
PIT -> EST_P
YAW -> EST_Y
Inside the ADD block:
Add two testpoints P_TOTAL, Y_TOTAL (referenced by HLTS mdl)
ESTIMATOR_PARTS.mdl:
Rename block EST -> FUSION
Rename filtermodule DAMP_EST -> DAMP_FUSION
Rename epicspart DAMP_SIGMON -> OUT_DRIVEMON
Rename testpoint DAMP_SIG -> OUT_DRIVE
DAQ_Channels list changed according to the above renames.
DAQ Changes:
This results in a large number of DAQ changes for SR3 and PR3. For each model:
+496 slow chans, -496 slow chans (rename of 496 channels).
+64 fast chans, -62 fast chans (add 2 chans, rename 62 chans).
DAQ Restart
Jonathan, Dave:
The DAQ was restarted for several changes:
New SR3 and PR3 INI, fast and slow channel renames, addition of 512Hz fast channels.
New H0EPICS_VACLY.ini, adding Ion Pumps and Gauge to EDC.
New H1EPICS_STANDDOWN.ini, adding ifo standdown channels to EDC.
This was a full EDC DAQ restart. Procedure was:
stop TW0 and TW1, then restart EDC
restart DAQ 0-leg
restart DAQ 1-leg
As usual GDS1 needed a second restart, but unusual FW1 spontaneously restarted itself after have ran for 55 minutes, an uncommon late restart.
Jonathan tested new FW2 code which sets the run number in one place and propagates it to the various frame types.