Daniel, Thomas, Stefan
- We added a button to the TCS-HWS medm screen that plots the contour difference between a reference time and the current time. For now the reference time is taken from /opt/rtcds/userapps/release/tcs/common/medm/referencetimeITMY.txt
- We really want a streaming version of this working, but the current streaming scripts are inoperational (and some of them interfere with the EPICS logging)
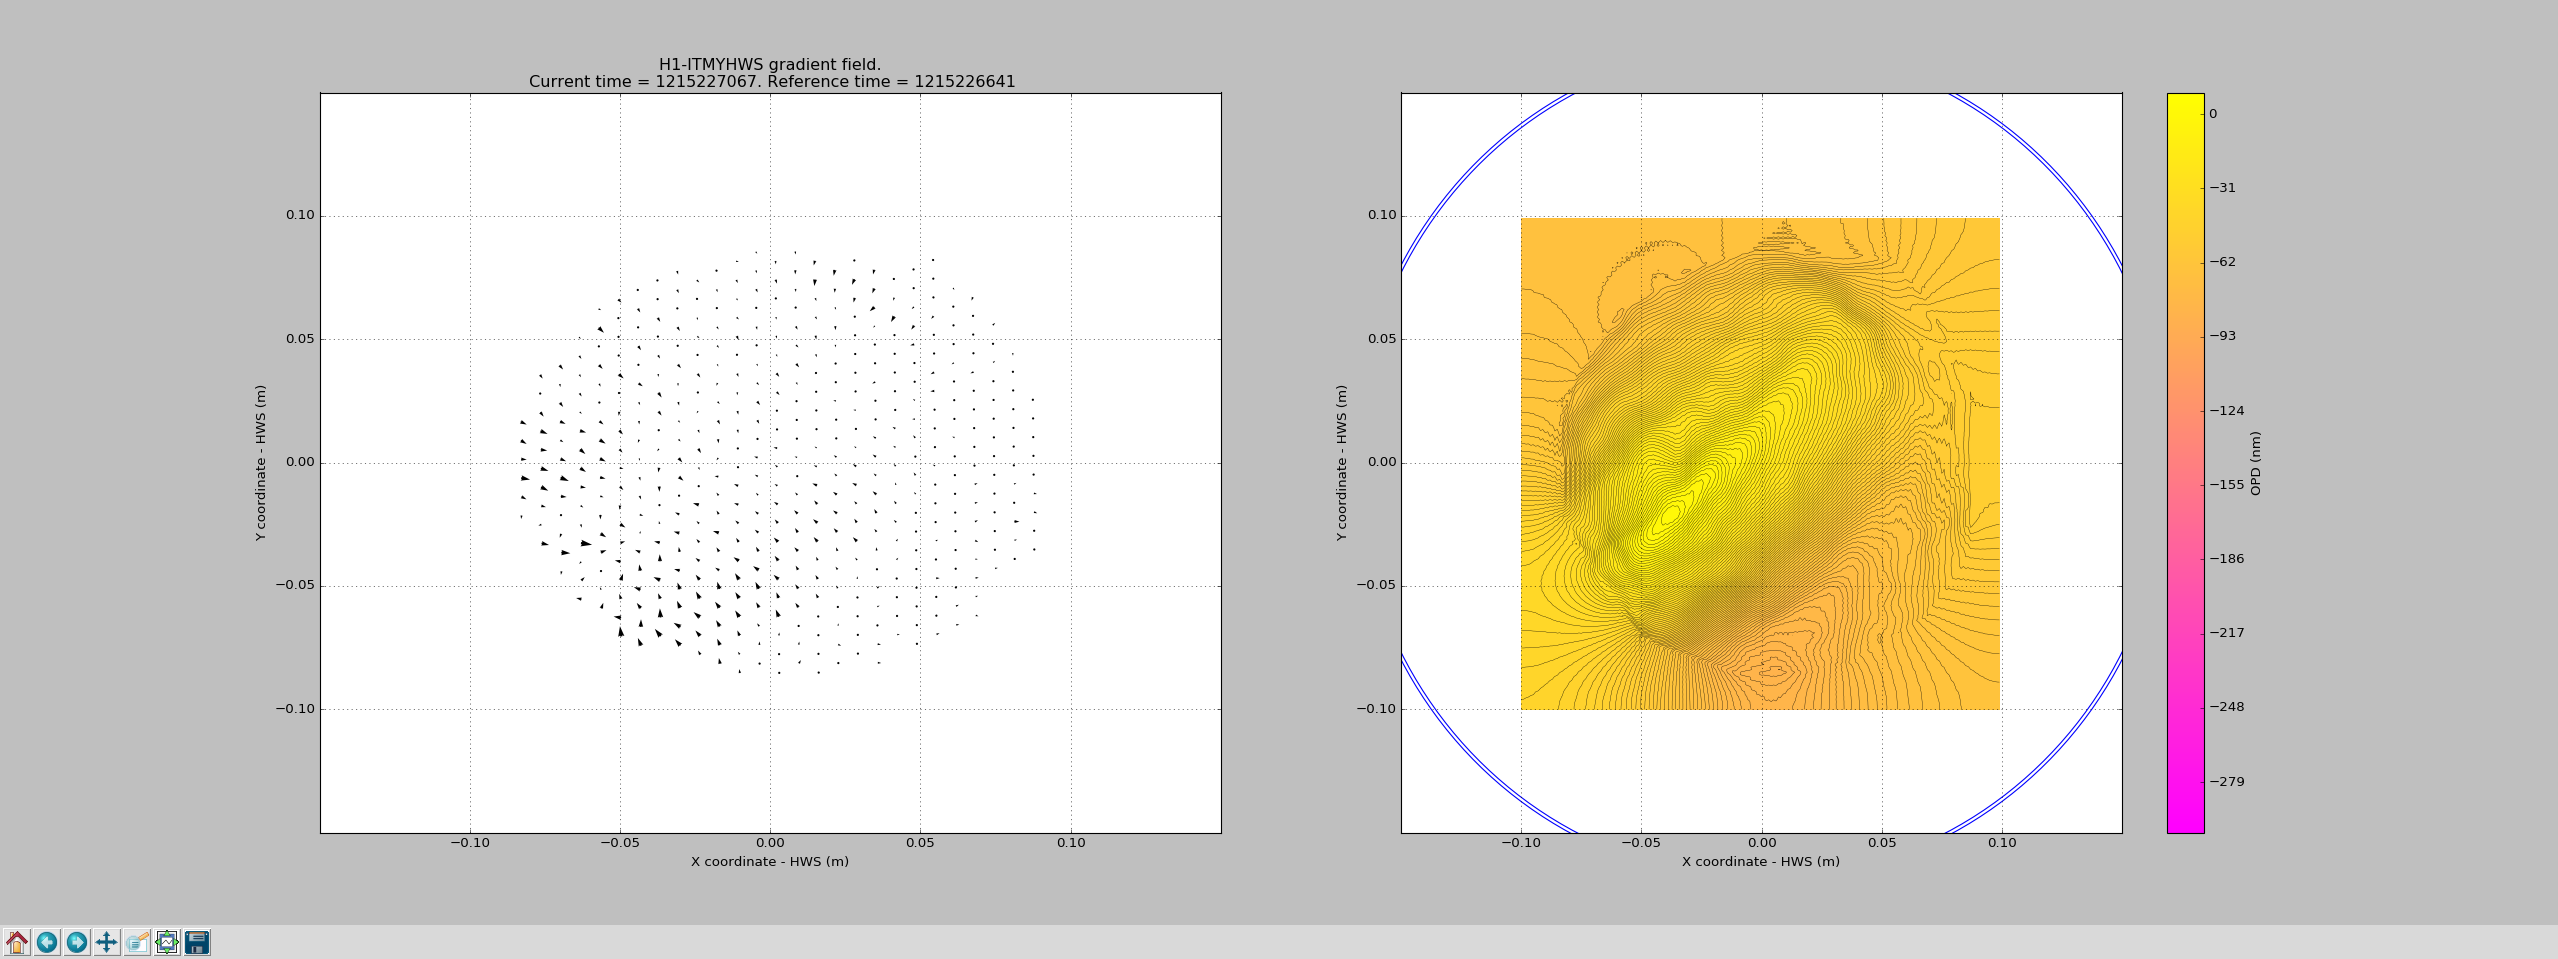
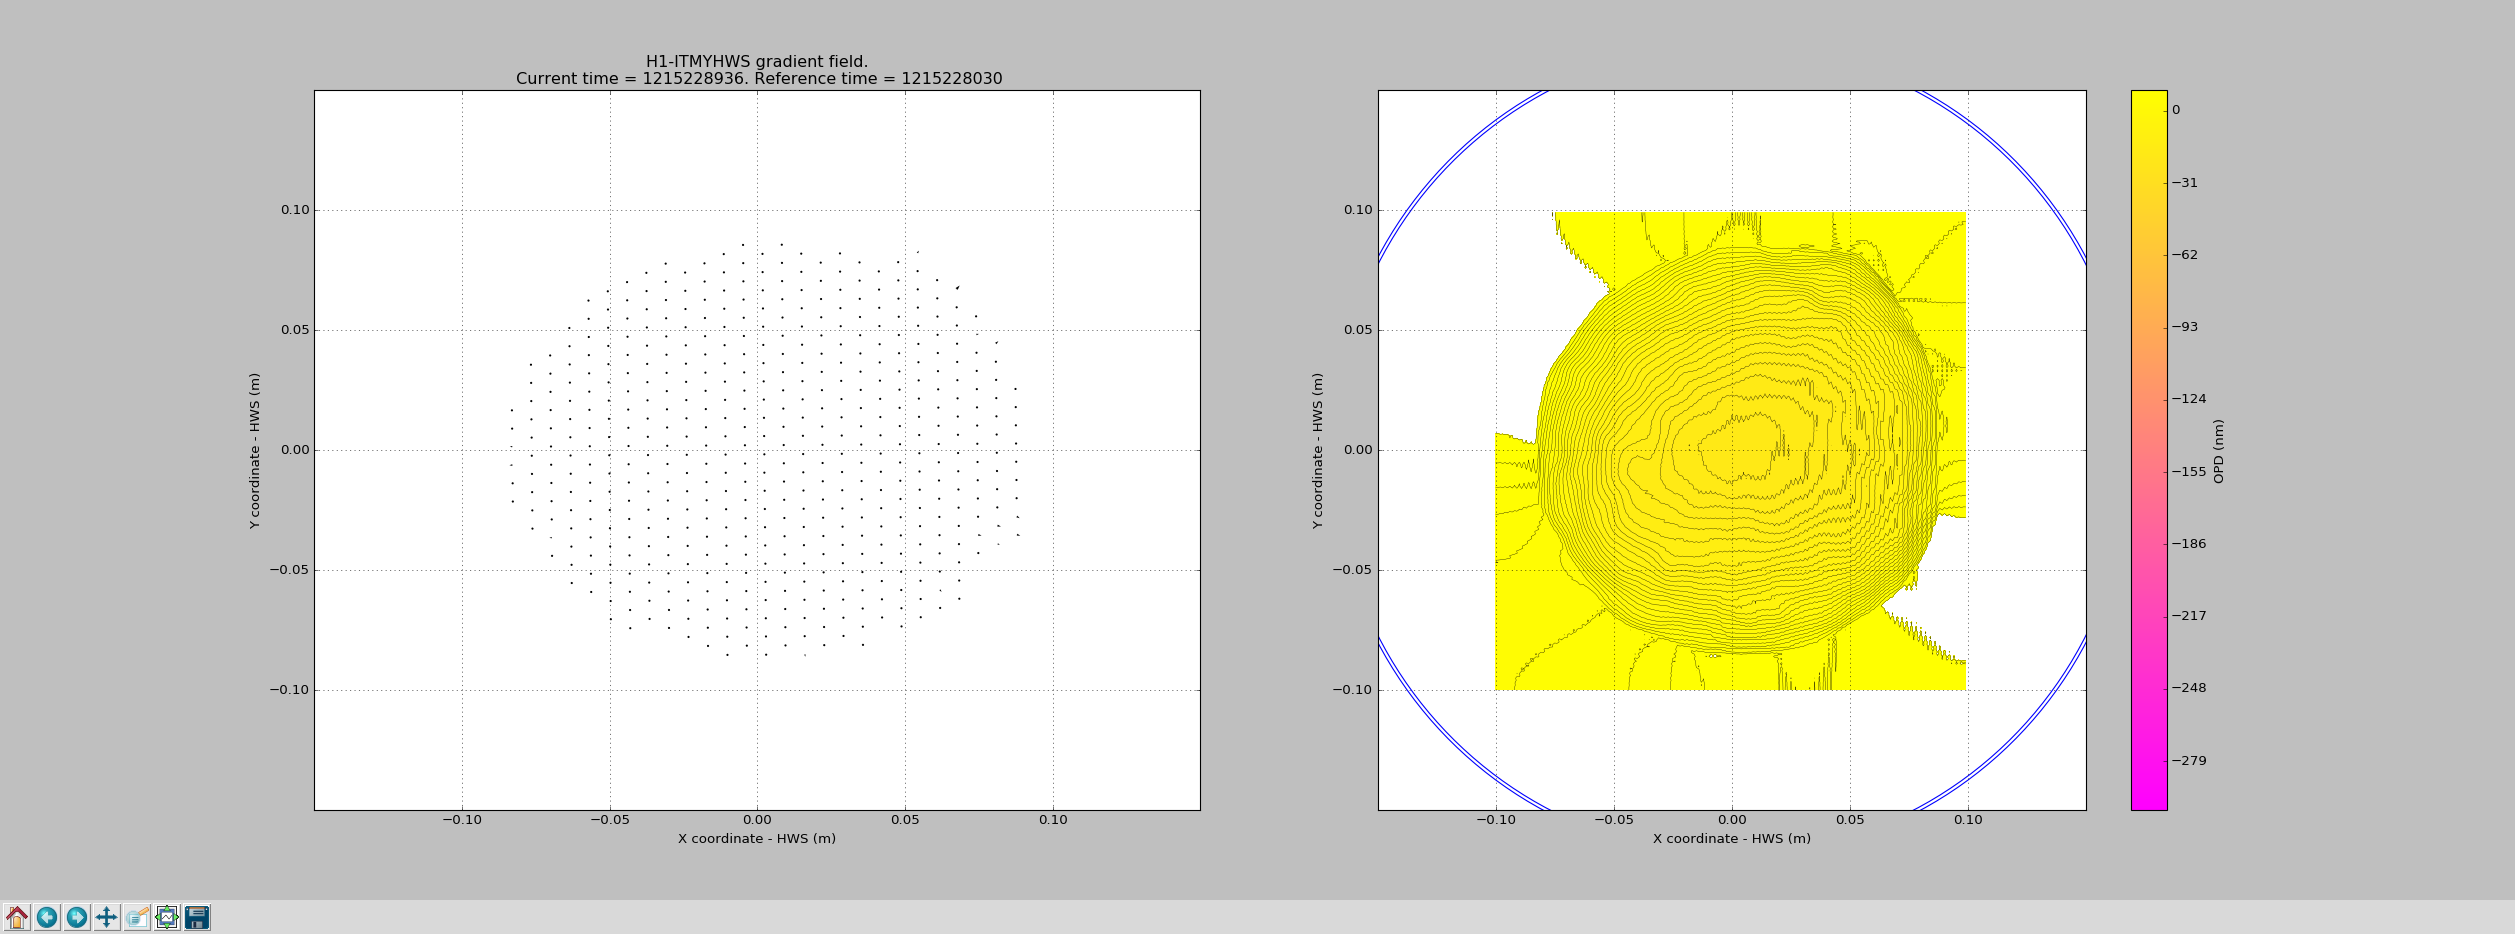
- With that we did a quick shot with the CO2 laser - it didn't look good... (plot 1) It almost looks like CO2 heating fringes... we will have to go back to this.
- We next wanted to verify that none of this is the fault of the HWS, so we did a ring heater run. That one looked reasonably well (plot 2), both in circularity and centering (note that the centering is sensitive to SR3 alignment).
- The optics are now cooling down over night - we will look at the CO2 heating again tomorrow morning.
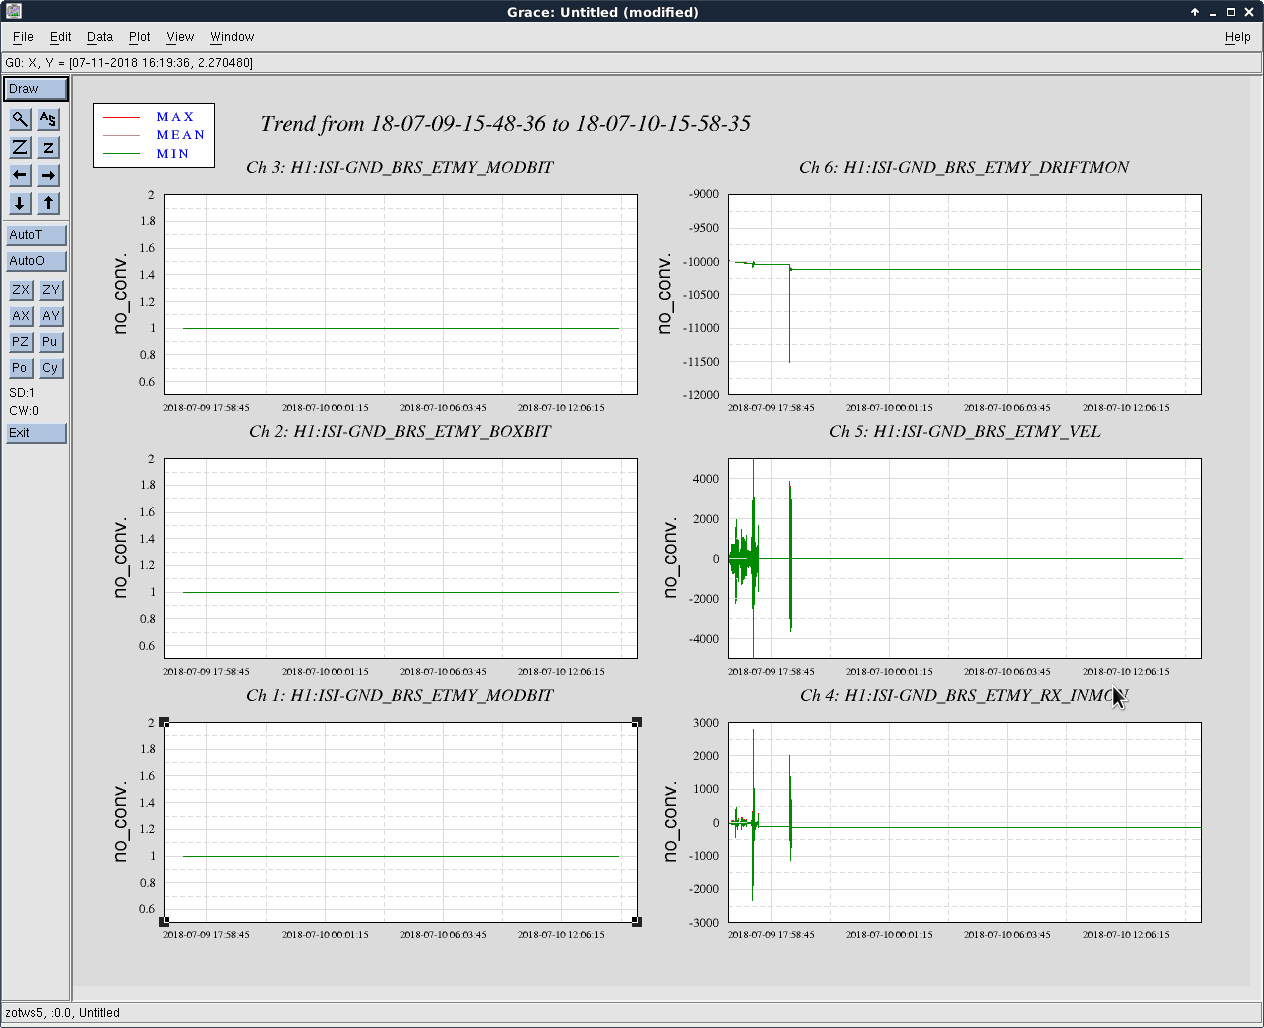
We left ITMY ring heaters and CO2 lasers off last night and attached is the cool down between Jul 10 2018 5:00:00 UTC and Jul 10 2018 16:00:00 UTC.
It seems like the ITMY HWS beam is still pretty well centered on on the test mass based off the ring heater cool down pattern.

To verify the calibration of the HWS with the ring heaters, we tried to match the COMSOL model of the transient heating here with the readout of the HWS sensing the RH heating (picture attached).
From Aidan/Stefan's remarks about the linear part of the RH absorption, the lensing effect can be approximated by
dS/dt = 6.75E-9 diopters per second per Watt
Using this equation we estimate that the Comsol model agrees with the HWS up to about 20% which is roughly consistent with previous tests.
| Method | Slope of thermal lensing in linear regime |
| COMSOL | 0.10 microdiopters/sec |
| HWS Spherical Power | 0.08 microdiopters/sec |