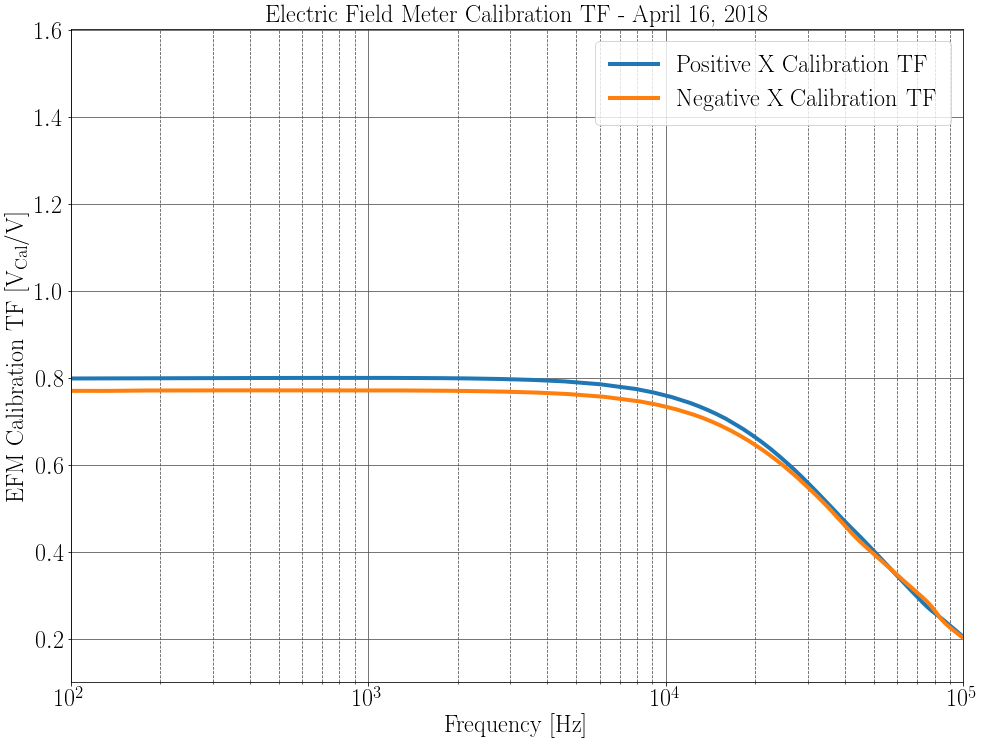
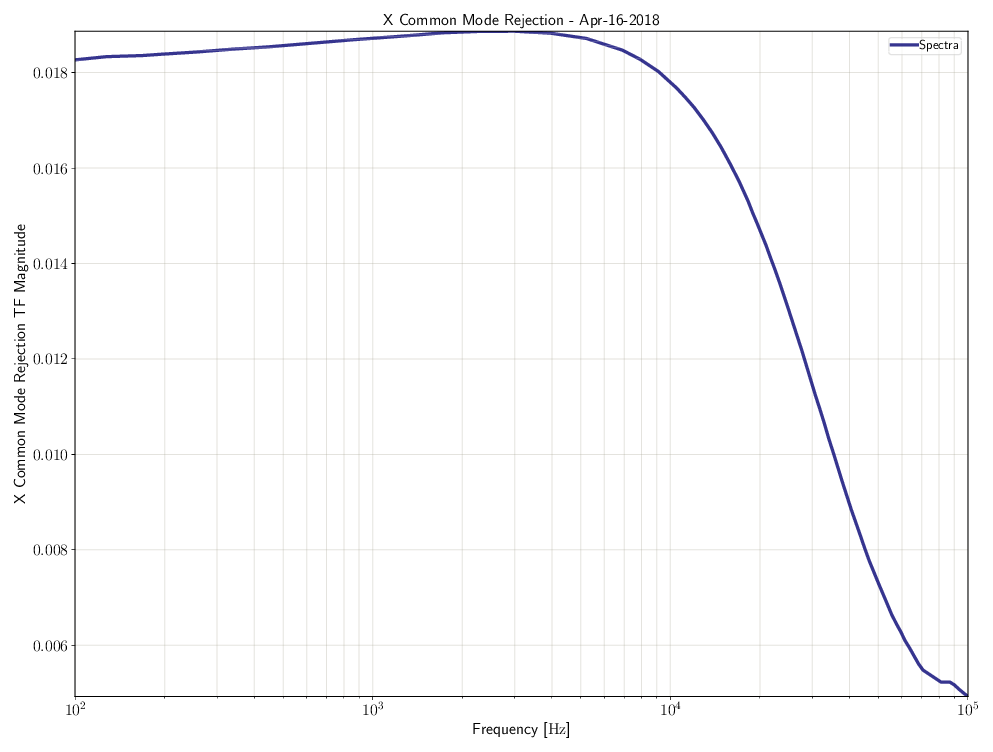
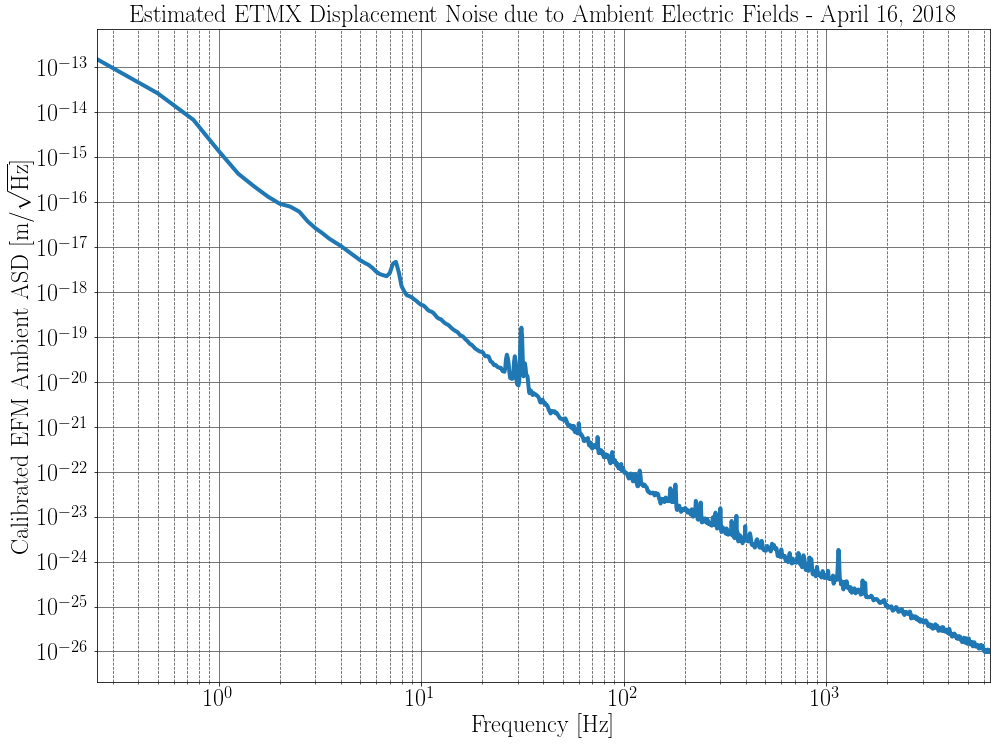
Craig, Niko, Georgia

Today Georgia, Niko, and I went down to Xend to take more careful measurements of the Electric Field Meter (EFM) Prototype built by Rich, Calum, and Luis.

We drove the ISI to check if we could see the electric fields above our EFM noise floor.  We drove the ISI both vertically and horizontally until the watchdog tripped, but never saw a signal in the EFM.  This is surprising, since Rai's prototype was sensitive to ISI driving in the Y chamber.

We measured a calibration TF for both the positive X EFM sensor plate and negative X EFM sensor plate (Plot 1),
the common mode rejection from the X sensor plates (Plot 2),
and an ambient electric field ASD in the X-end chamber (Plot 3).

Finally, I roughly estimated the ETMX displacement noise we might expect from ambient electric fields given our usual ESD setup. (Plot 4)
The details of the calculation made to get plots 3 and 4 are in a jupyter notebook on git.ligo.org.

At 100 Hz I estimate around 10^{-22} m/rtHz displacement noise, far below our noise floor.  However, I'm getting a stronger frequency dependence than we perhaps anticipated: our measured electric field falls like f^{-1.5}, until it runs into what is probably the EFM circuit noise floor at 200 Hz.  This gives an overall displacement frequency dependence of f^{-3.5}.

Pictures are courtesy of Niko and Georgia who did all the in-chamber work today.

Things to do:
1) Get capacitance measurement between calibration plates for a better volts to electric field TF.
2) Understand and create a noise model of the EFM circuitry.  This will probably help explain the strong frequency dependence we're seeing with some low frequency pole.


I ran a noise simulation of the ungrounded-plate noise spectra. The attached image shows what would be expected from the 10^12 ohm resistance filtered by the approximately 20pF capacitance of the sense plate to the body (including amplifier input capacity). The results at 100Hz confirm the ~200nV/rtHz associated with the asymptote of the intrinsic electronics noise of the device as seen when the sense plates are grounded.

Conclusion: we're fairly confident we are not actually driving the ISI at end-X, and this is why we don't see the associated electric fields.
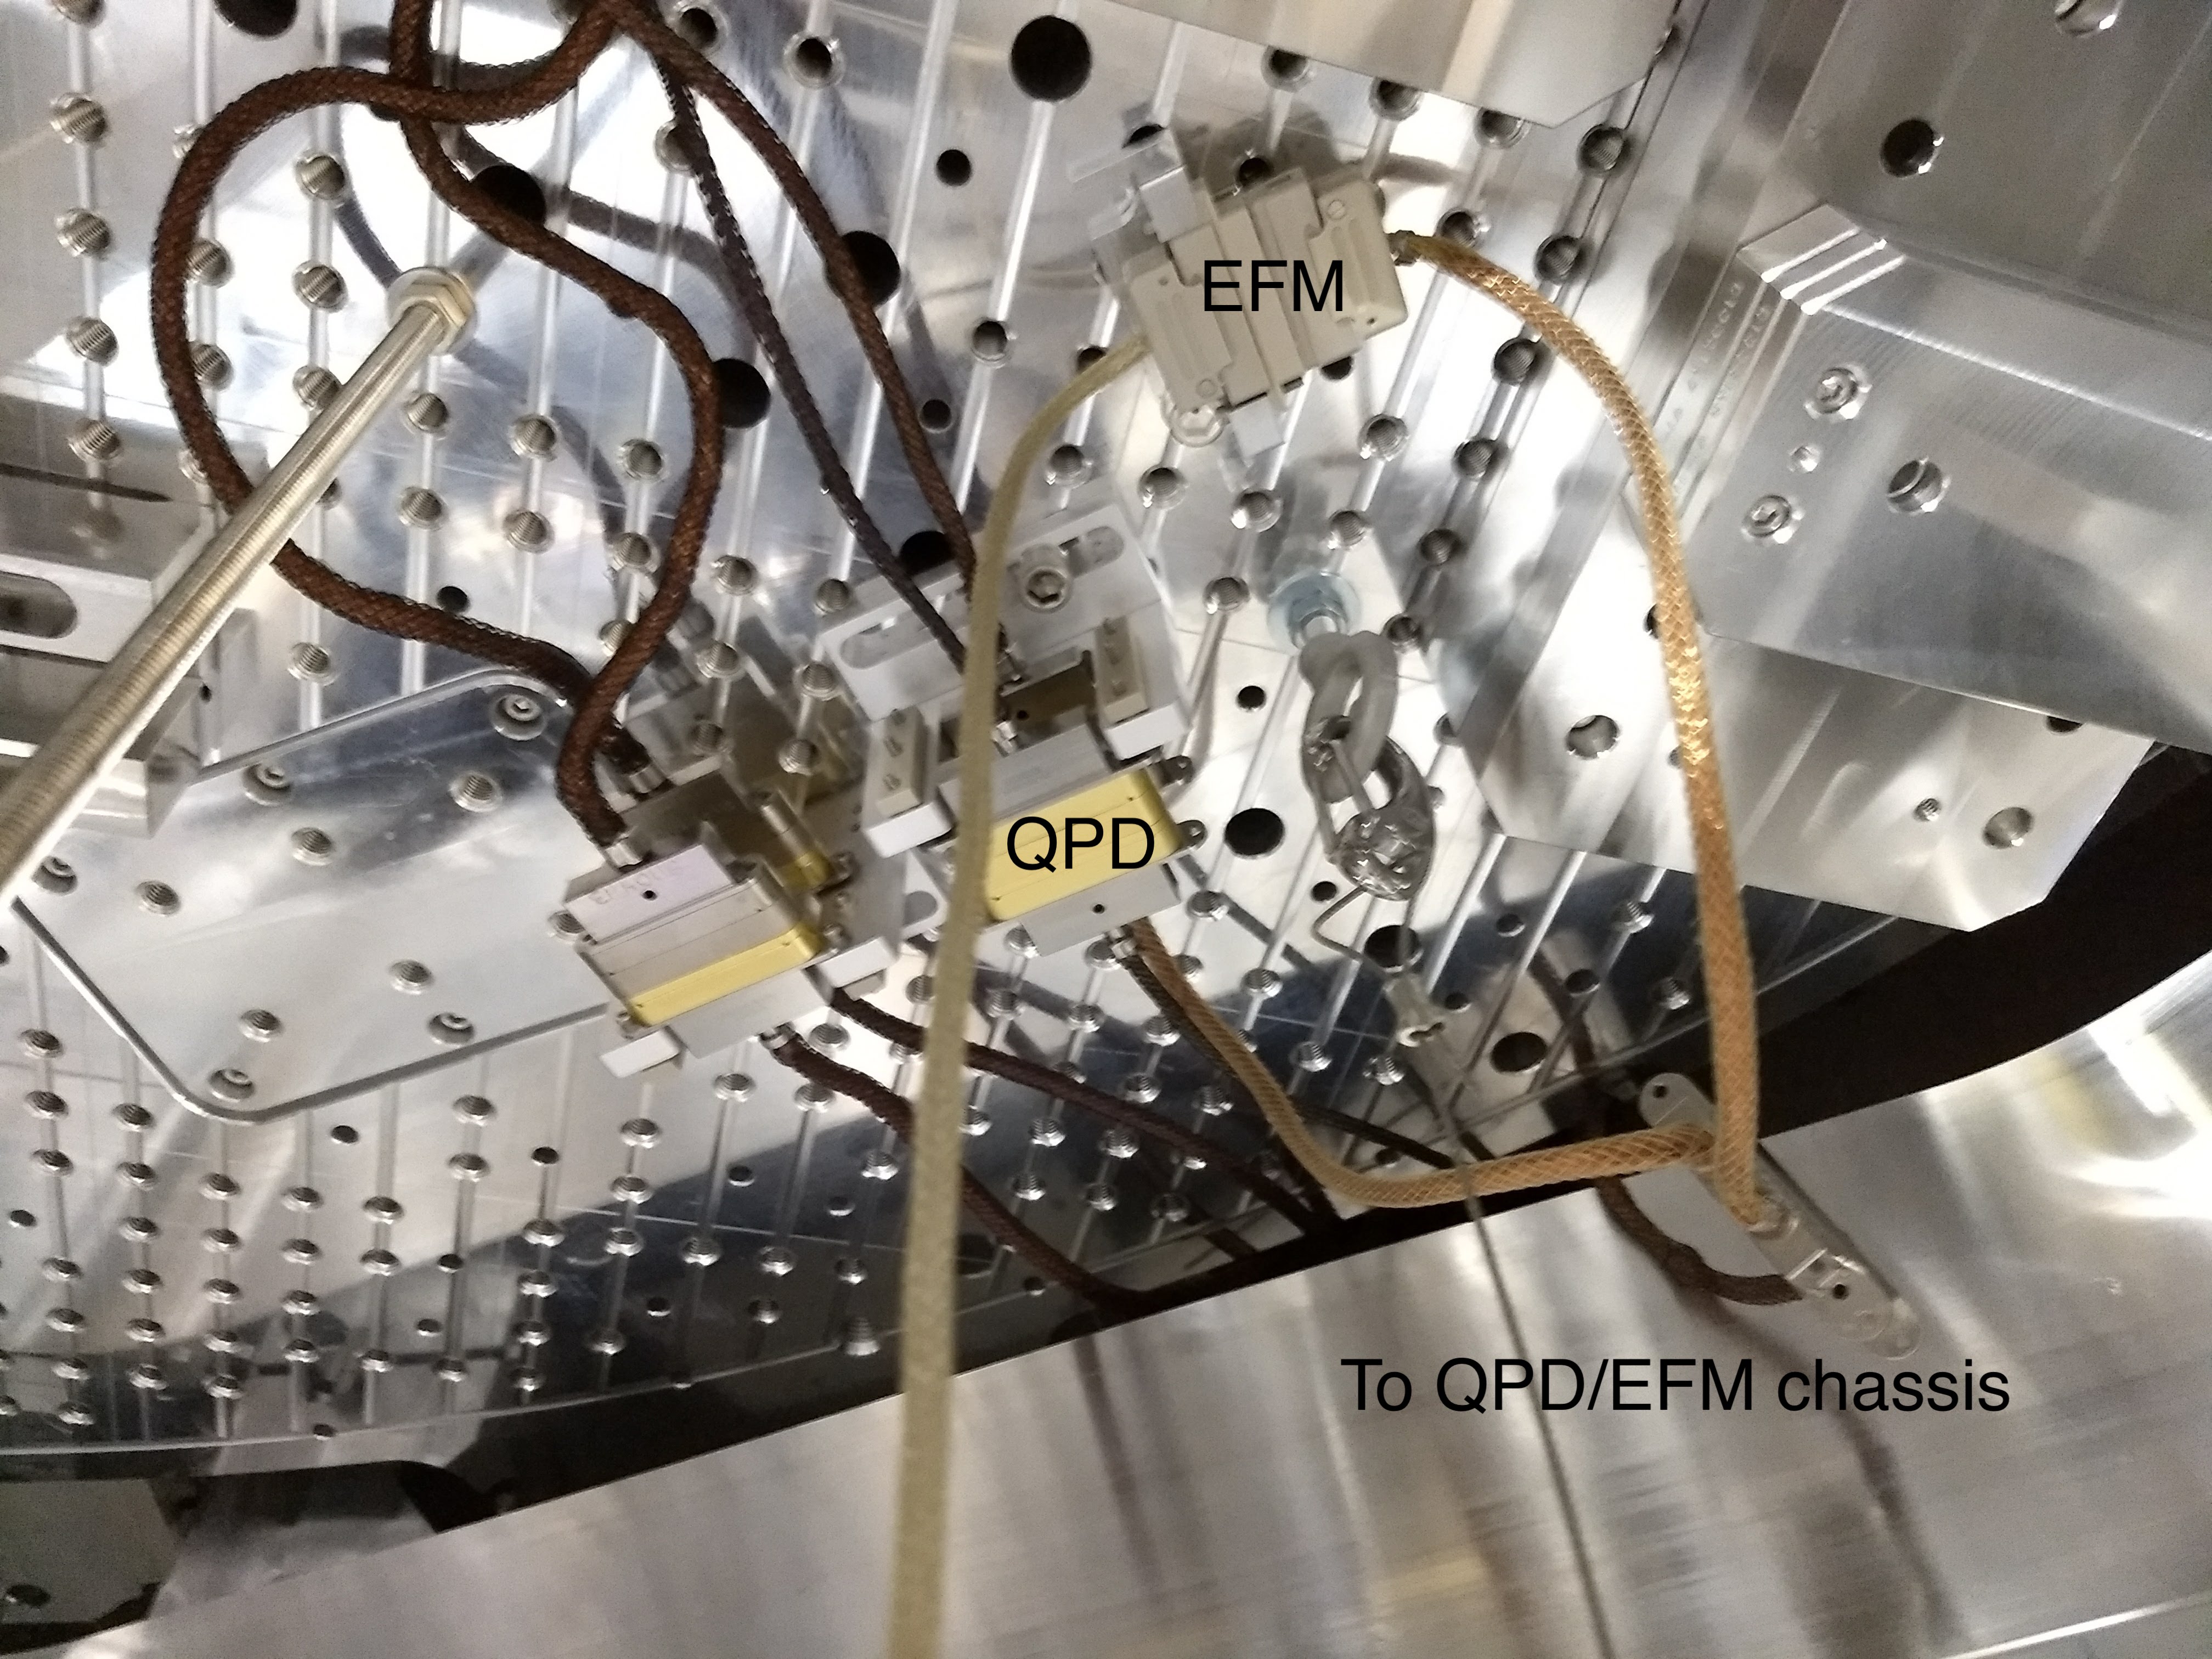
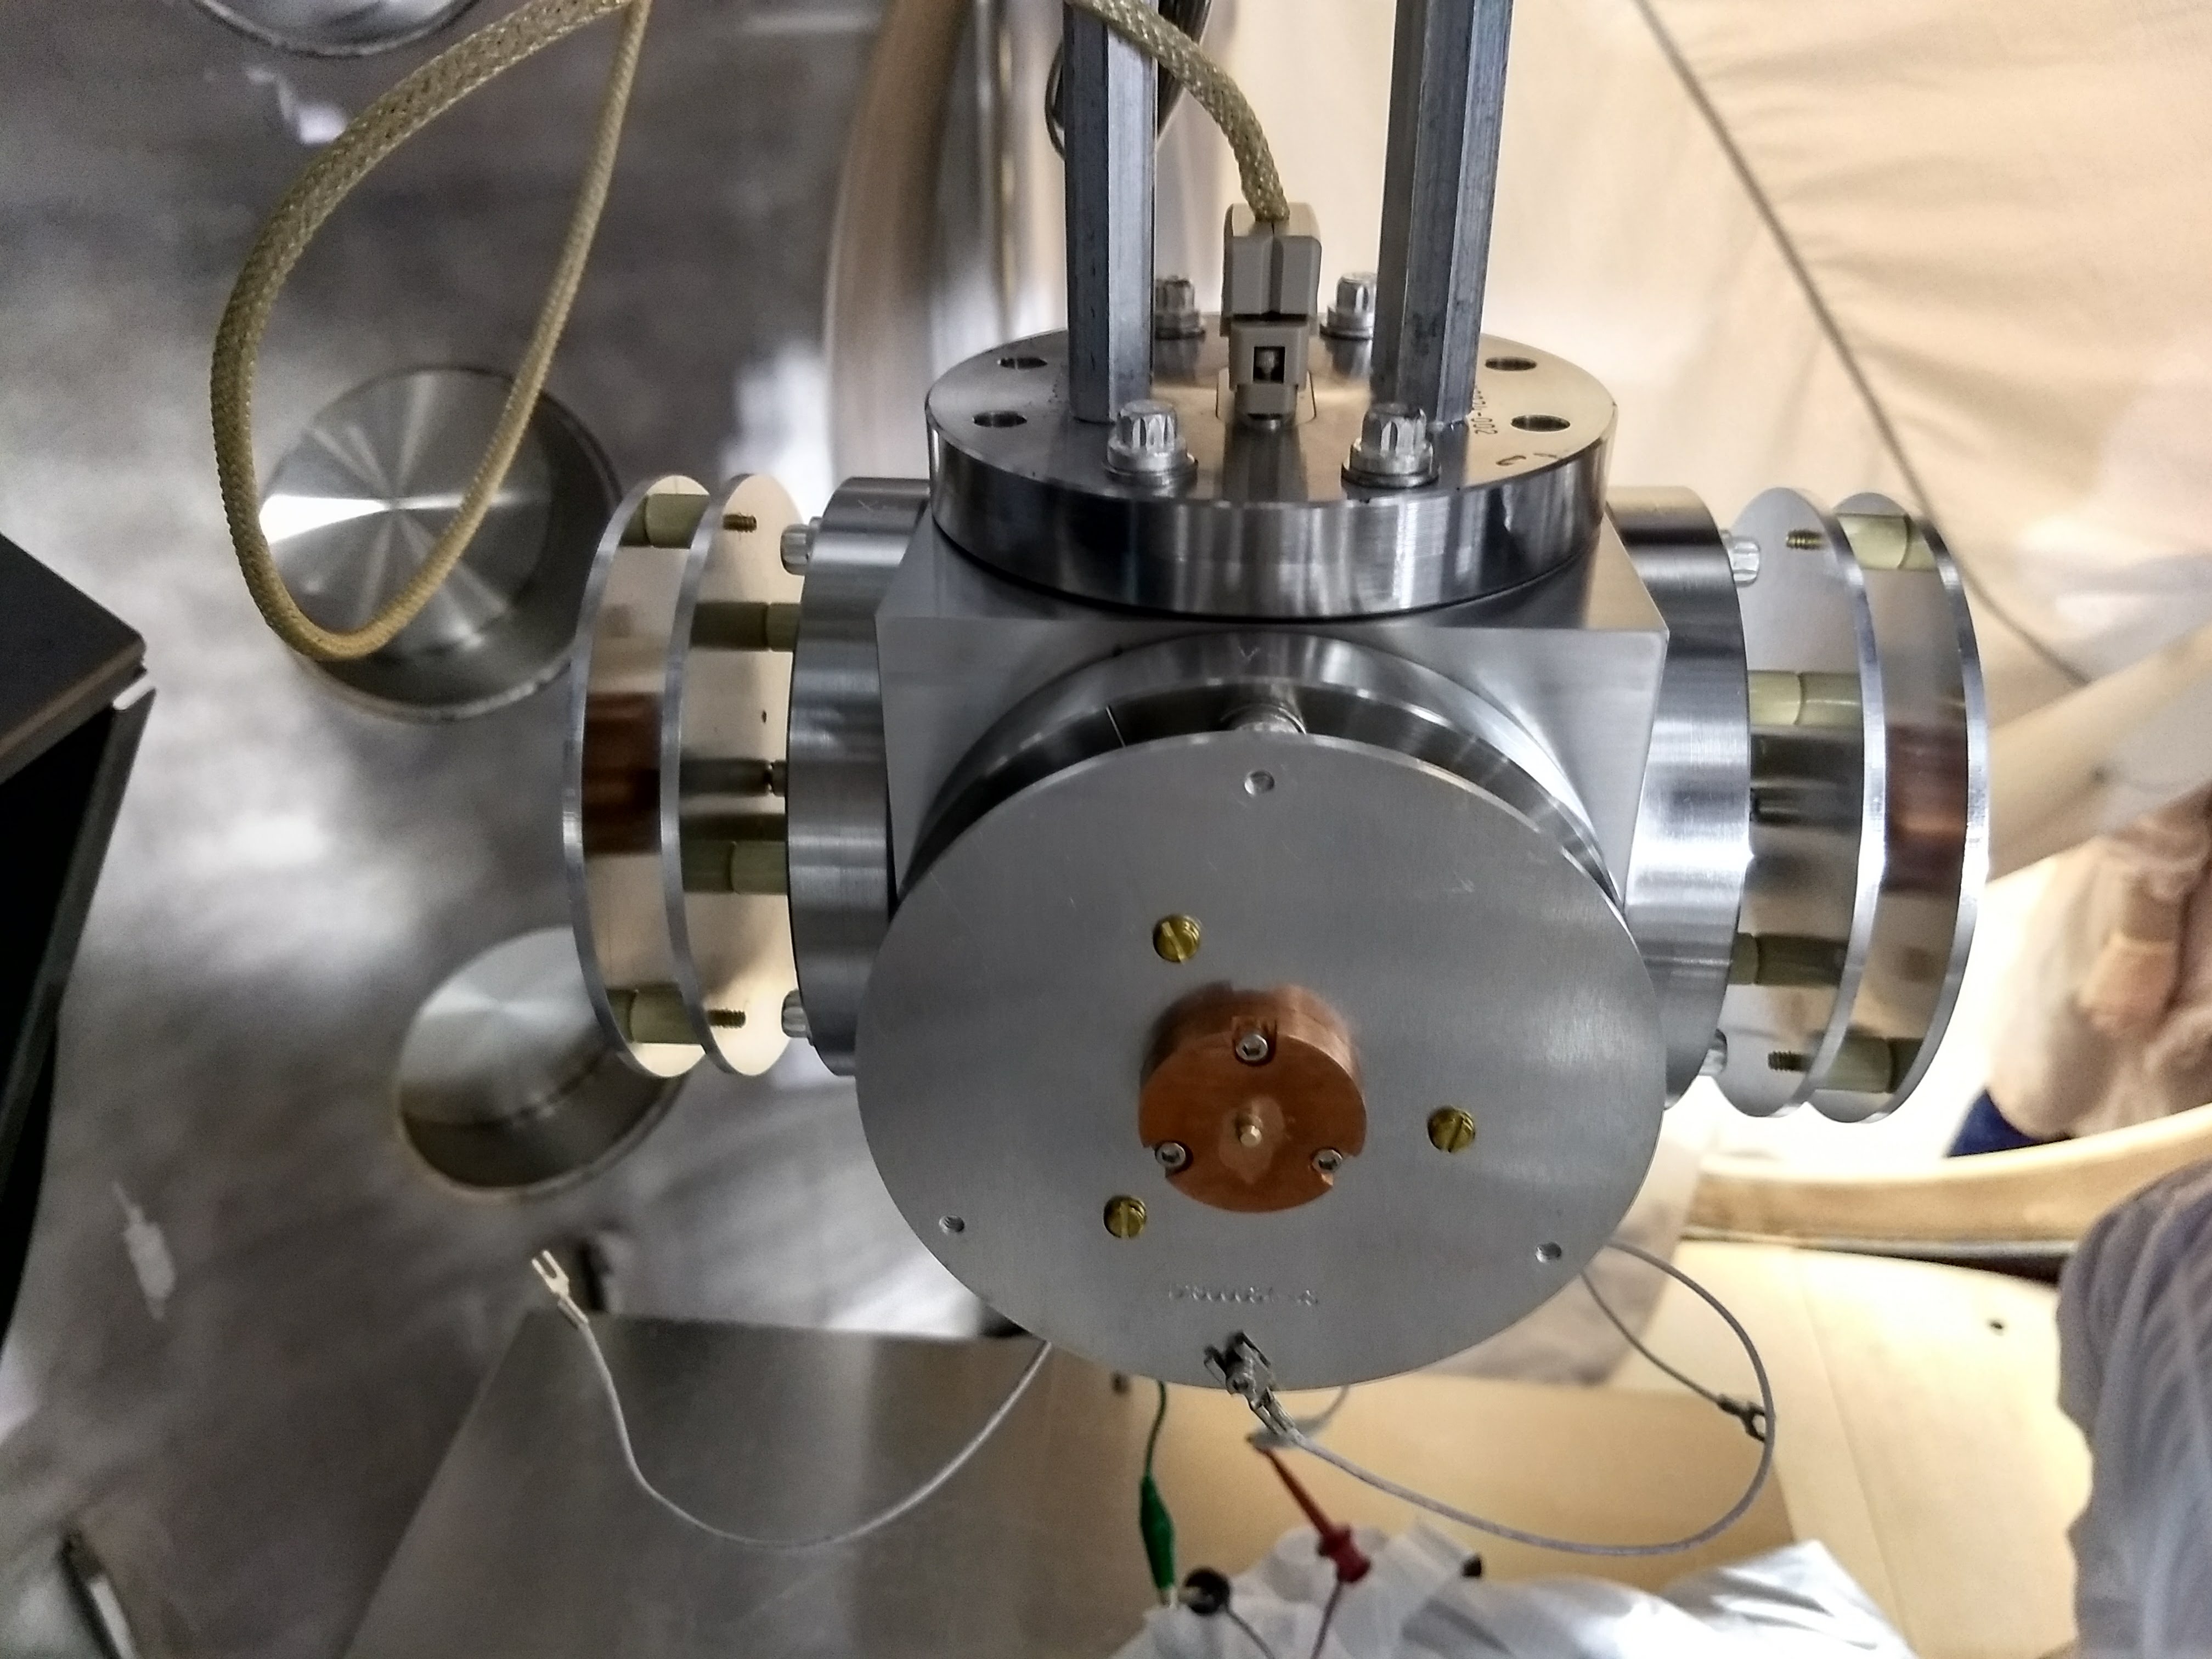
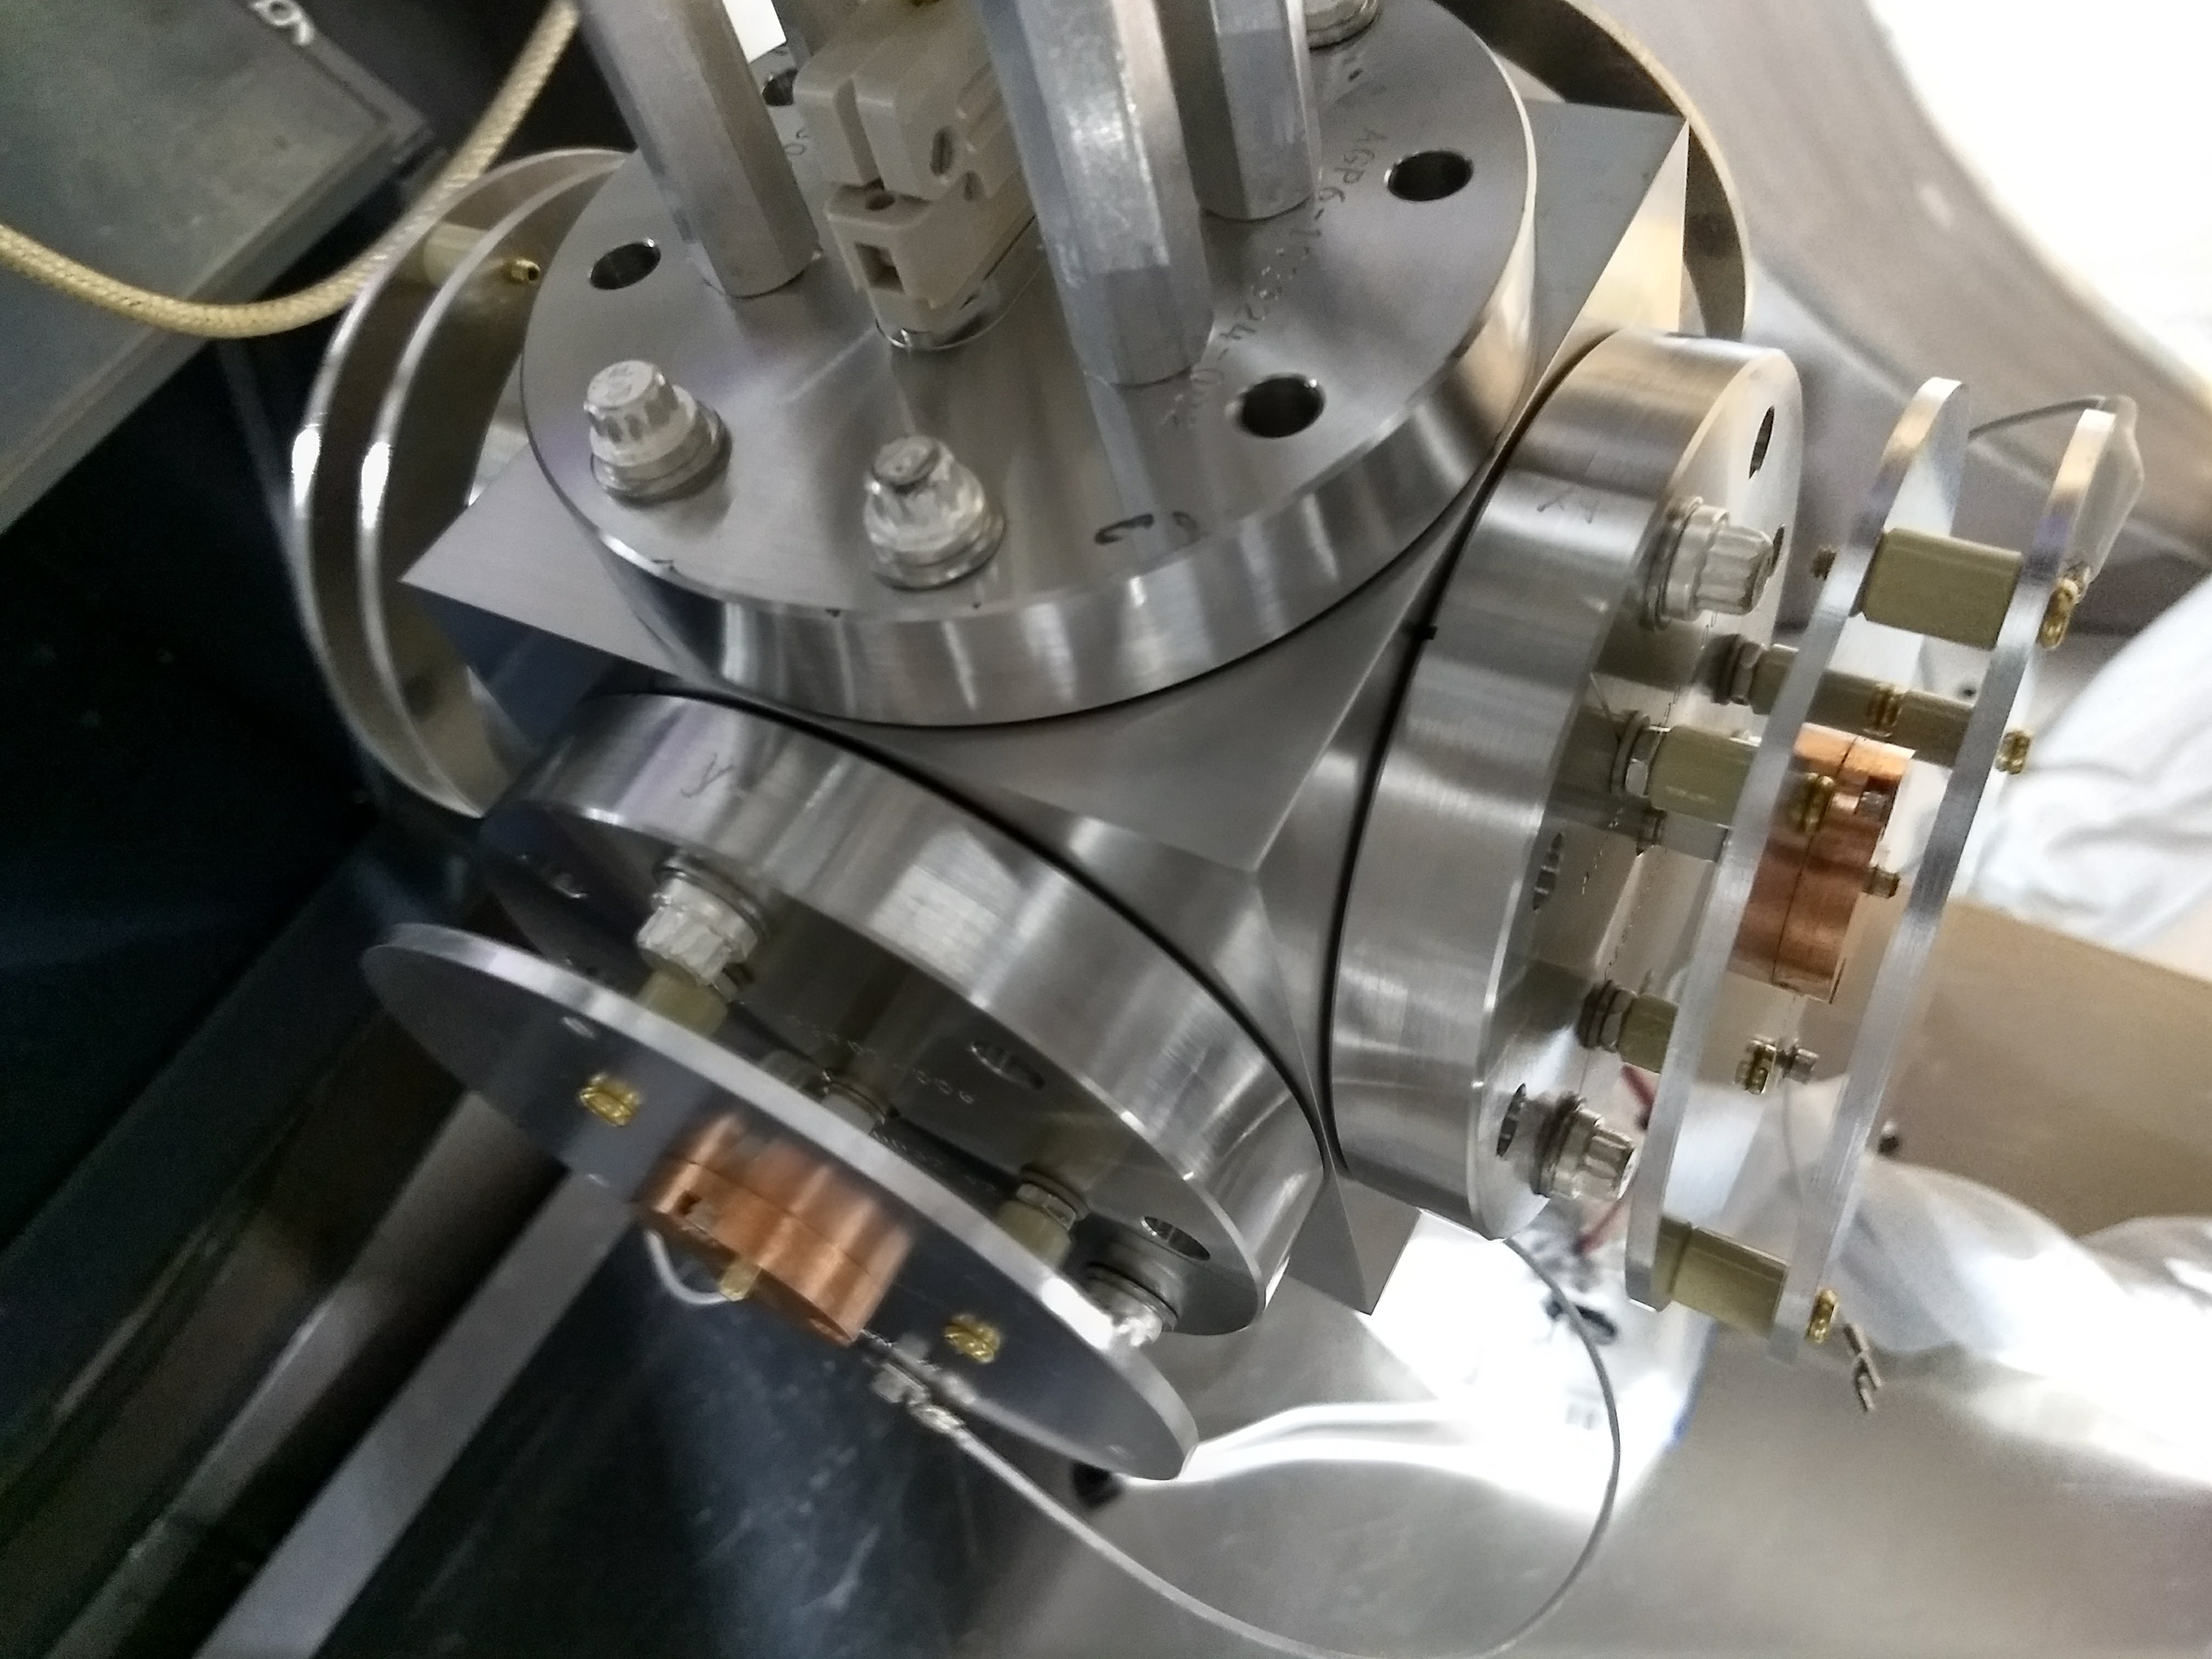
As a sanity check, Craig brought the previous electric field meter (EFM) out to end-x and placed it in the chamber under the current EFM (see first two photos). We have previously detected the electric field generated by driving the ISI with this EFM (lho alog 40878).
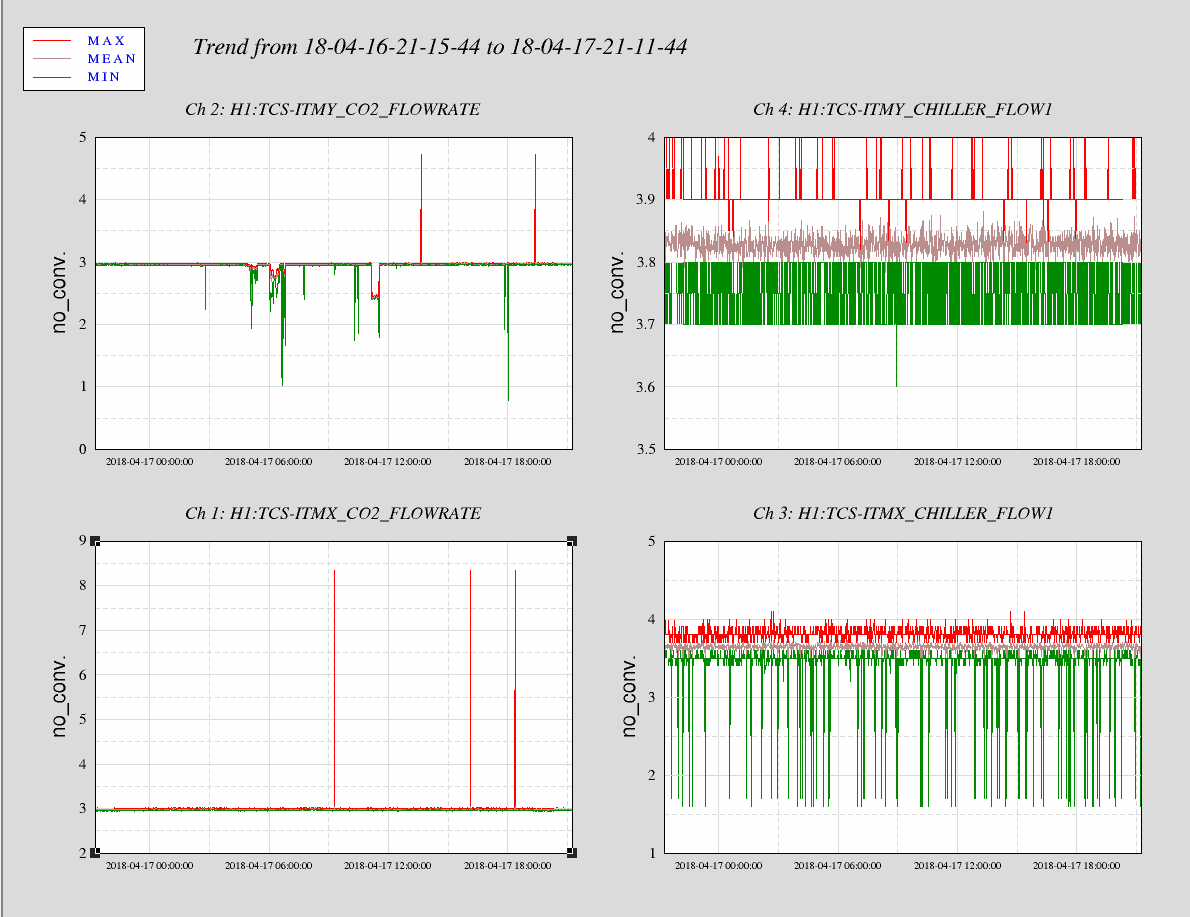
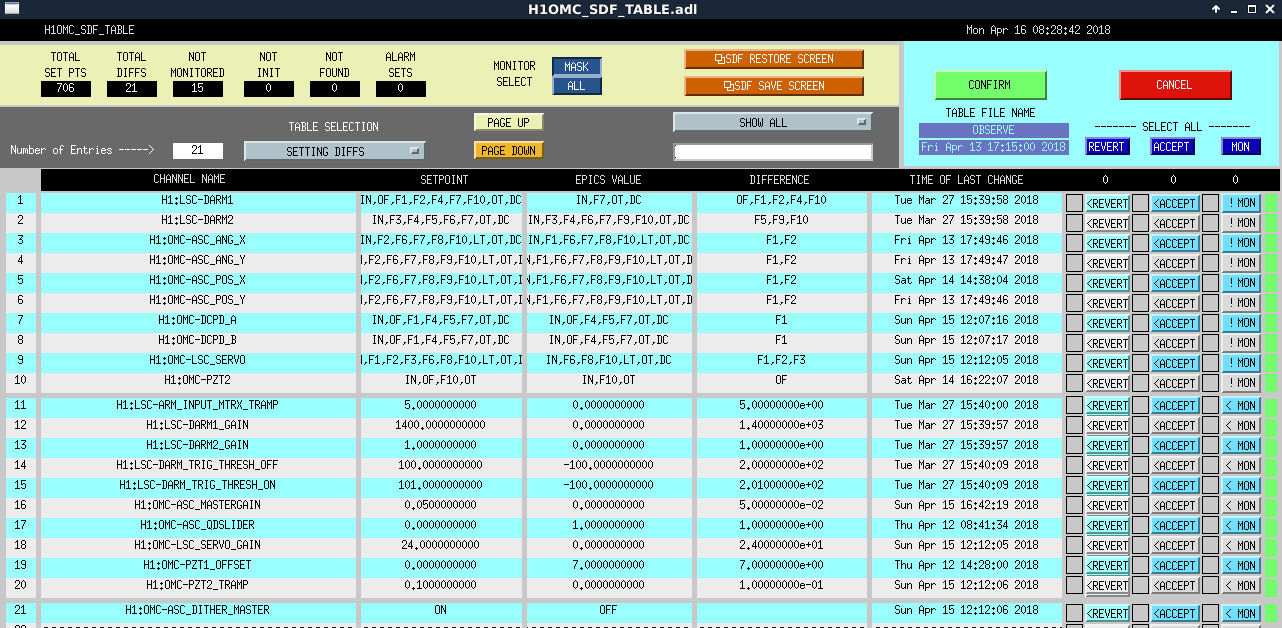
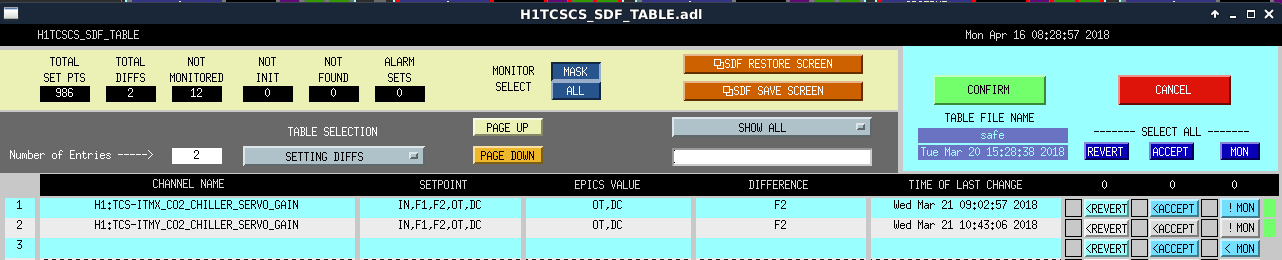
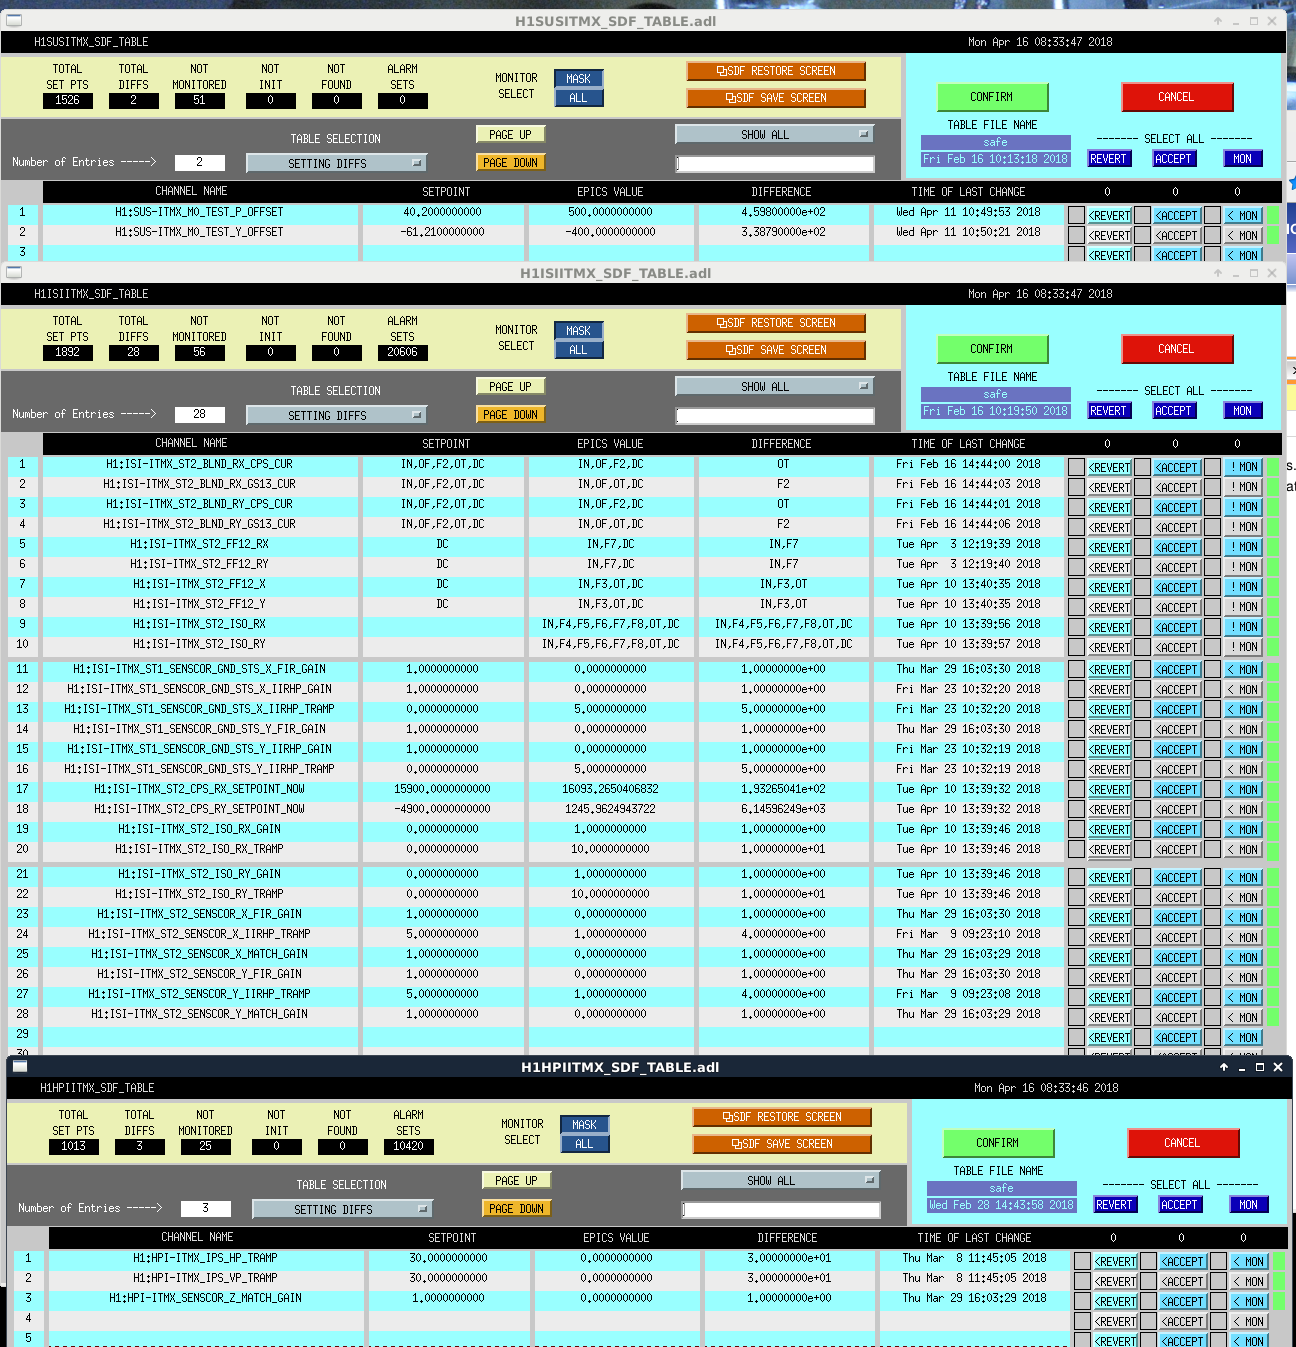
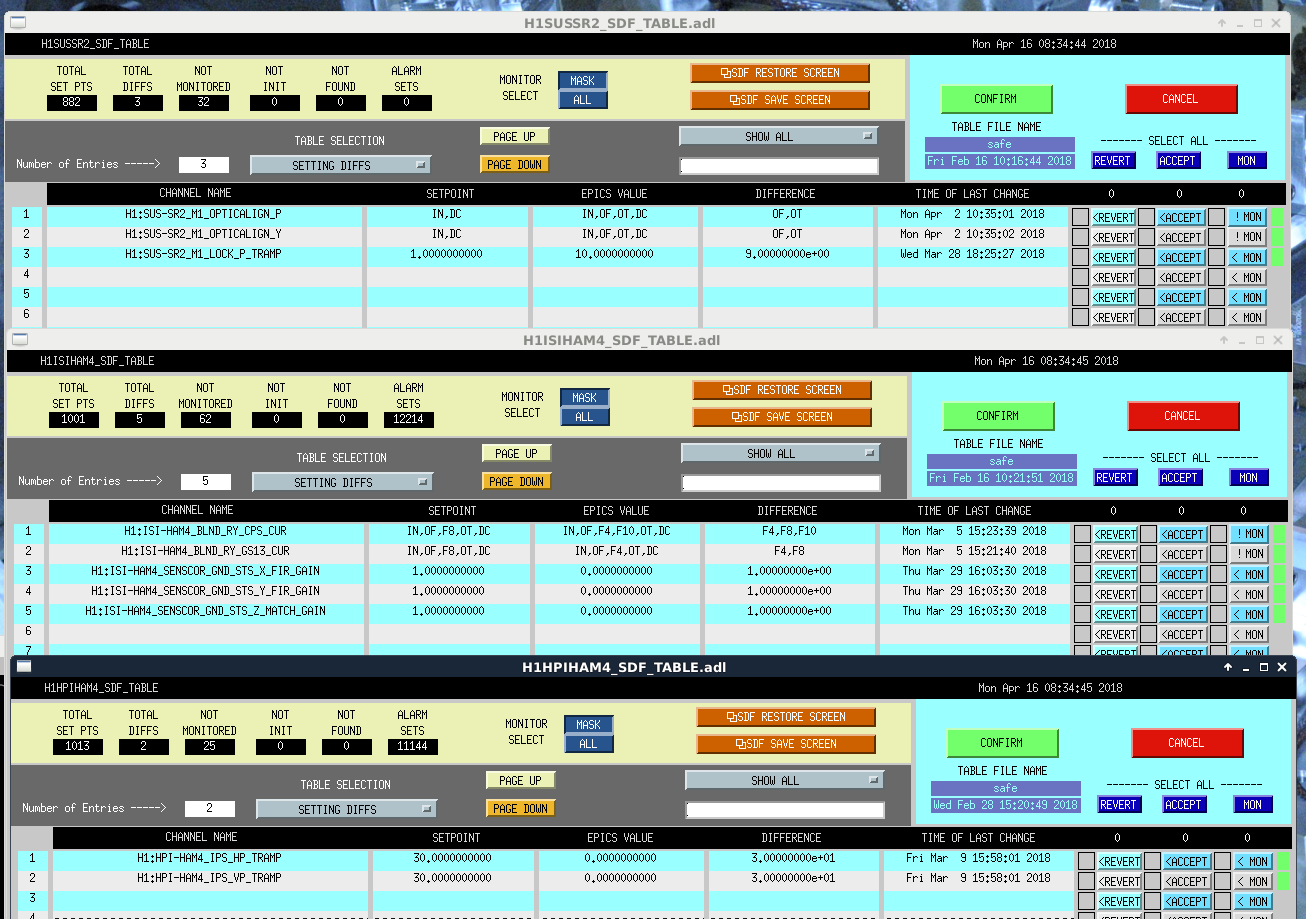
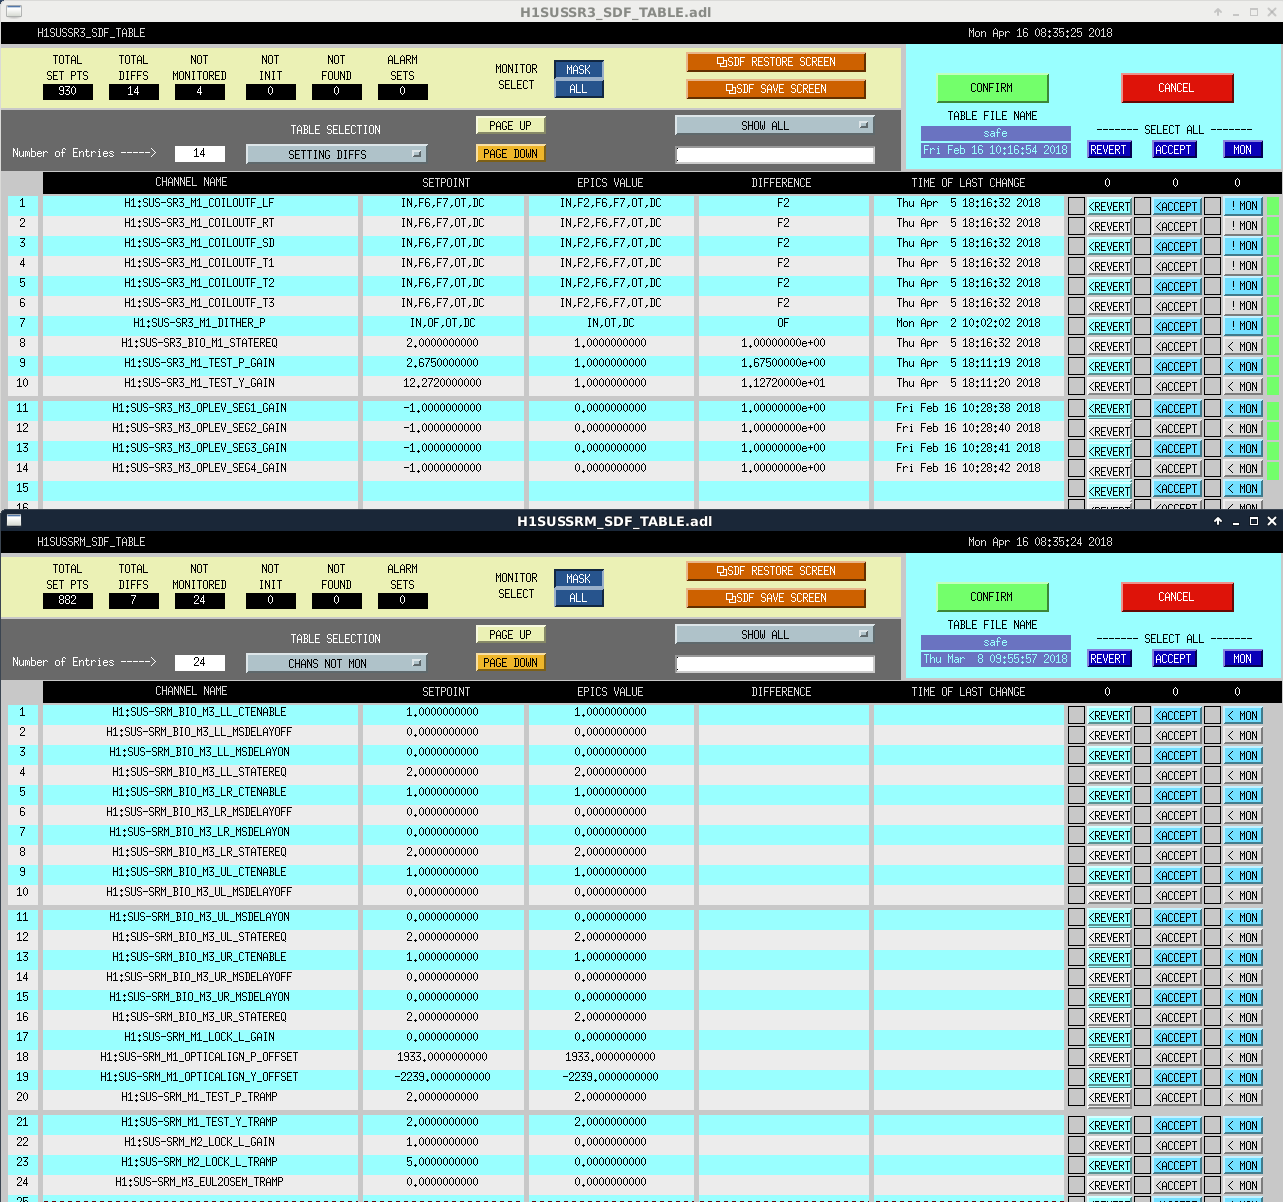
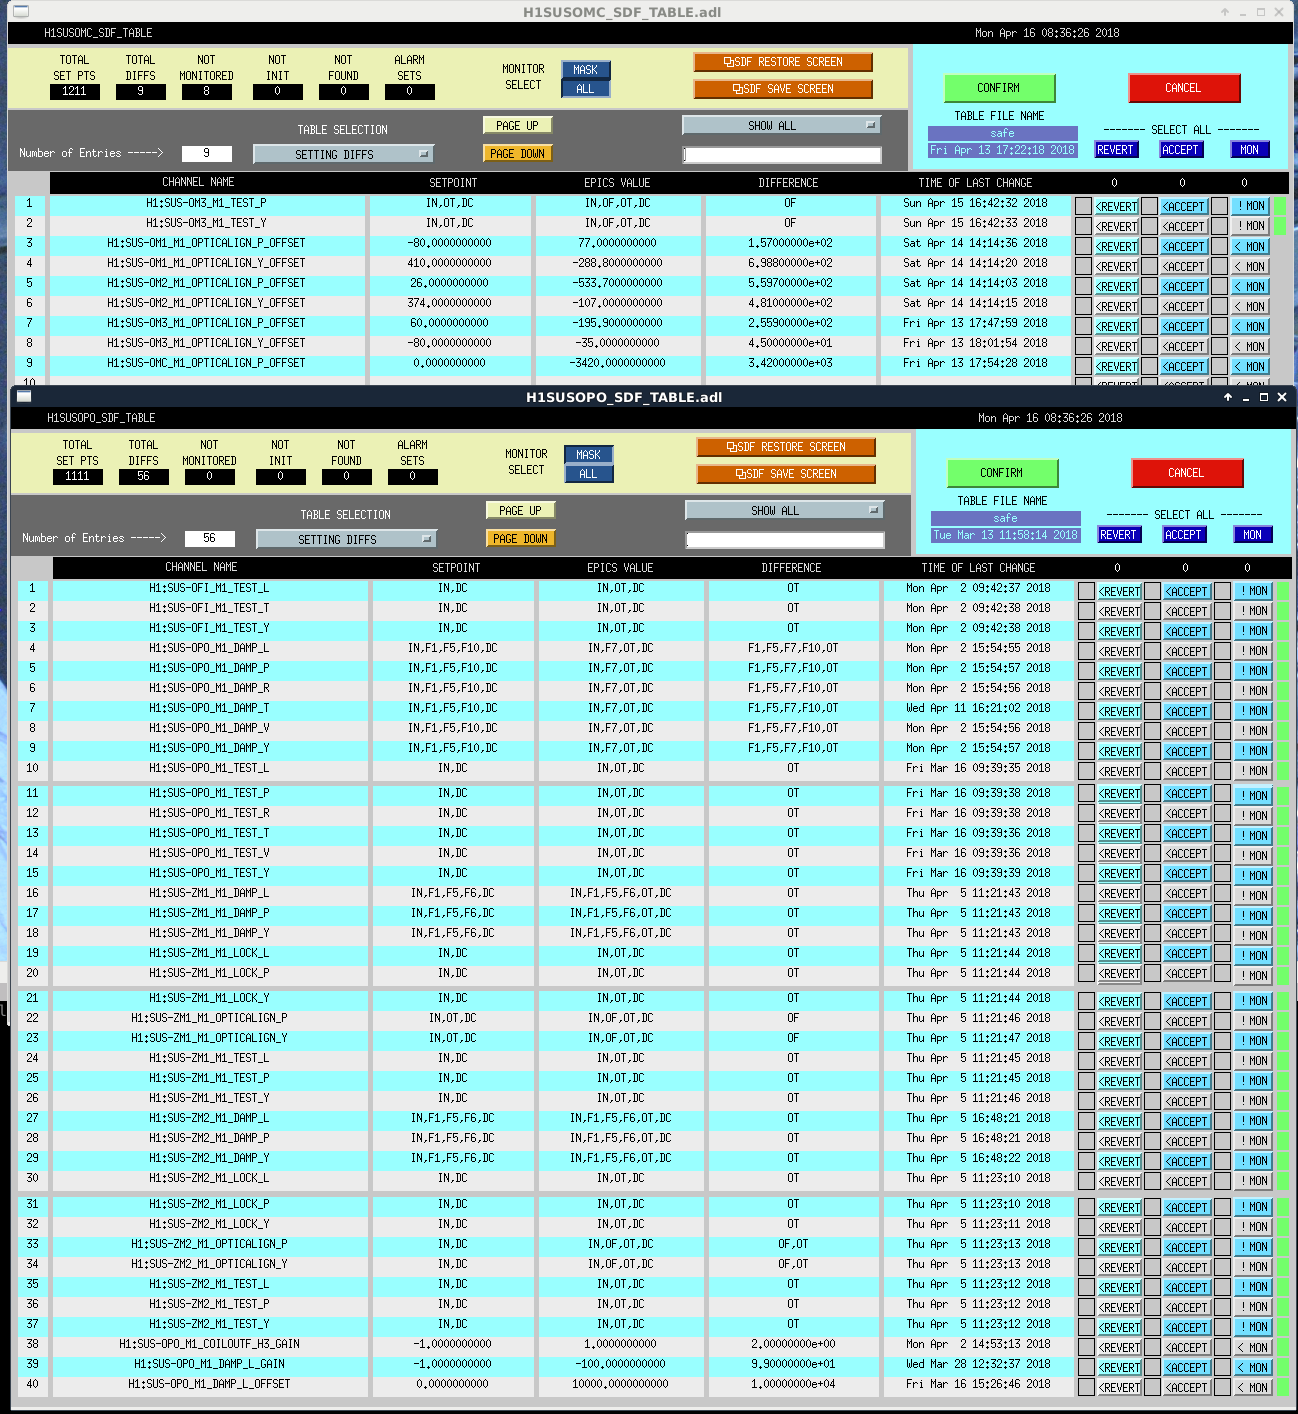
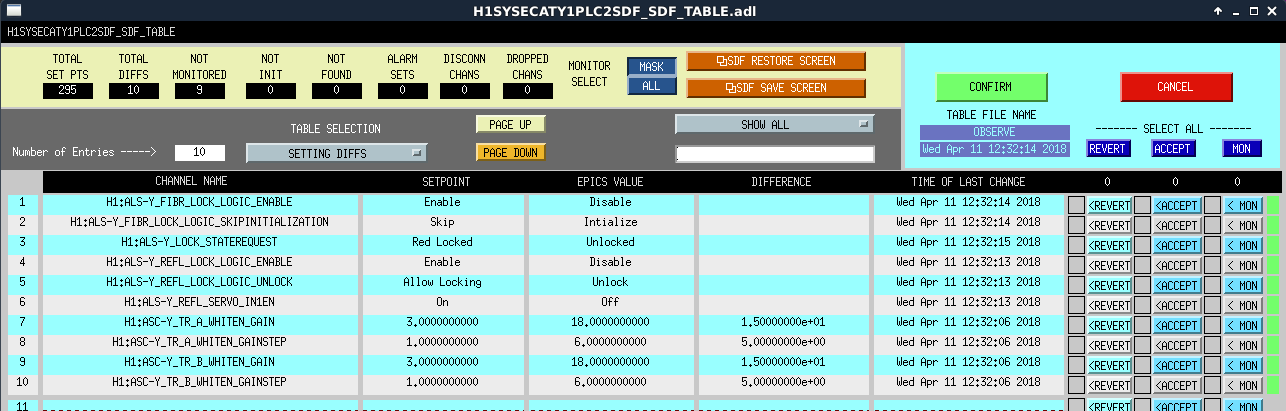
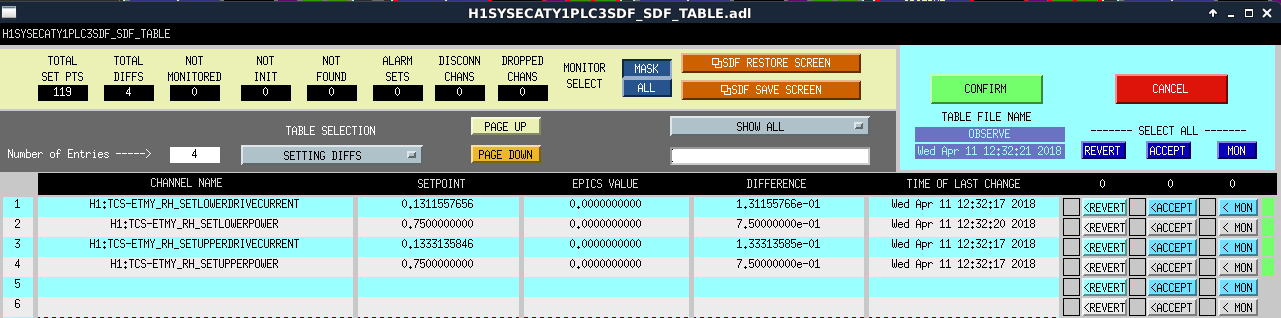
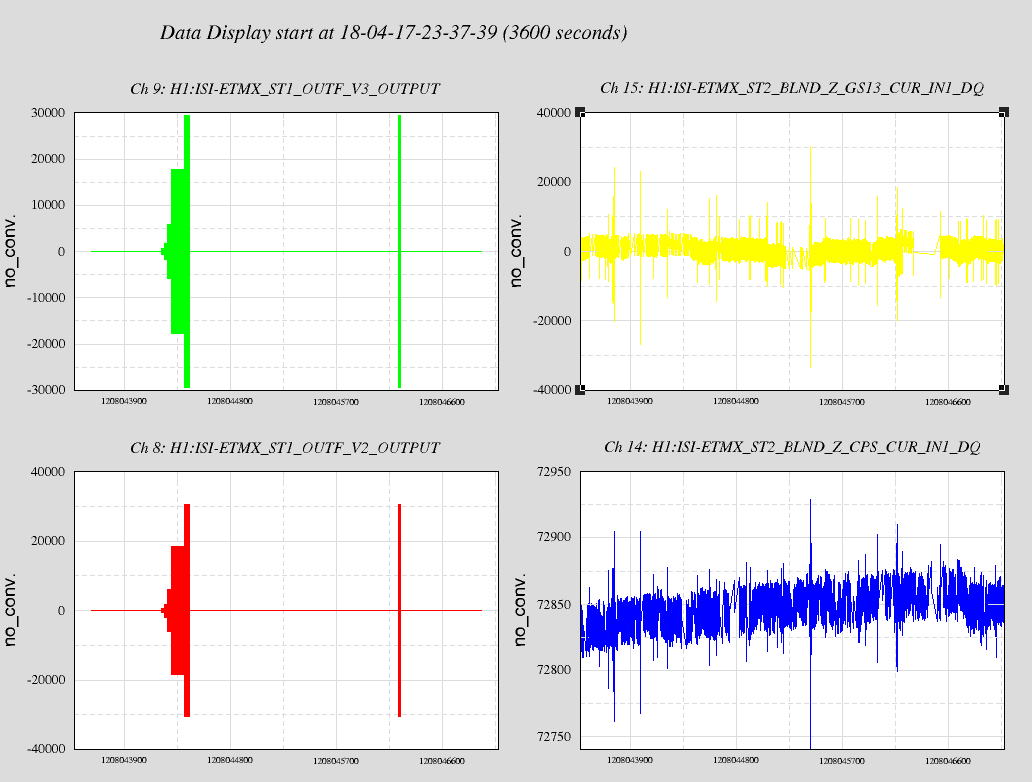
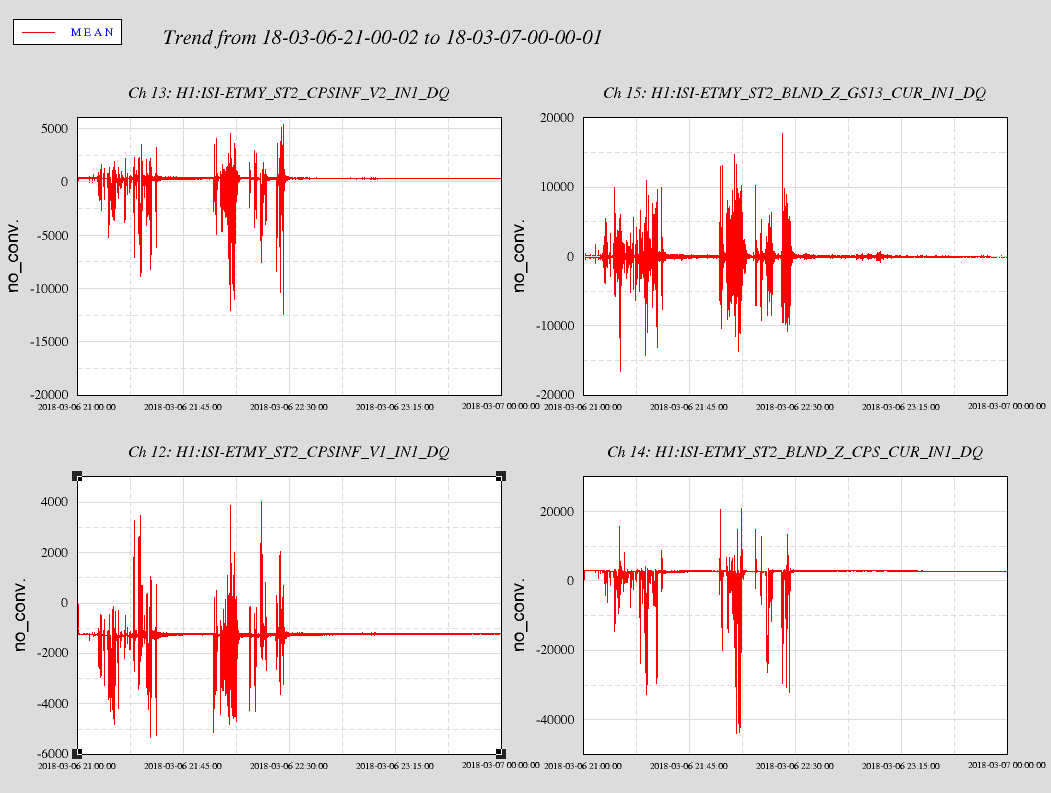
We tried driving the locked ISI again, with increasing amplitude, at 353 Hz, and saw nothing in either EFM. We looked at the GS13 and CPS sensors, both now (first screenshot, with drive signal in the left column) and back in time, when we were driving the ISI back in March (second screenshot, again with drive signals in the left column). We see no signal associated with the drive now (right colum), while in March the drive was present in both these signals.
We checked the watchdogs, and reset the hardware watchdogs just in case, checked the ISI racks for unplugged cables, and the power supplies and are still unsure why we are not driving the ISI.
We took the old EFM out of the chamber for the night.


I don't think that we can estimate the contribution to DARM from this data, since we don't have a good estimate of charge on the optic or the coupling from the EFM to the fields at the test mass.
In my estimate, I assumed that charge on the test mass is zero and the ambient electric fields at the EFM are the same as those at the test mass.
My concern is that we are just looking at EFM sensor noise and not really ambient electric fields.  It seems like we are seeing ambient electric fields below 200 Hz with a frequency dependence of f^{-1.5}.
Many assumptions went into the estimated displacement noise, I wouldn't trust it to better than an order of magnitude.