TITLE: 03/22 Day Shift: 15:00-23:00 UTC (08:00-16:00 PST), all times posted in UTC
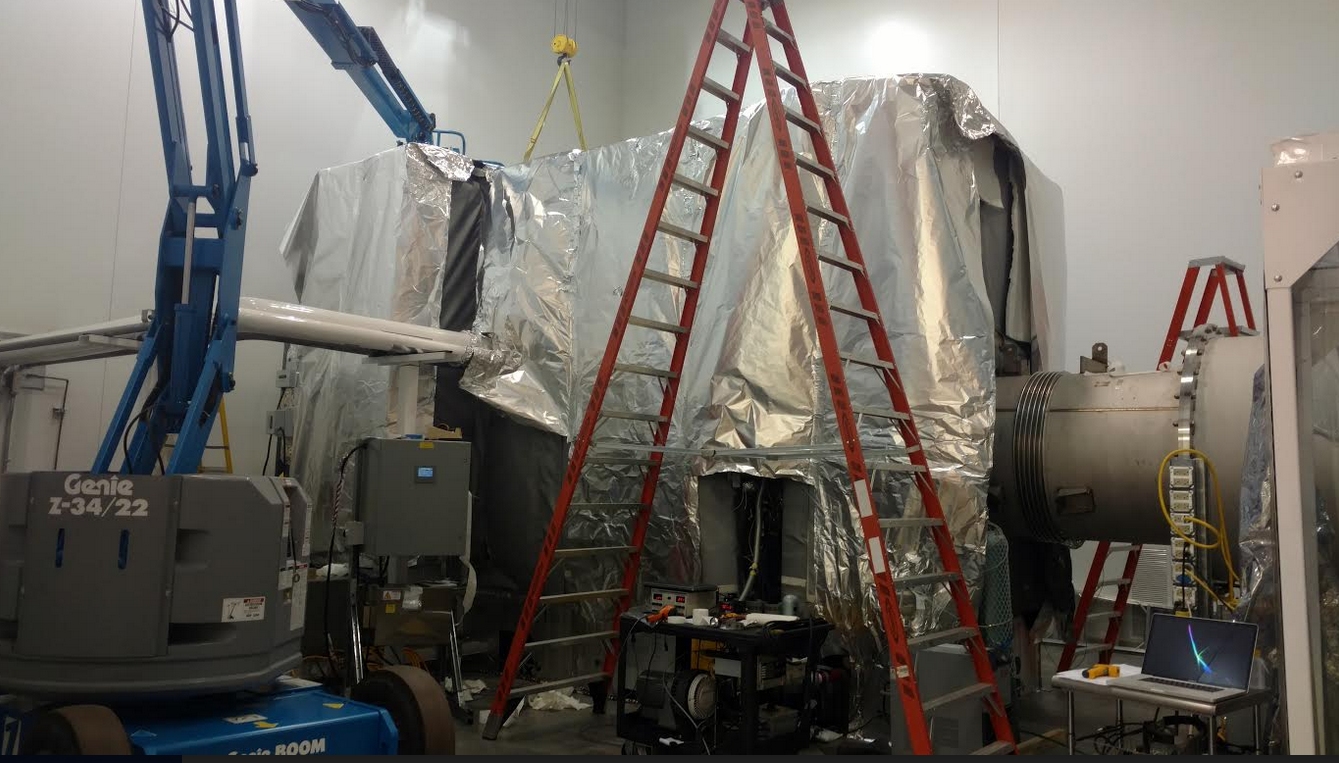
STATE of H1: Planned Engineering
INCOMING OPERATOR: None
SHIFT SUMMARY:
LOG:
13:36 Peter into PSL
14:30 M2 (aka Itchy & Scratchy) @ MY VEA
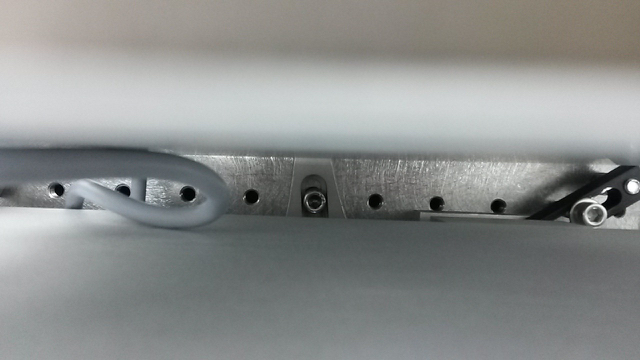
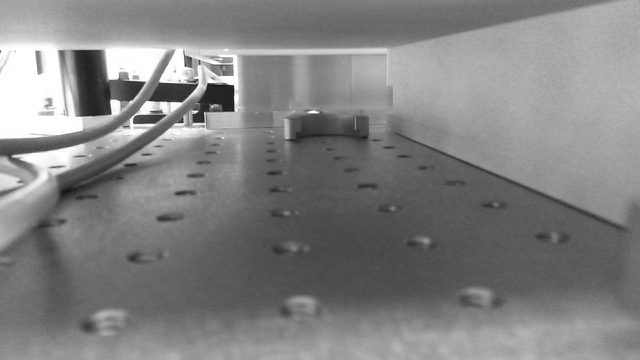
14:38 Jeff B out to EY/EX for photos, reinstall dust monitors for vent and rodent checks - contamination control
15:13 King Soft on site
16:40 Bubba out to EY - to the well
16:40 Jeff B back from Ends and heading out to LVEA
16:50 Betsy and Travis out to EX
16:55 Jeff B back
17:23 Kyle, with Apollo, arrived on site
17:24 Sheila, Arijit and Terry out to HAM6
17:33 Jeff B to ITMY for camera work
17:44 Mark out to LVEA
17:56 Marc back
18:31 Chandra out to MY
18:44 Betsy and Travis back
18:45 Peter out to PSL
18:55 Jeff B back from ITMY - LSO must be informed before transition to LASER HAZARD as the cover is OFF the viewport
20:35 Jeff B out to LVEA
21:08 Betsy and Travis back out to EX
21:45 Peter back
22:09 Jeff B back for the day
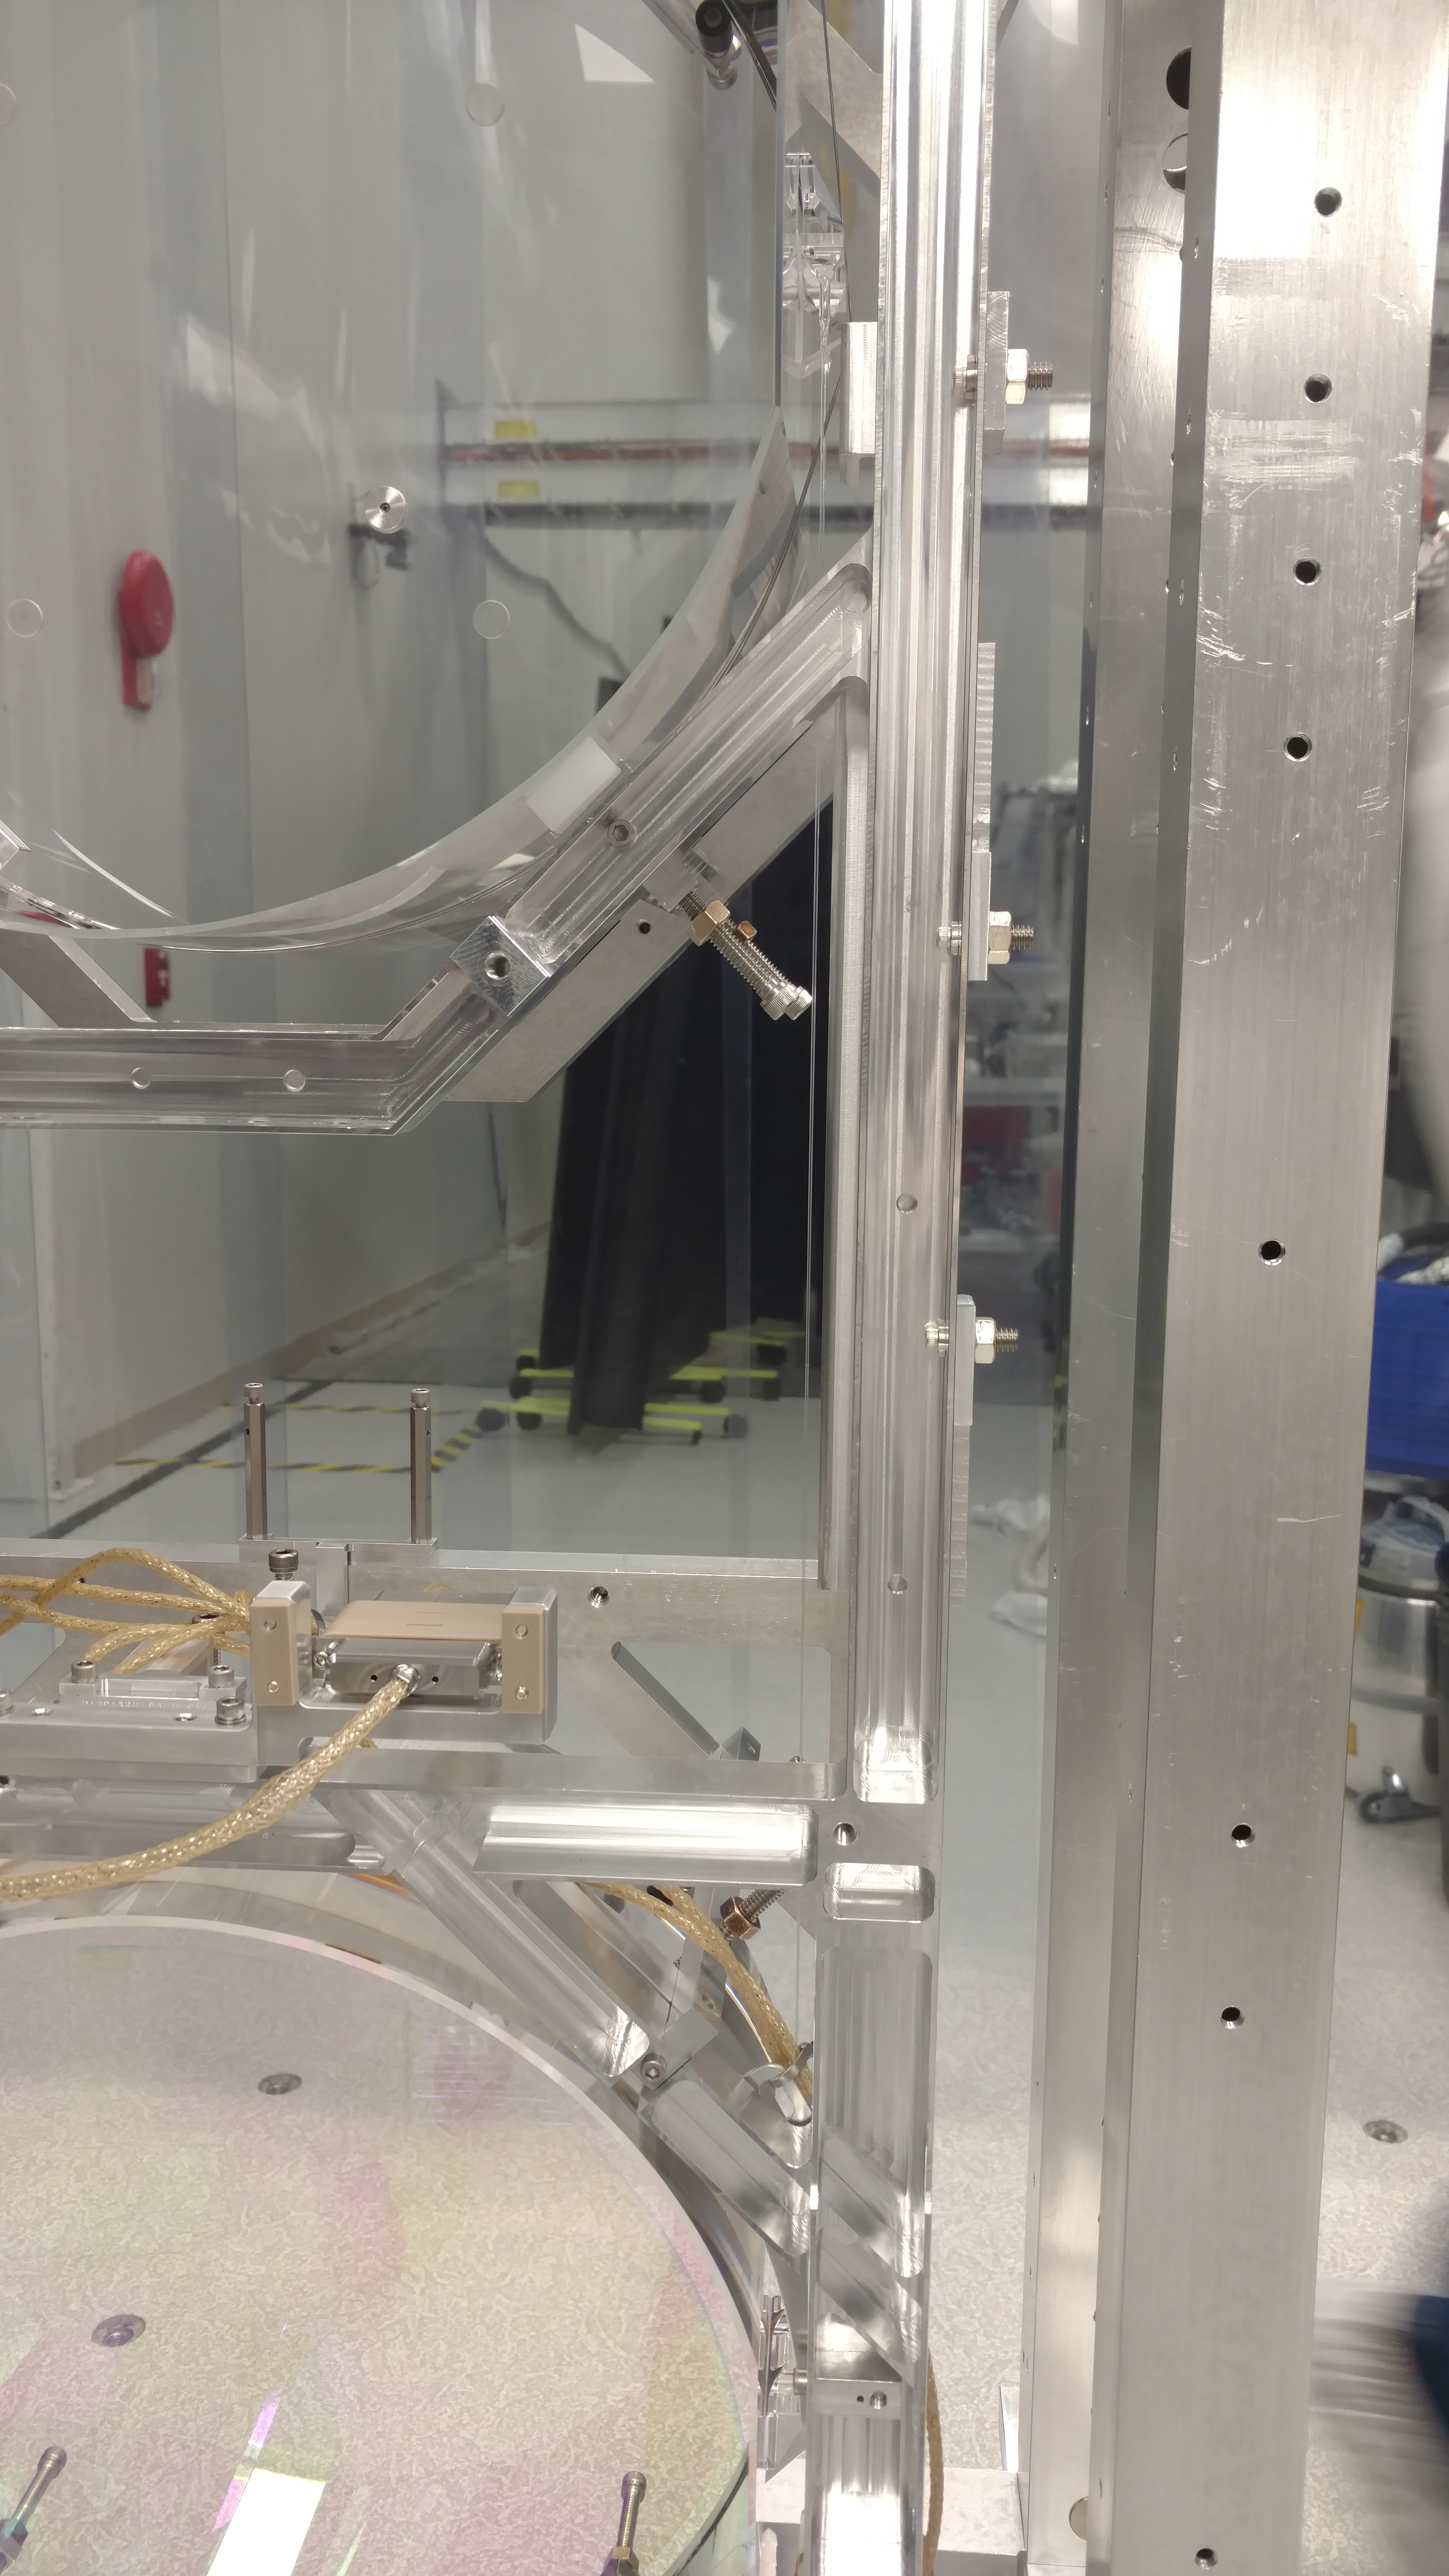
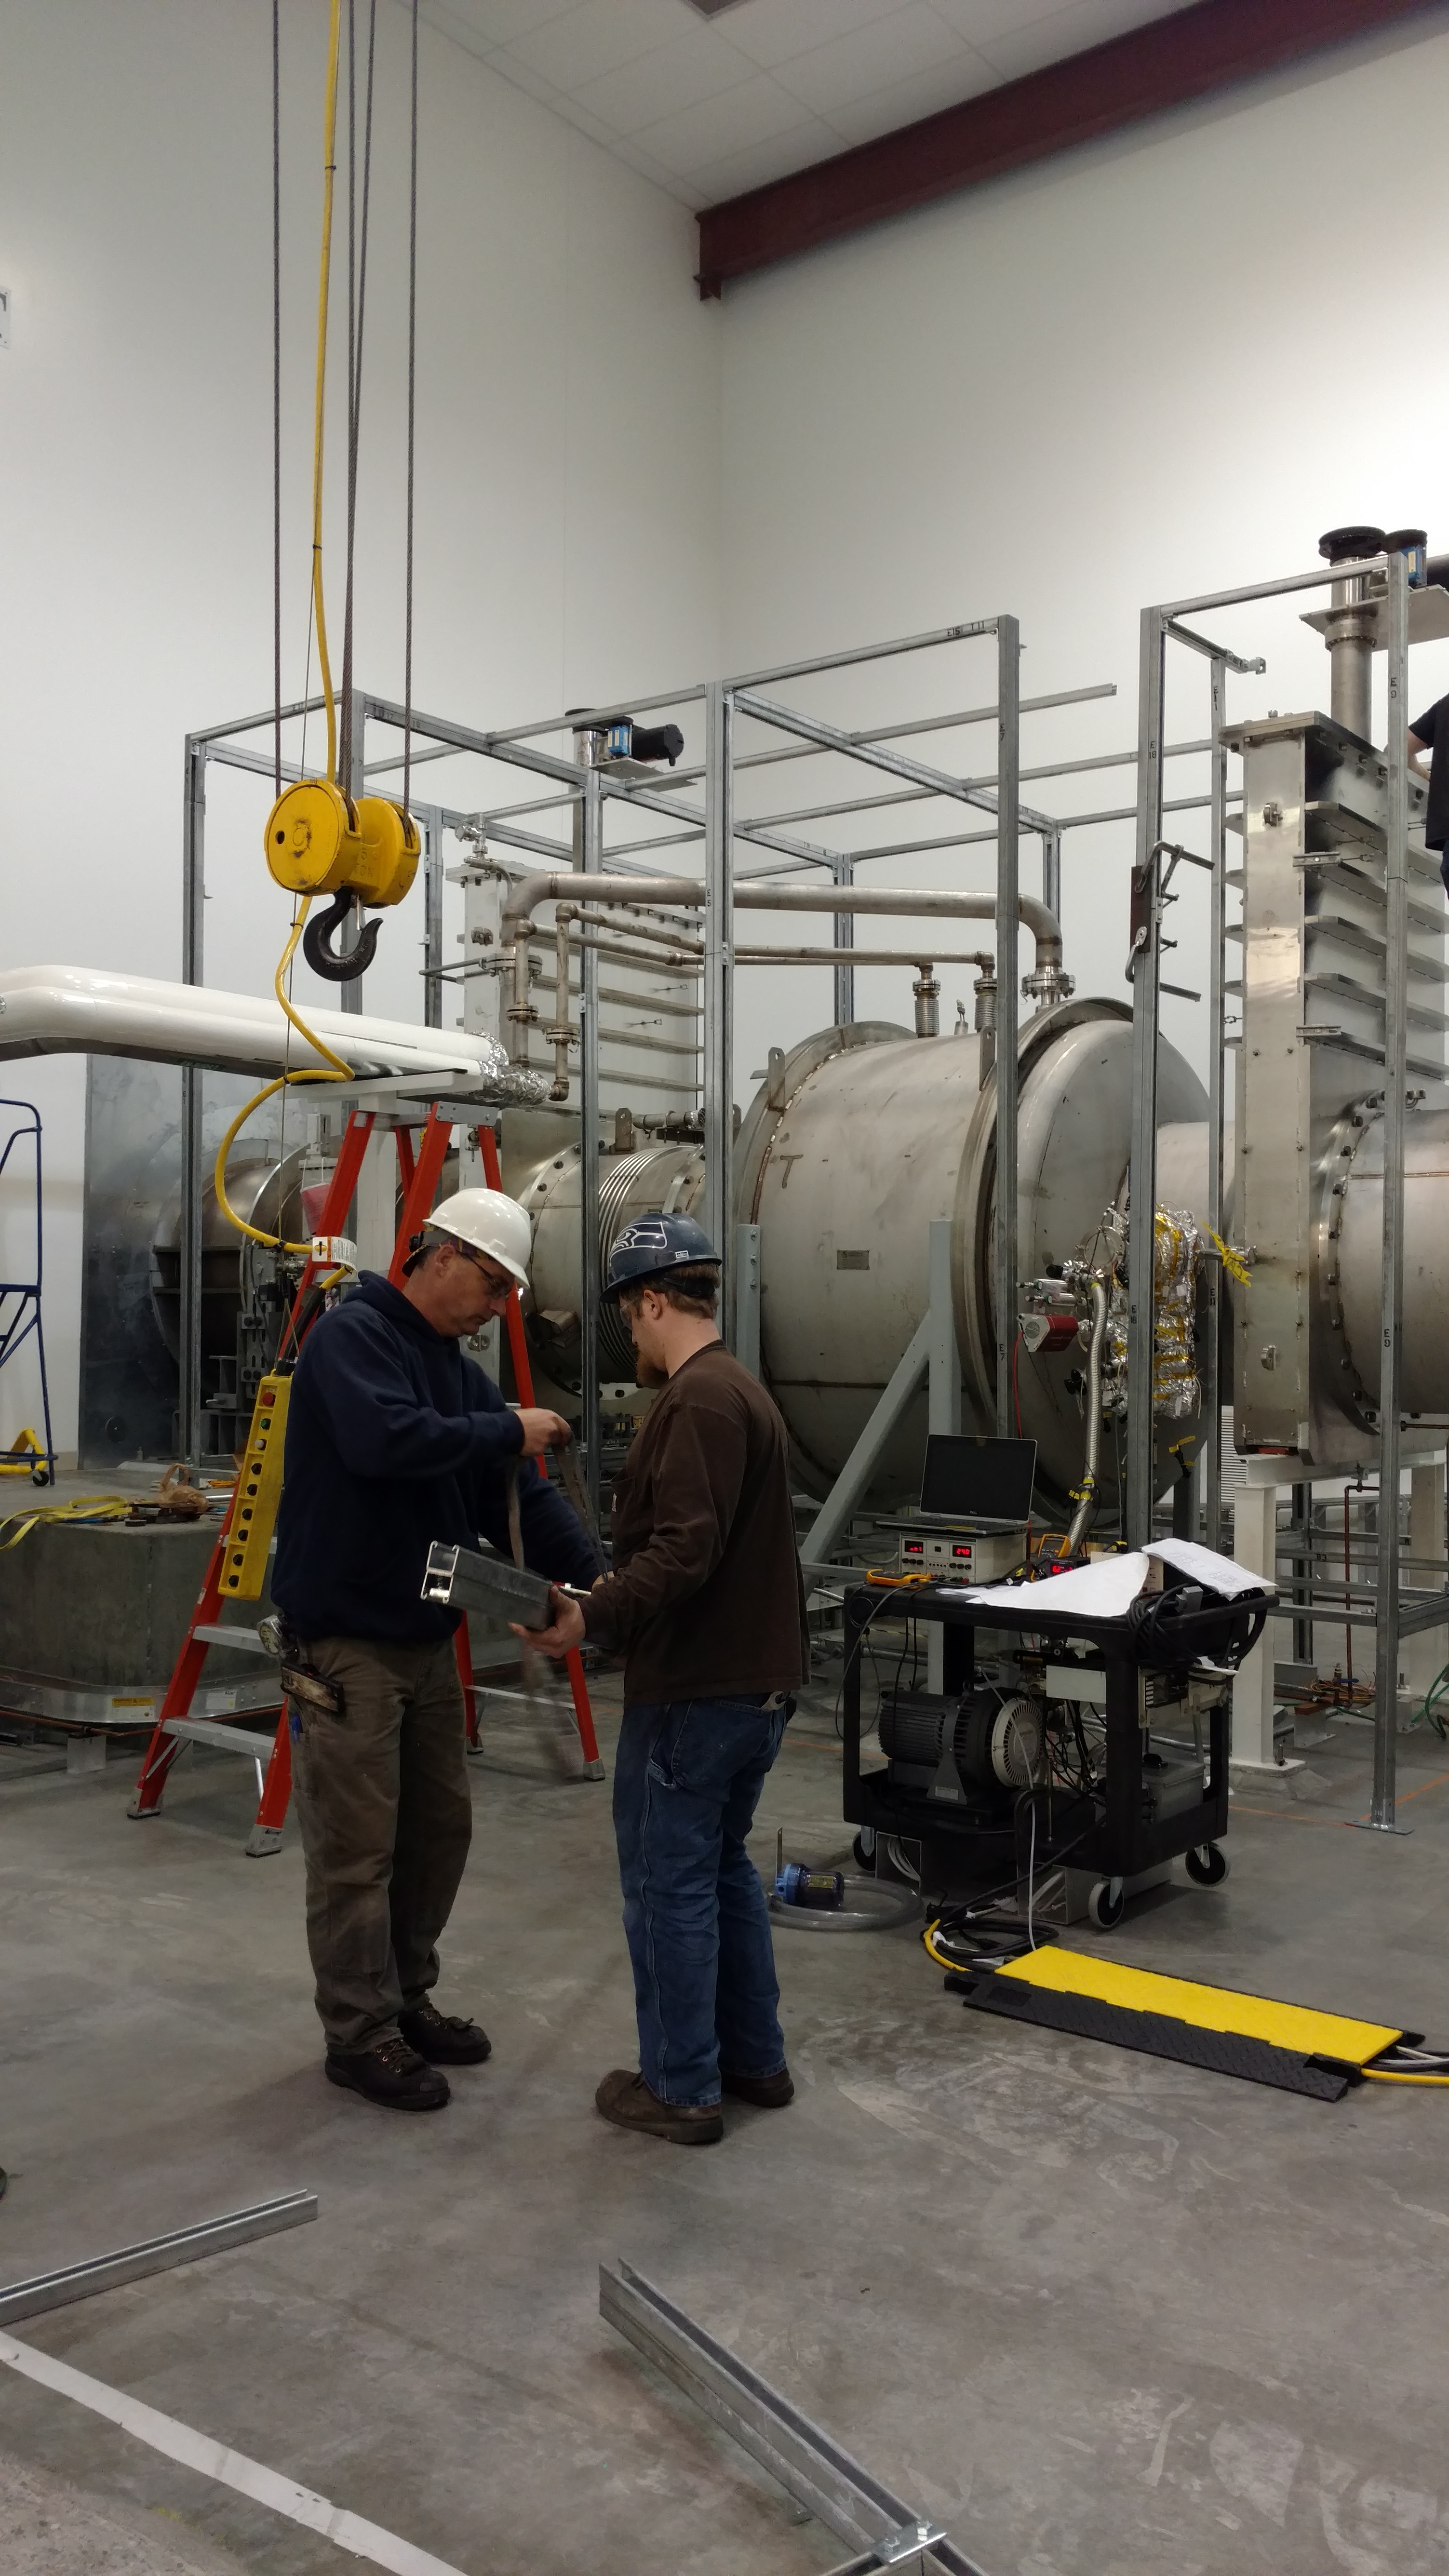
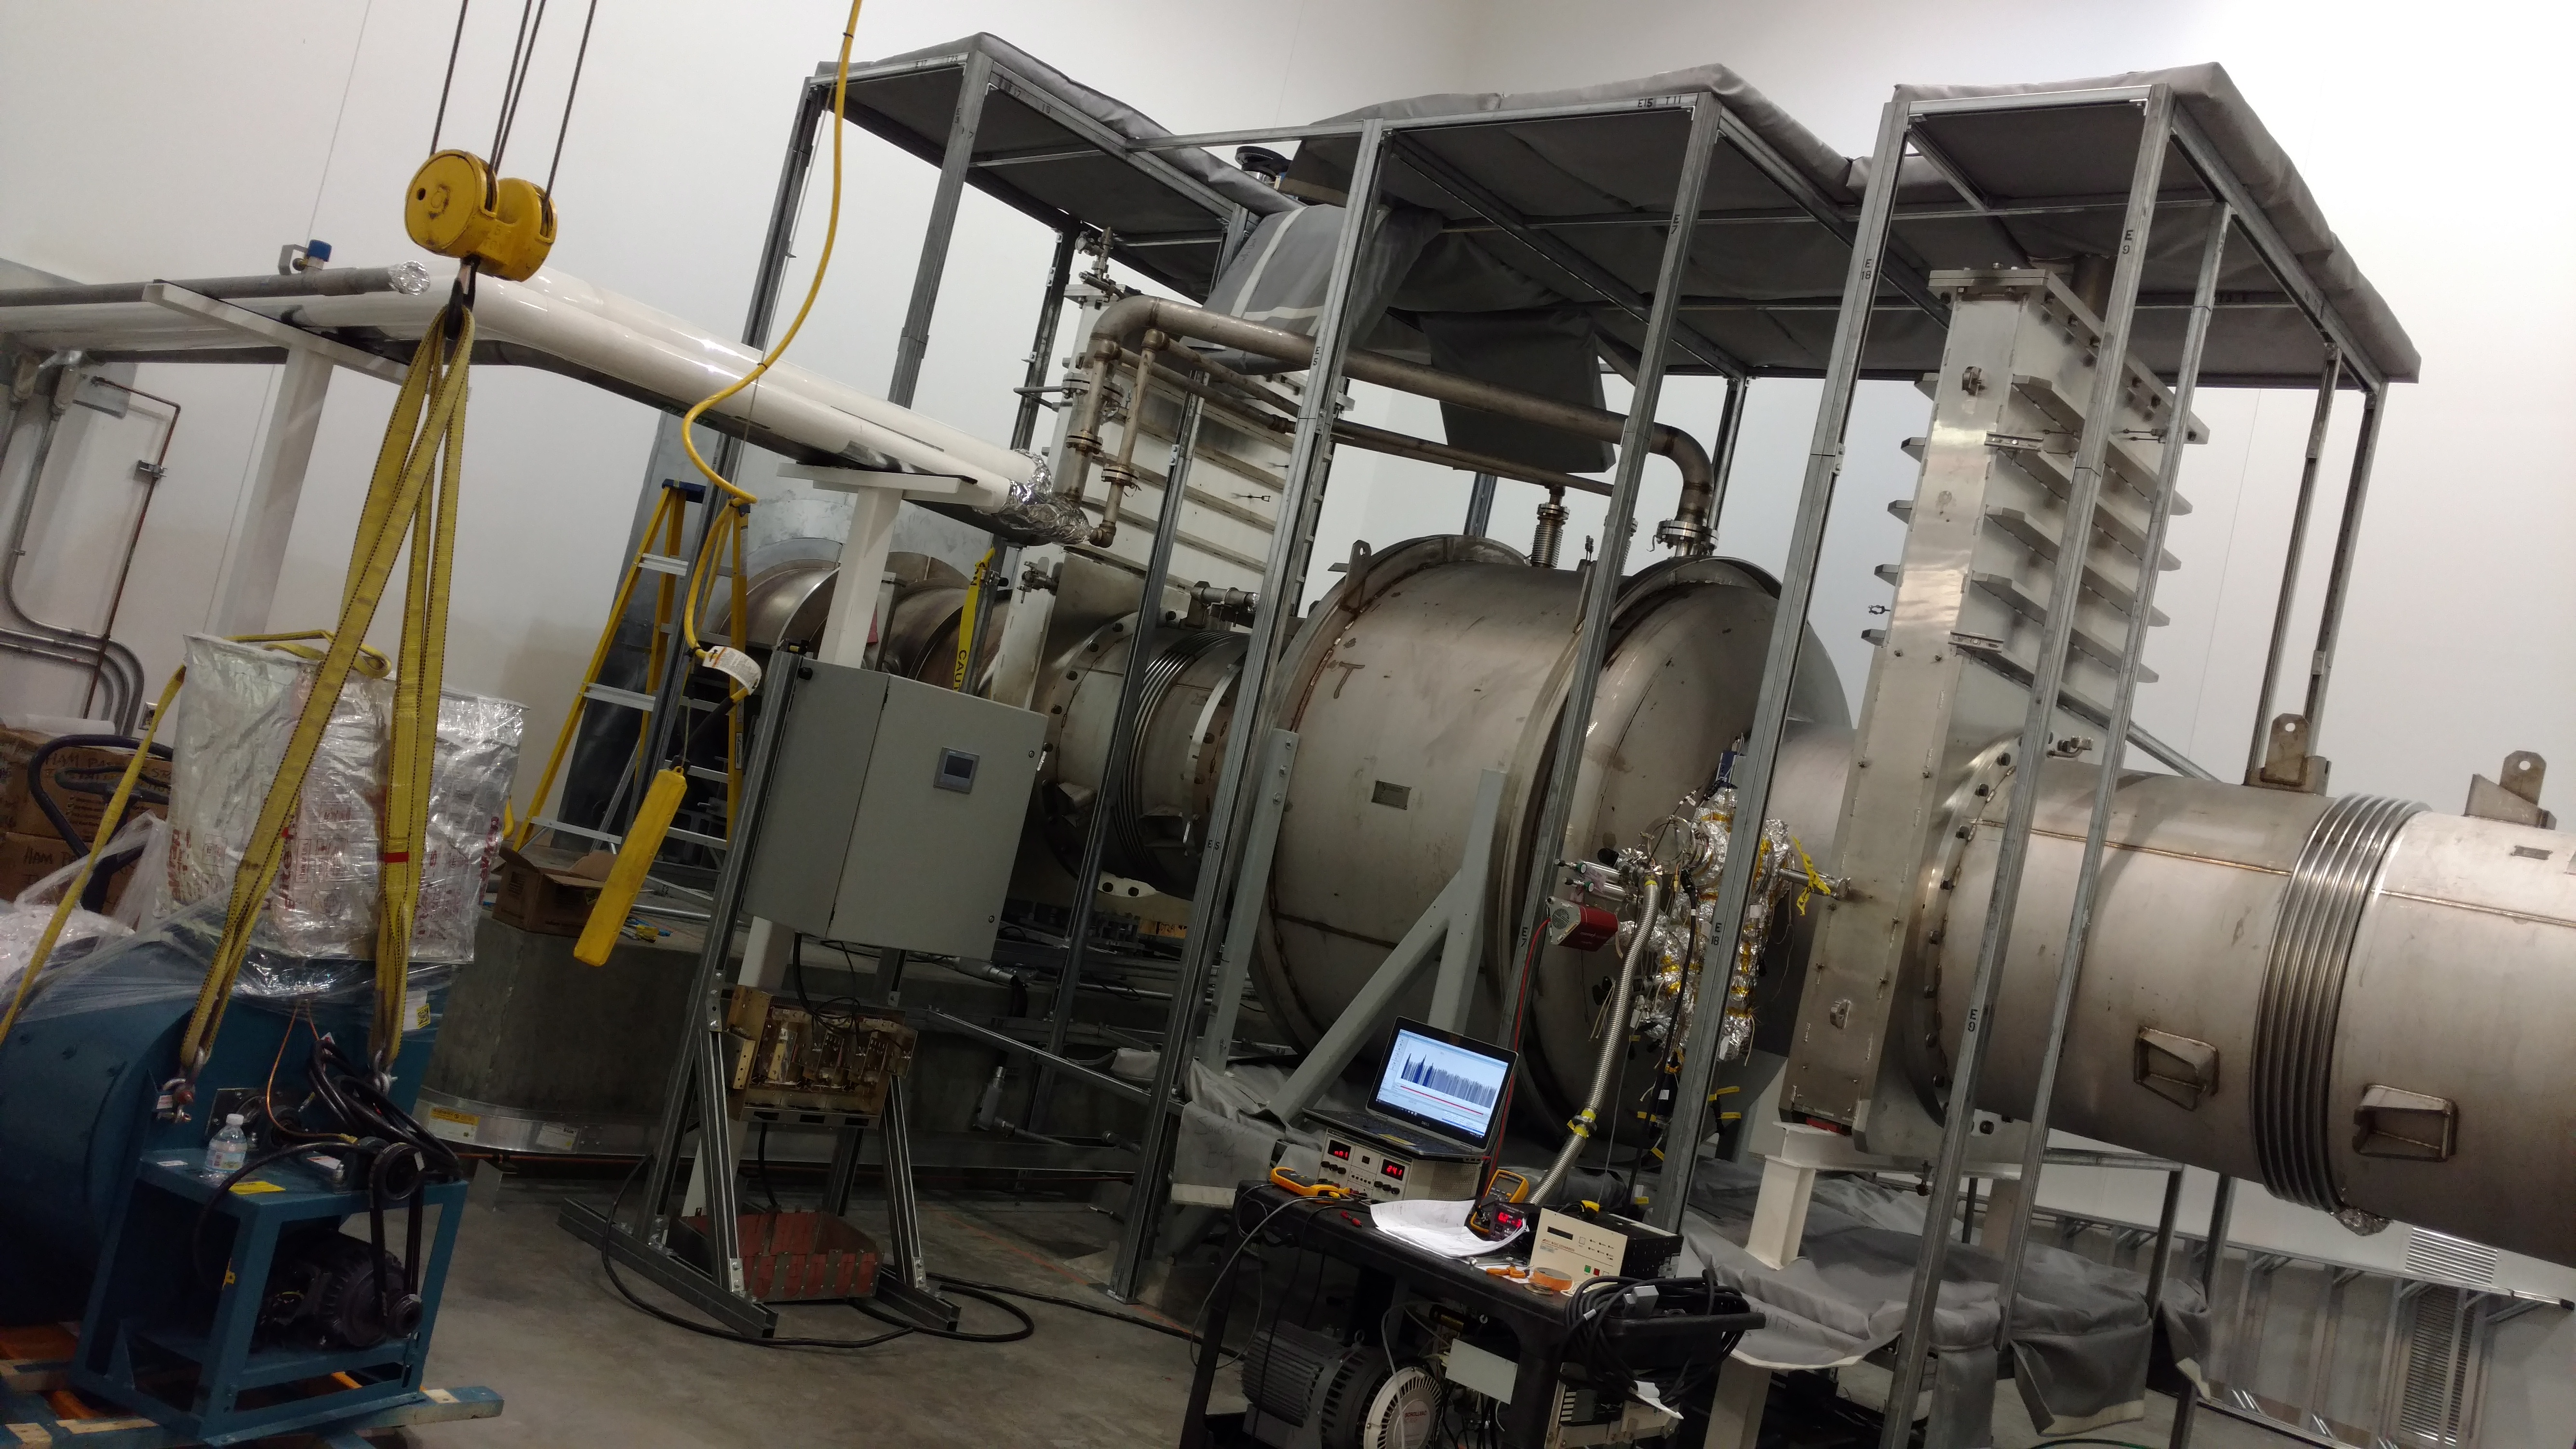
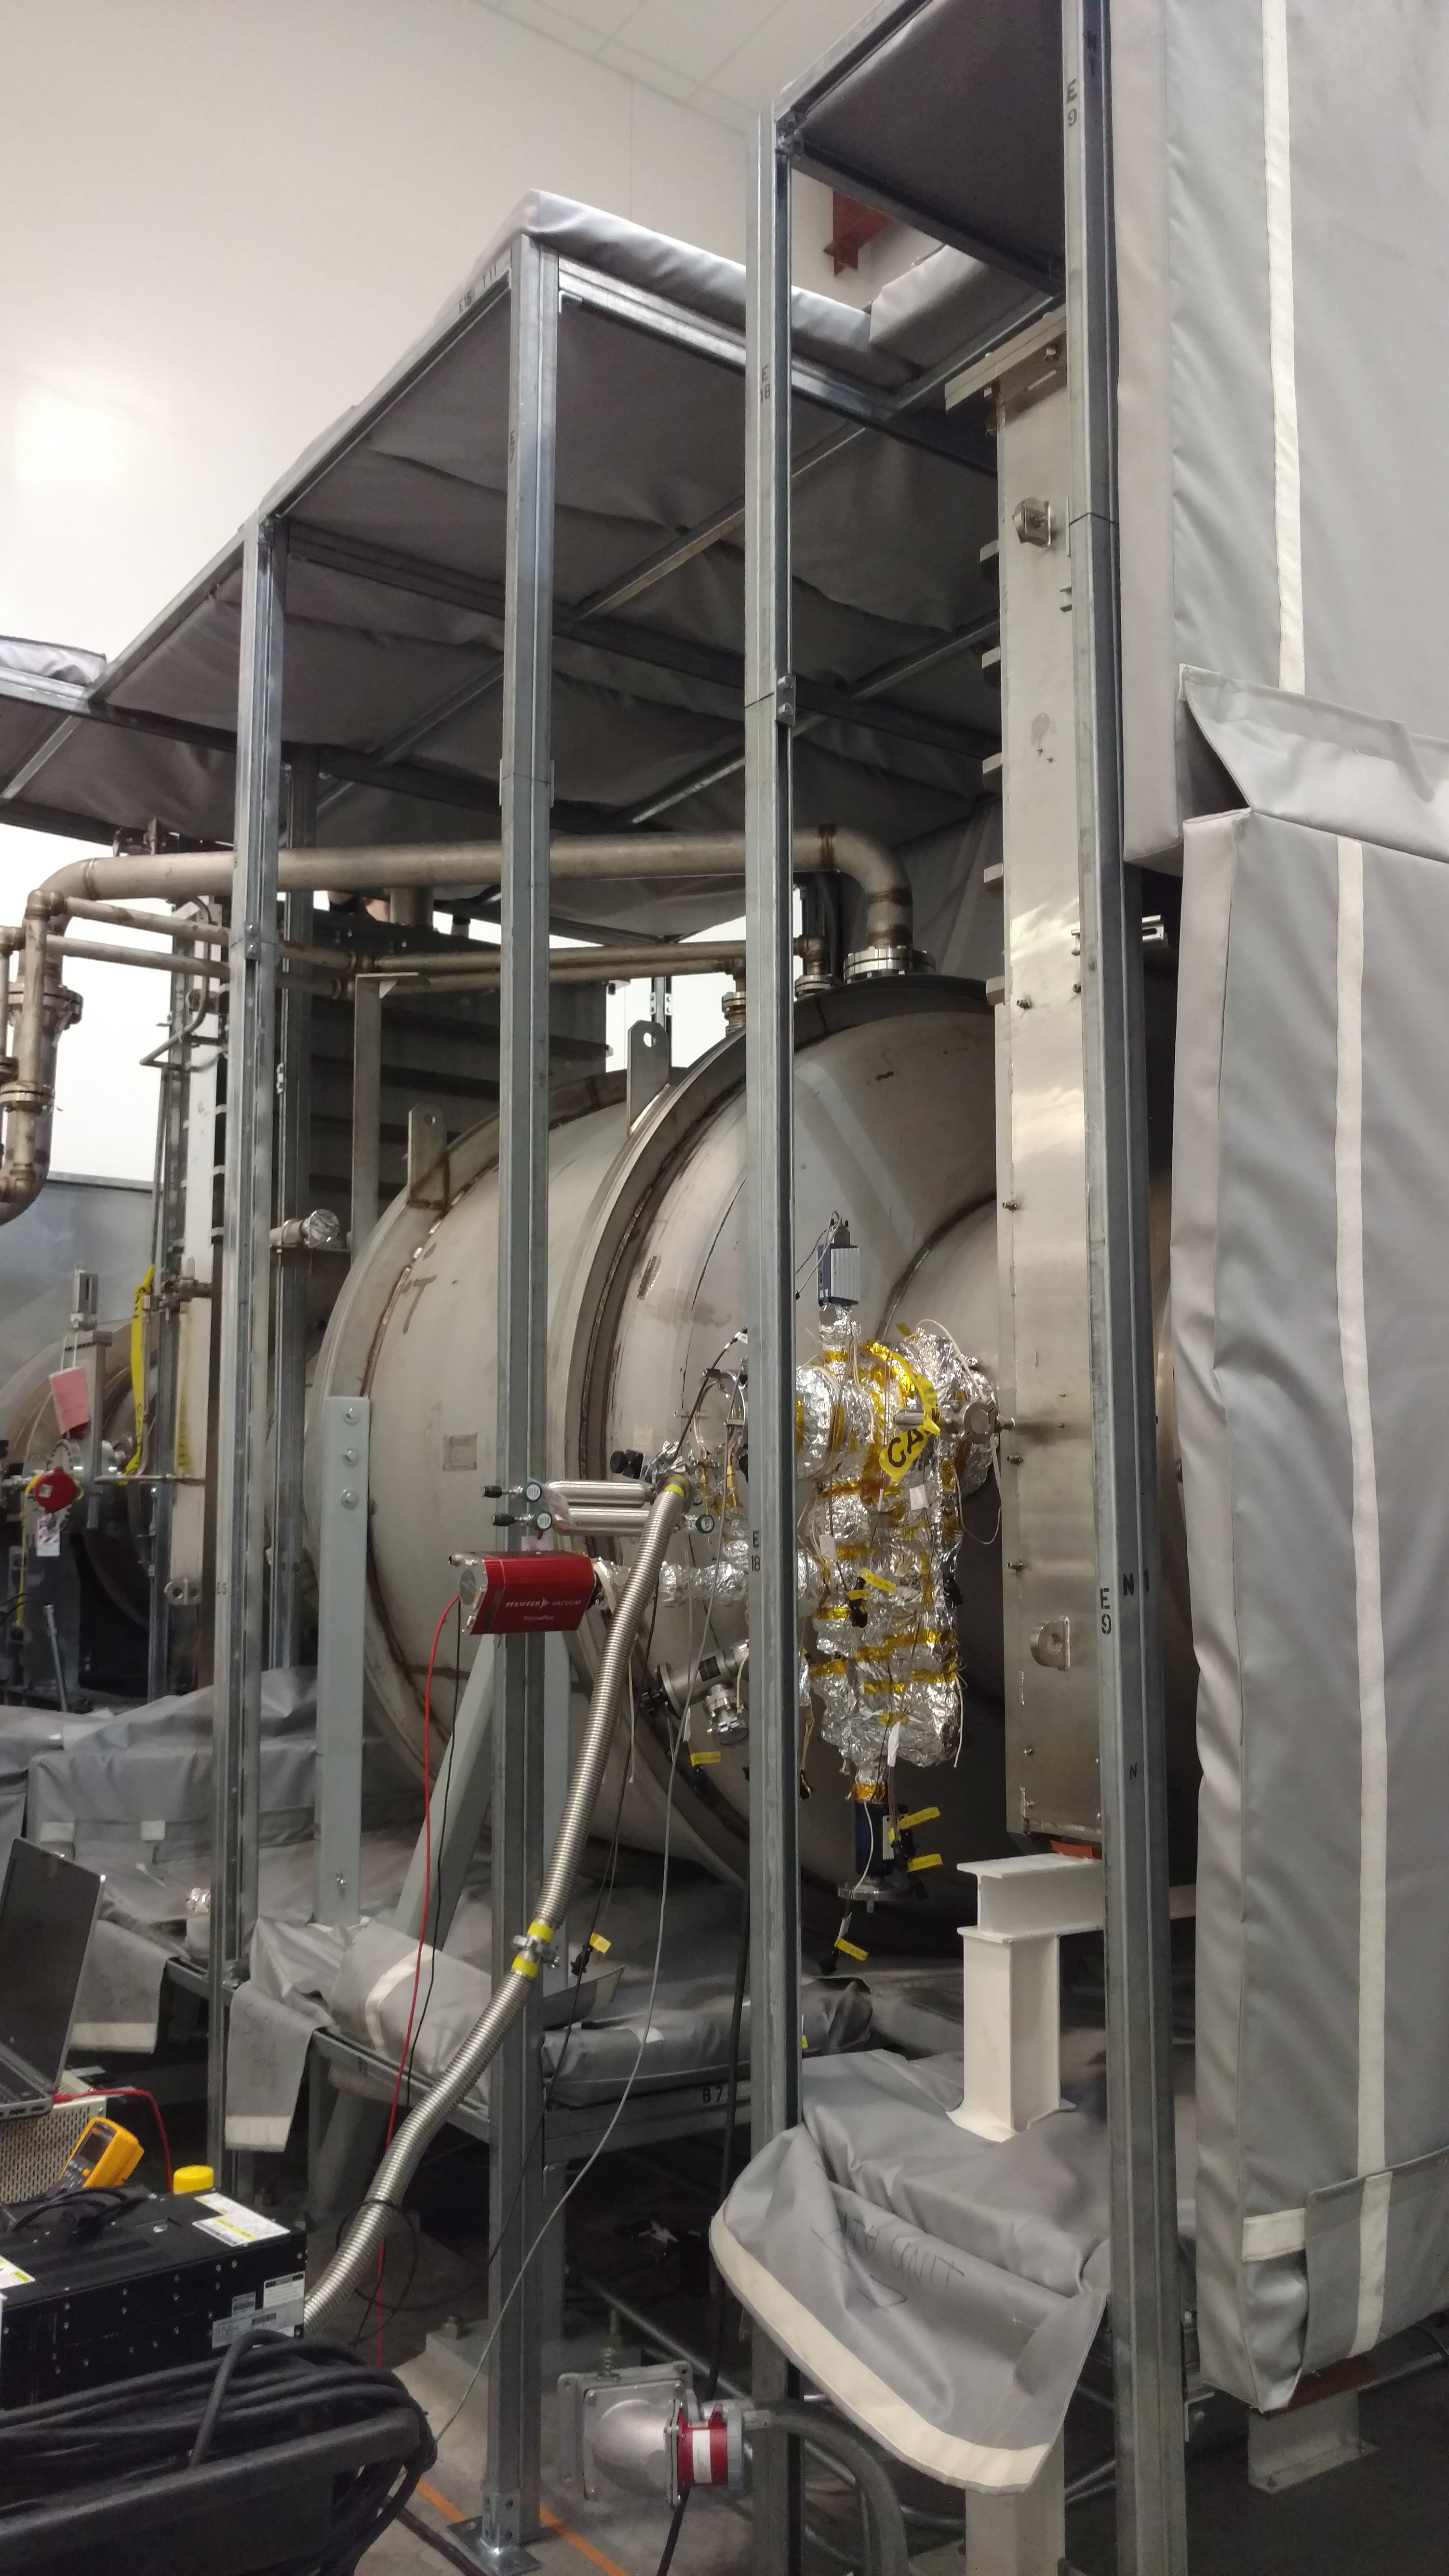
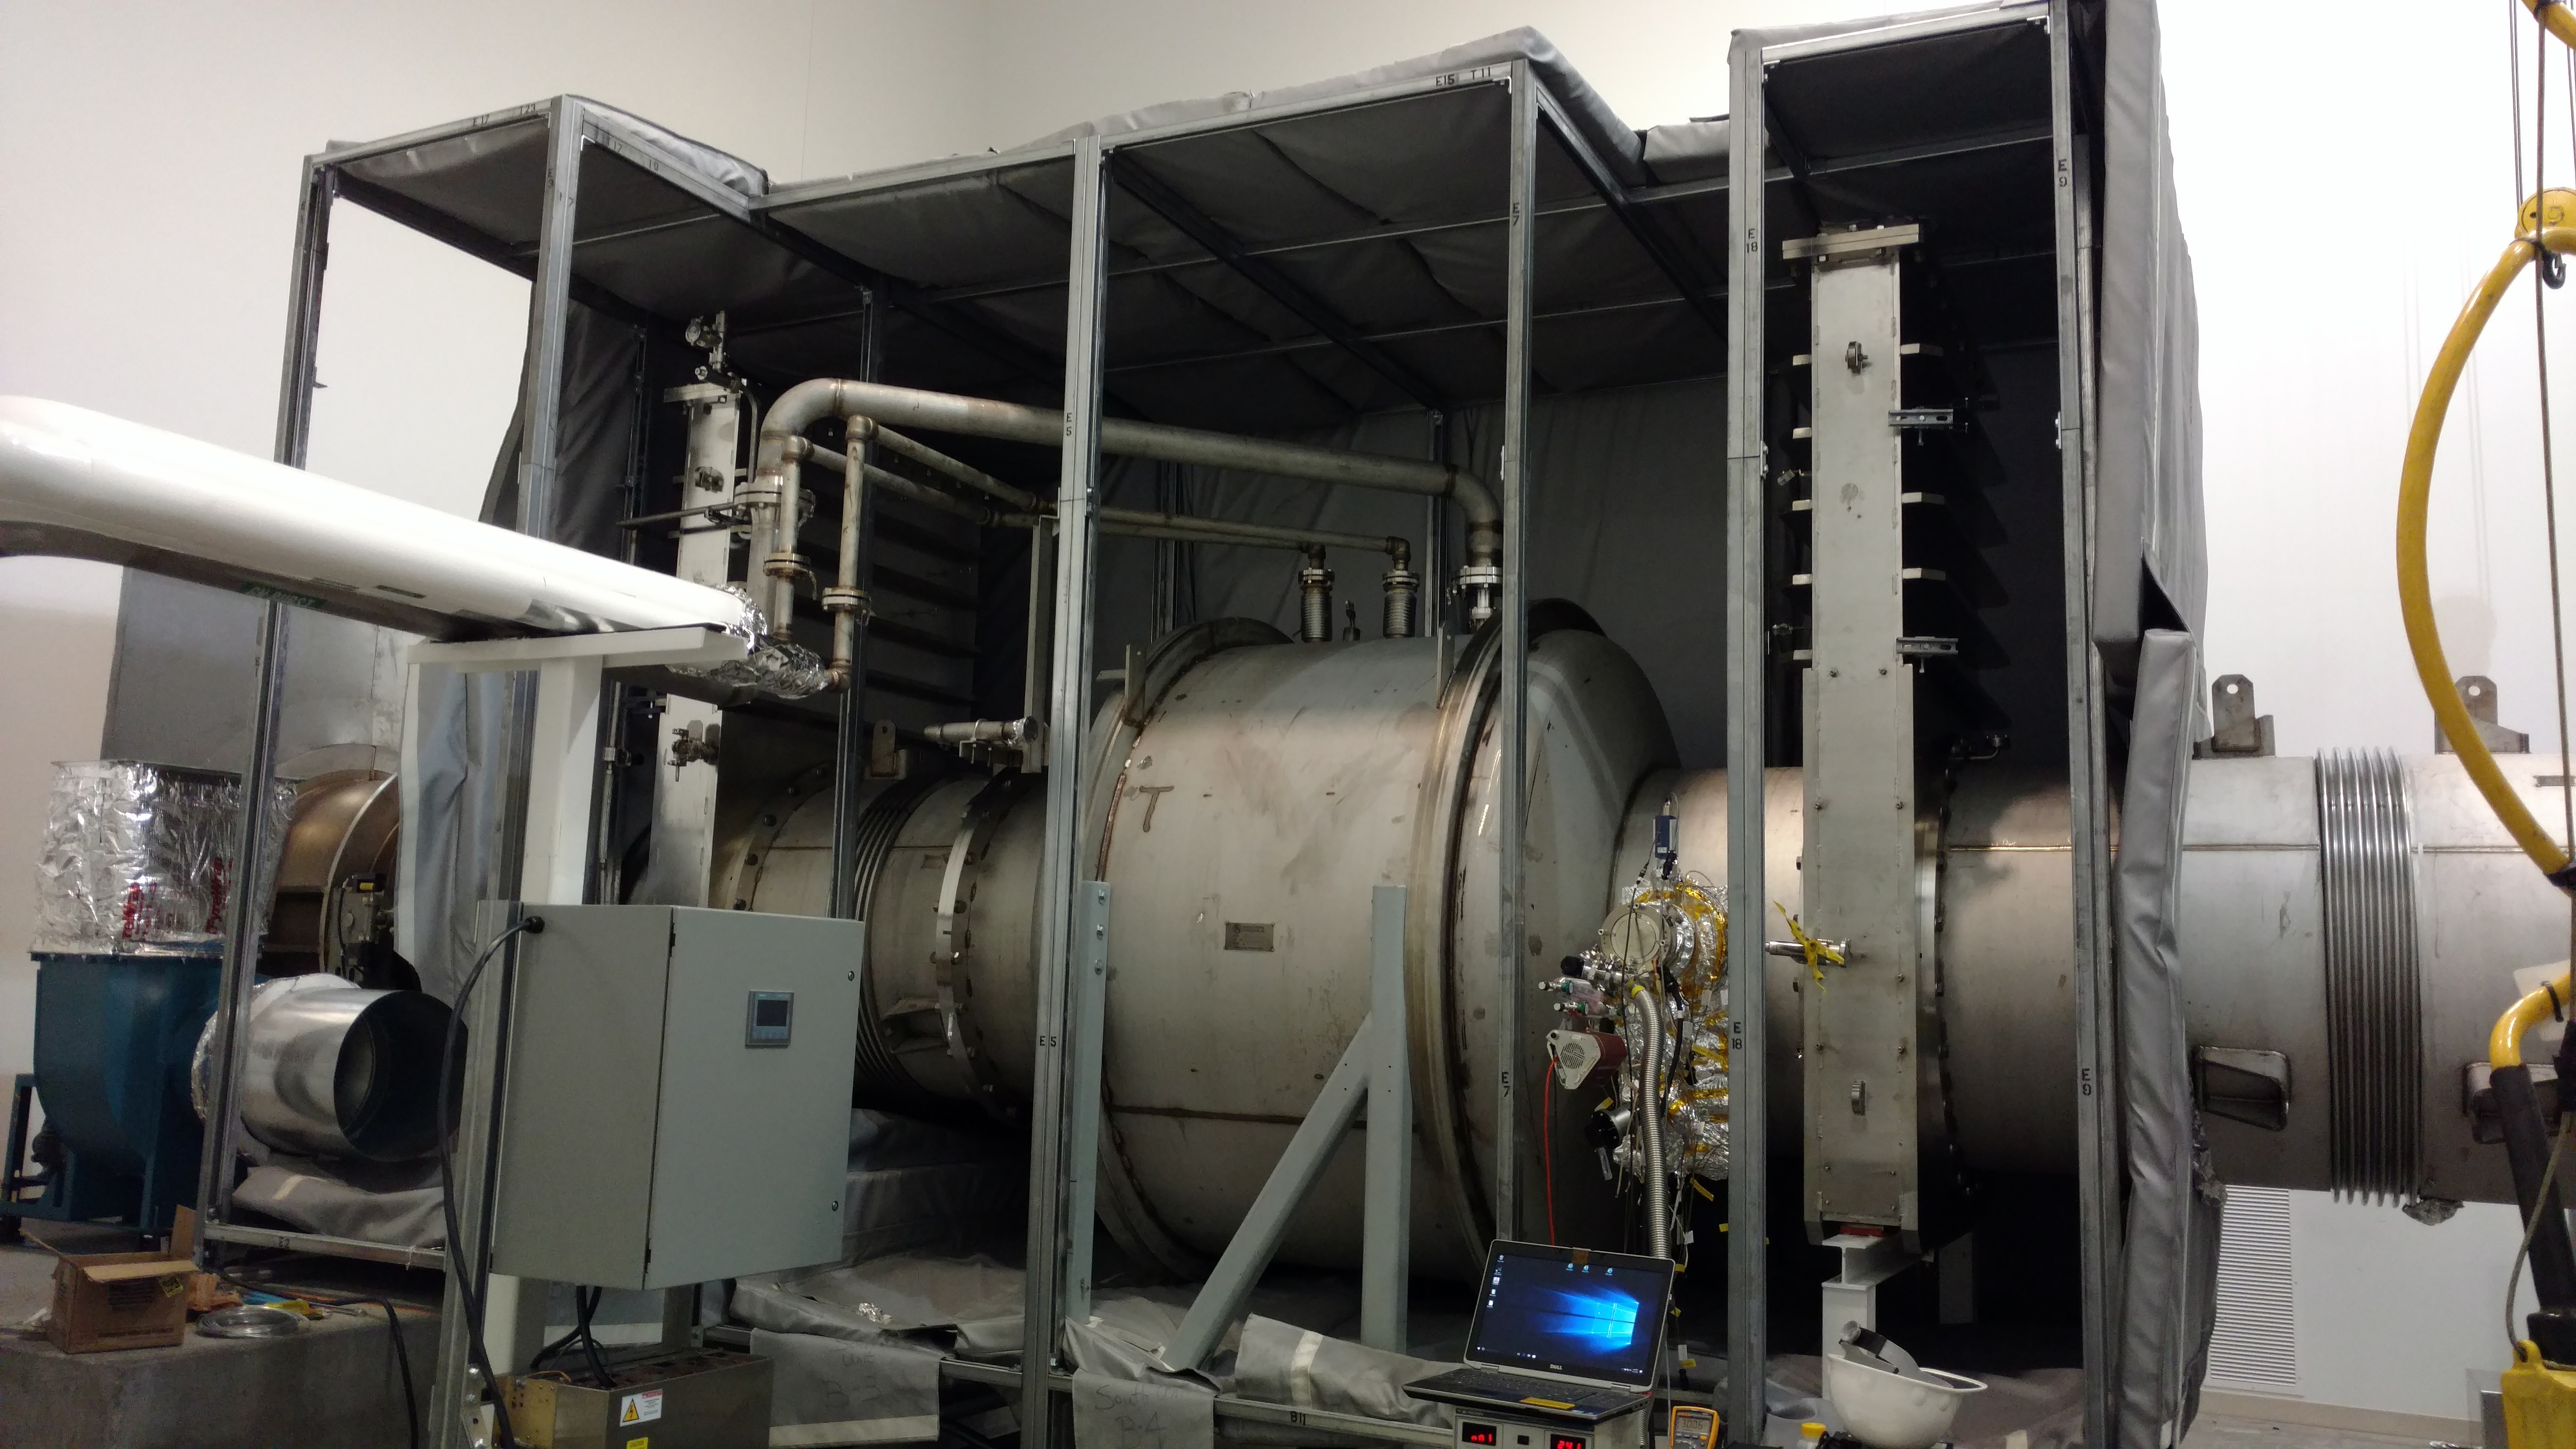
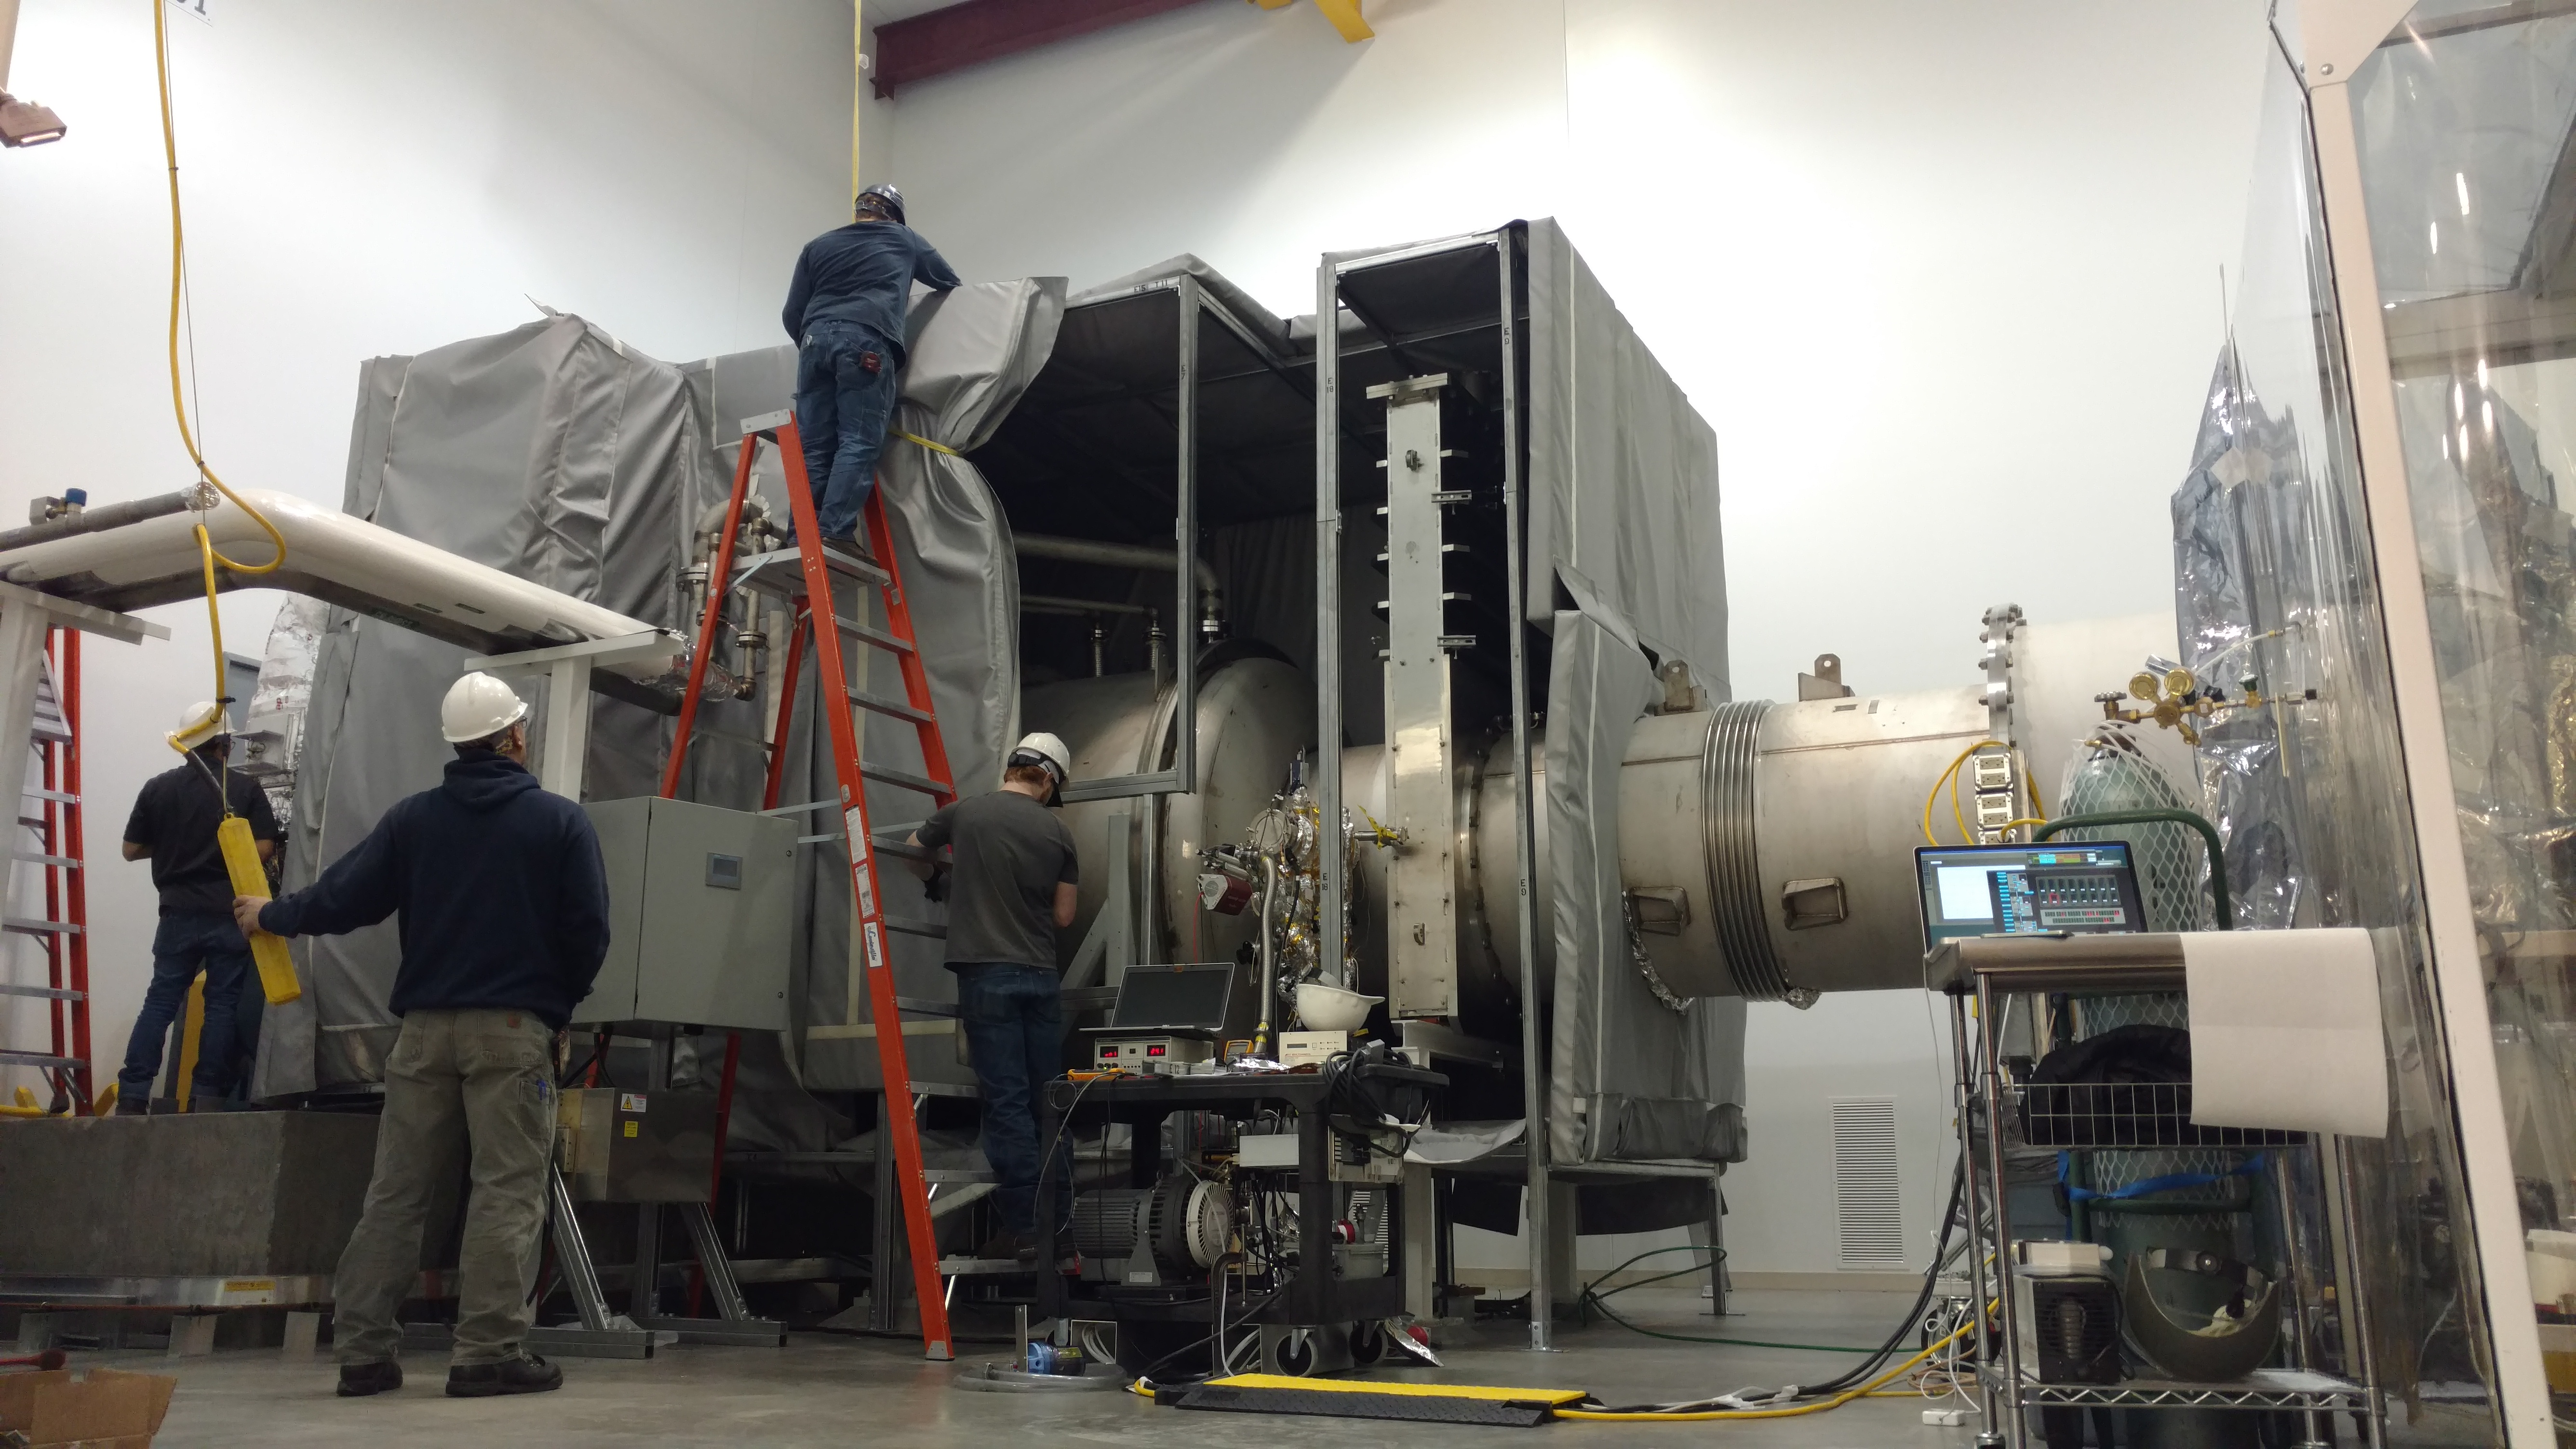
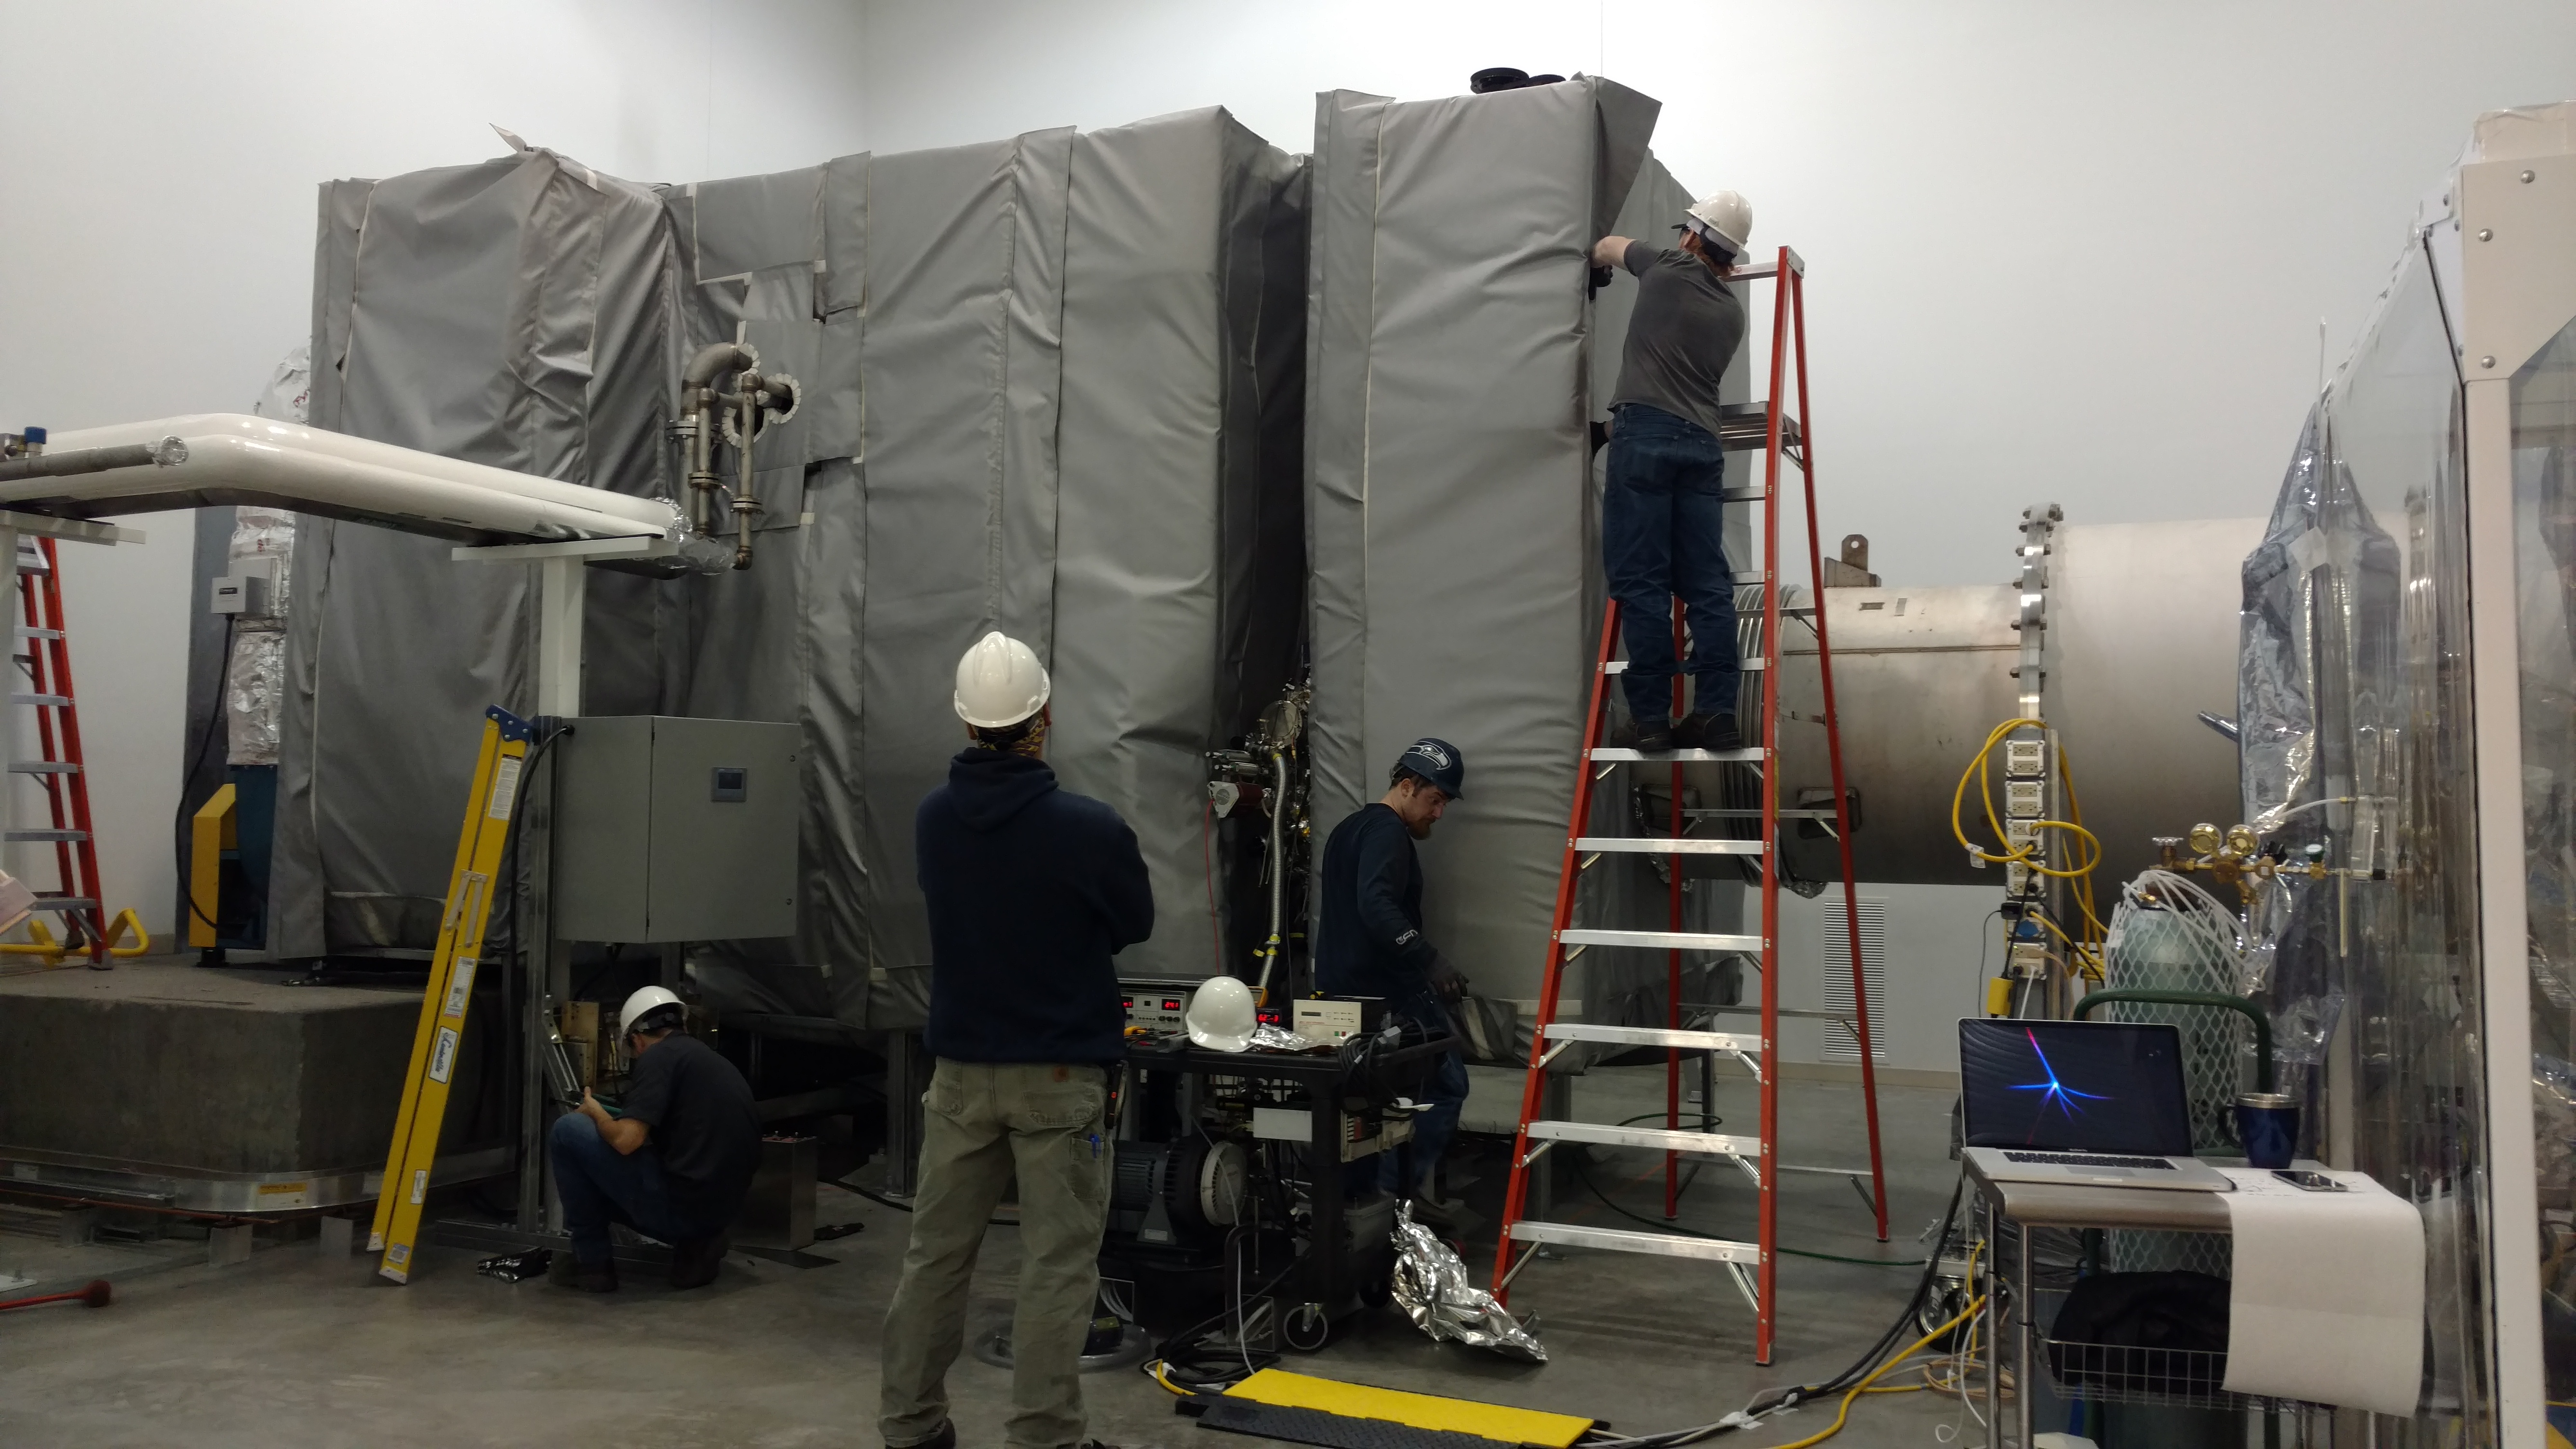
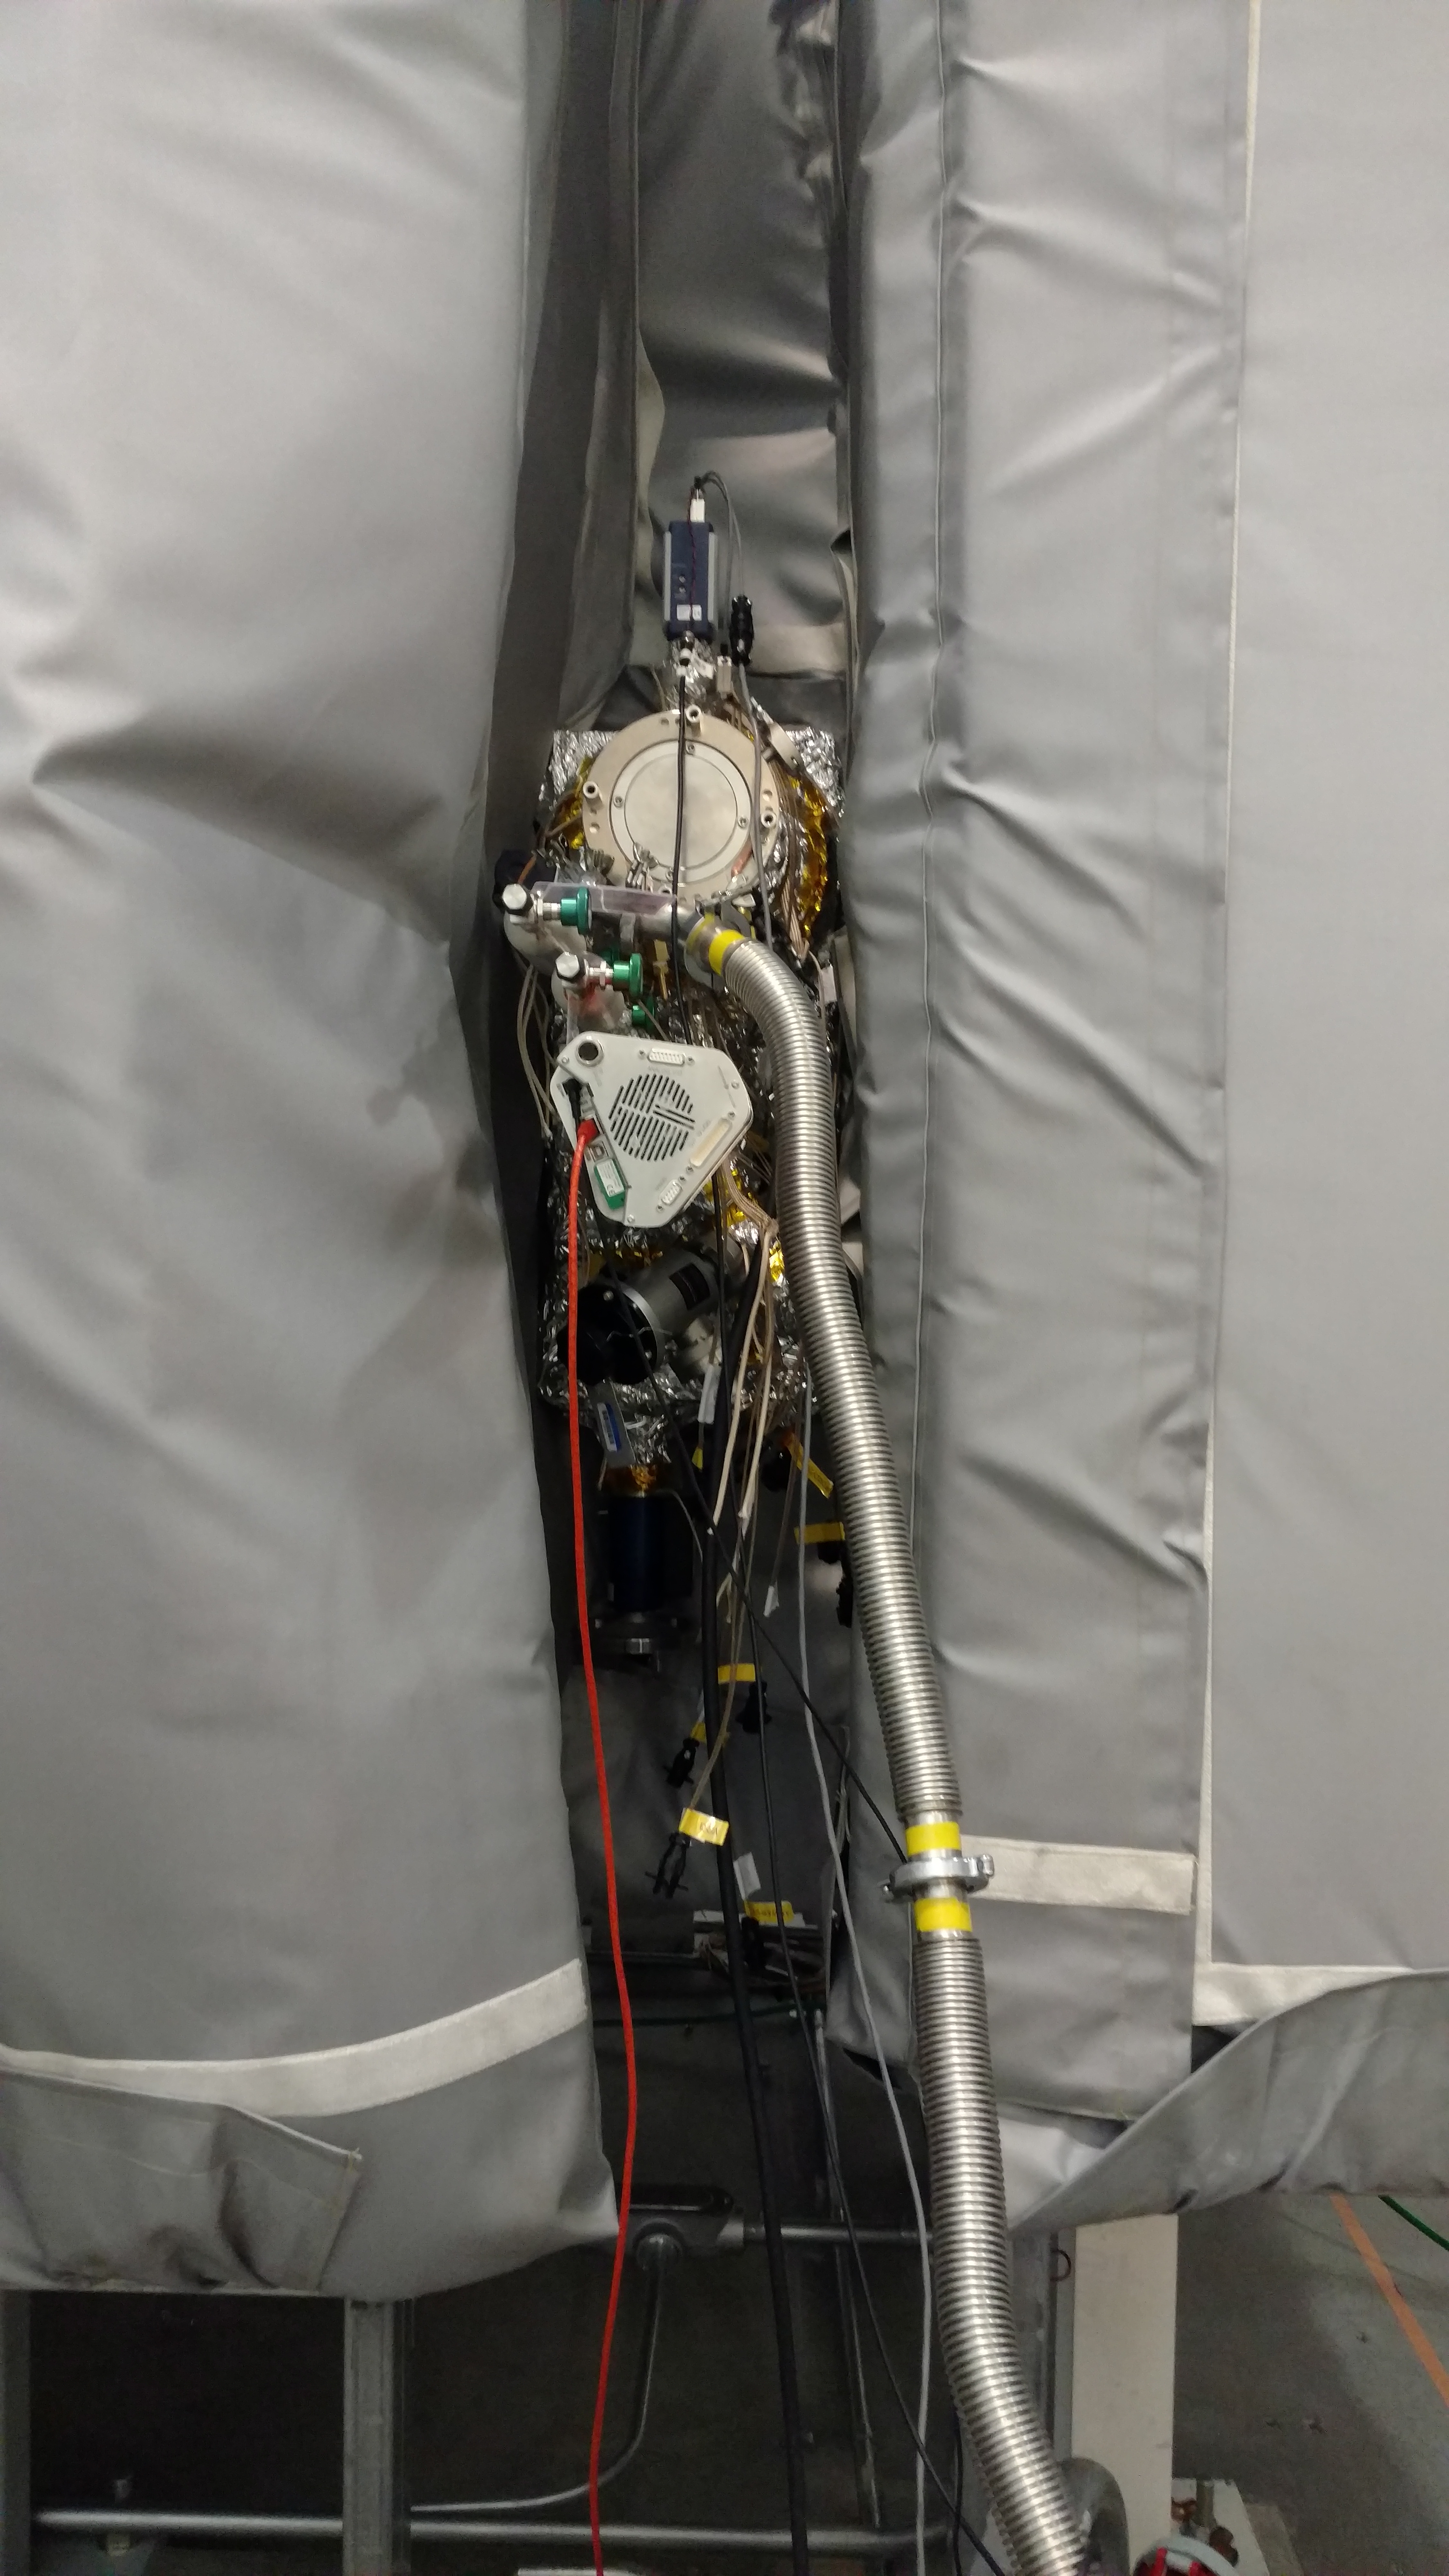
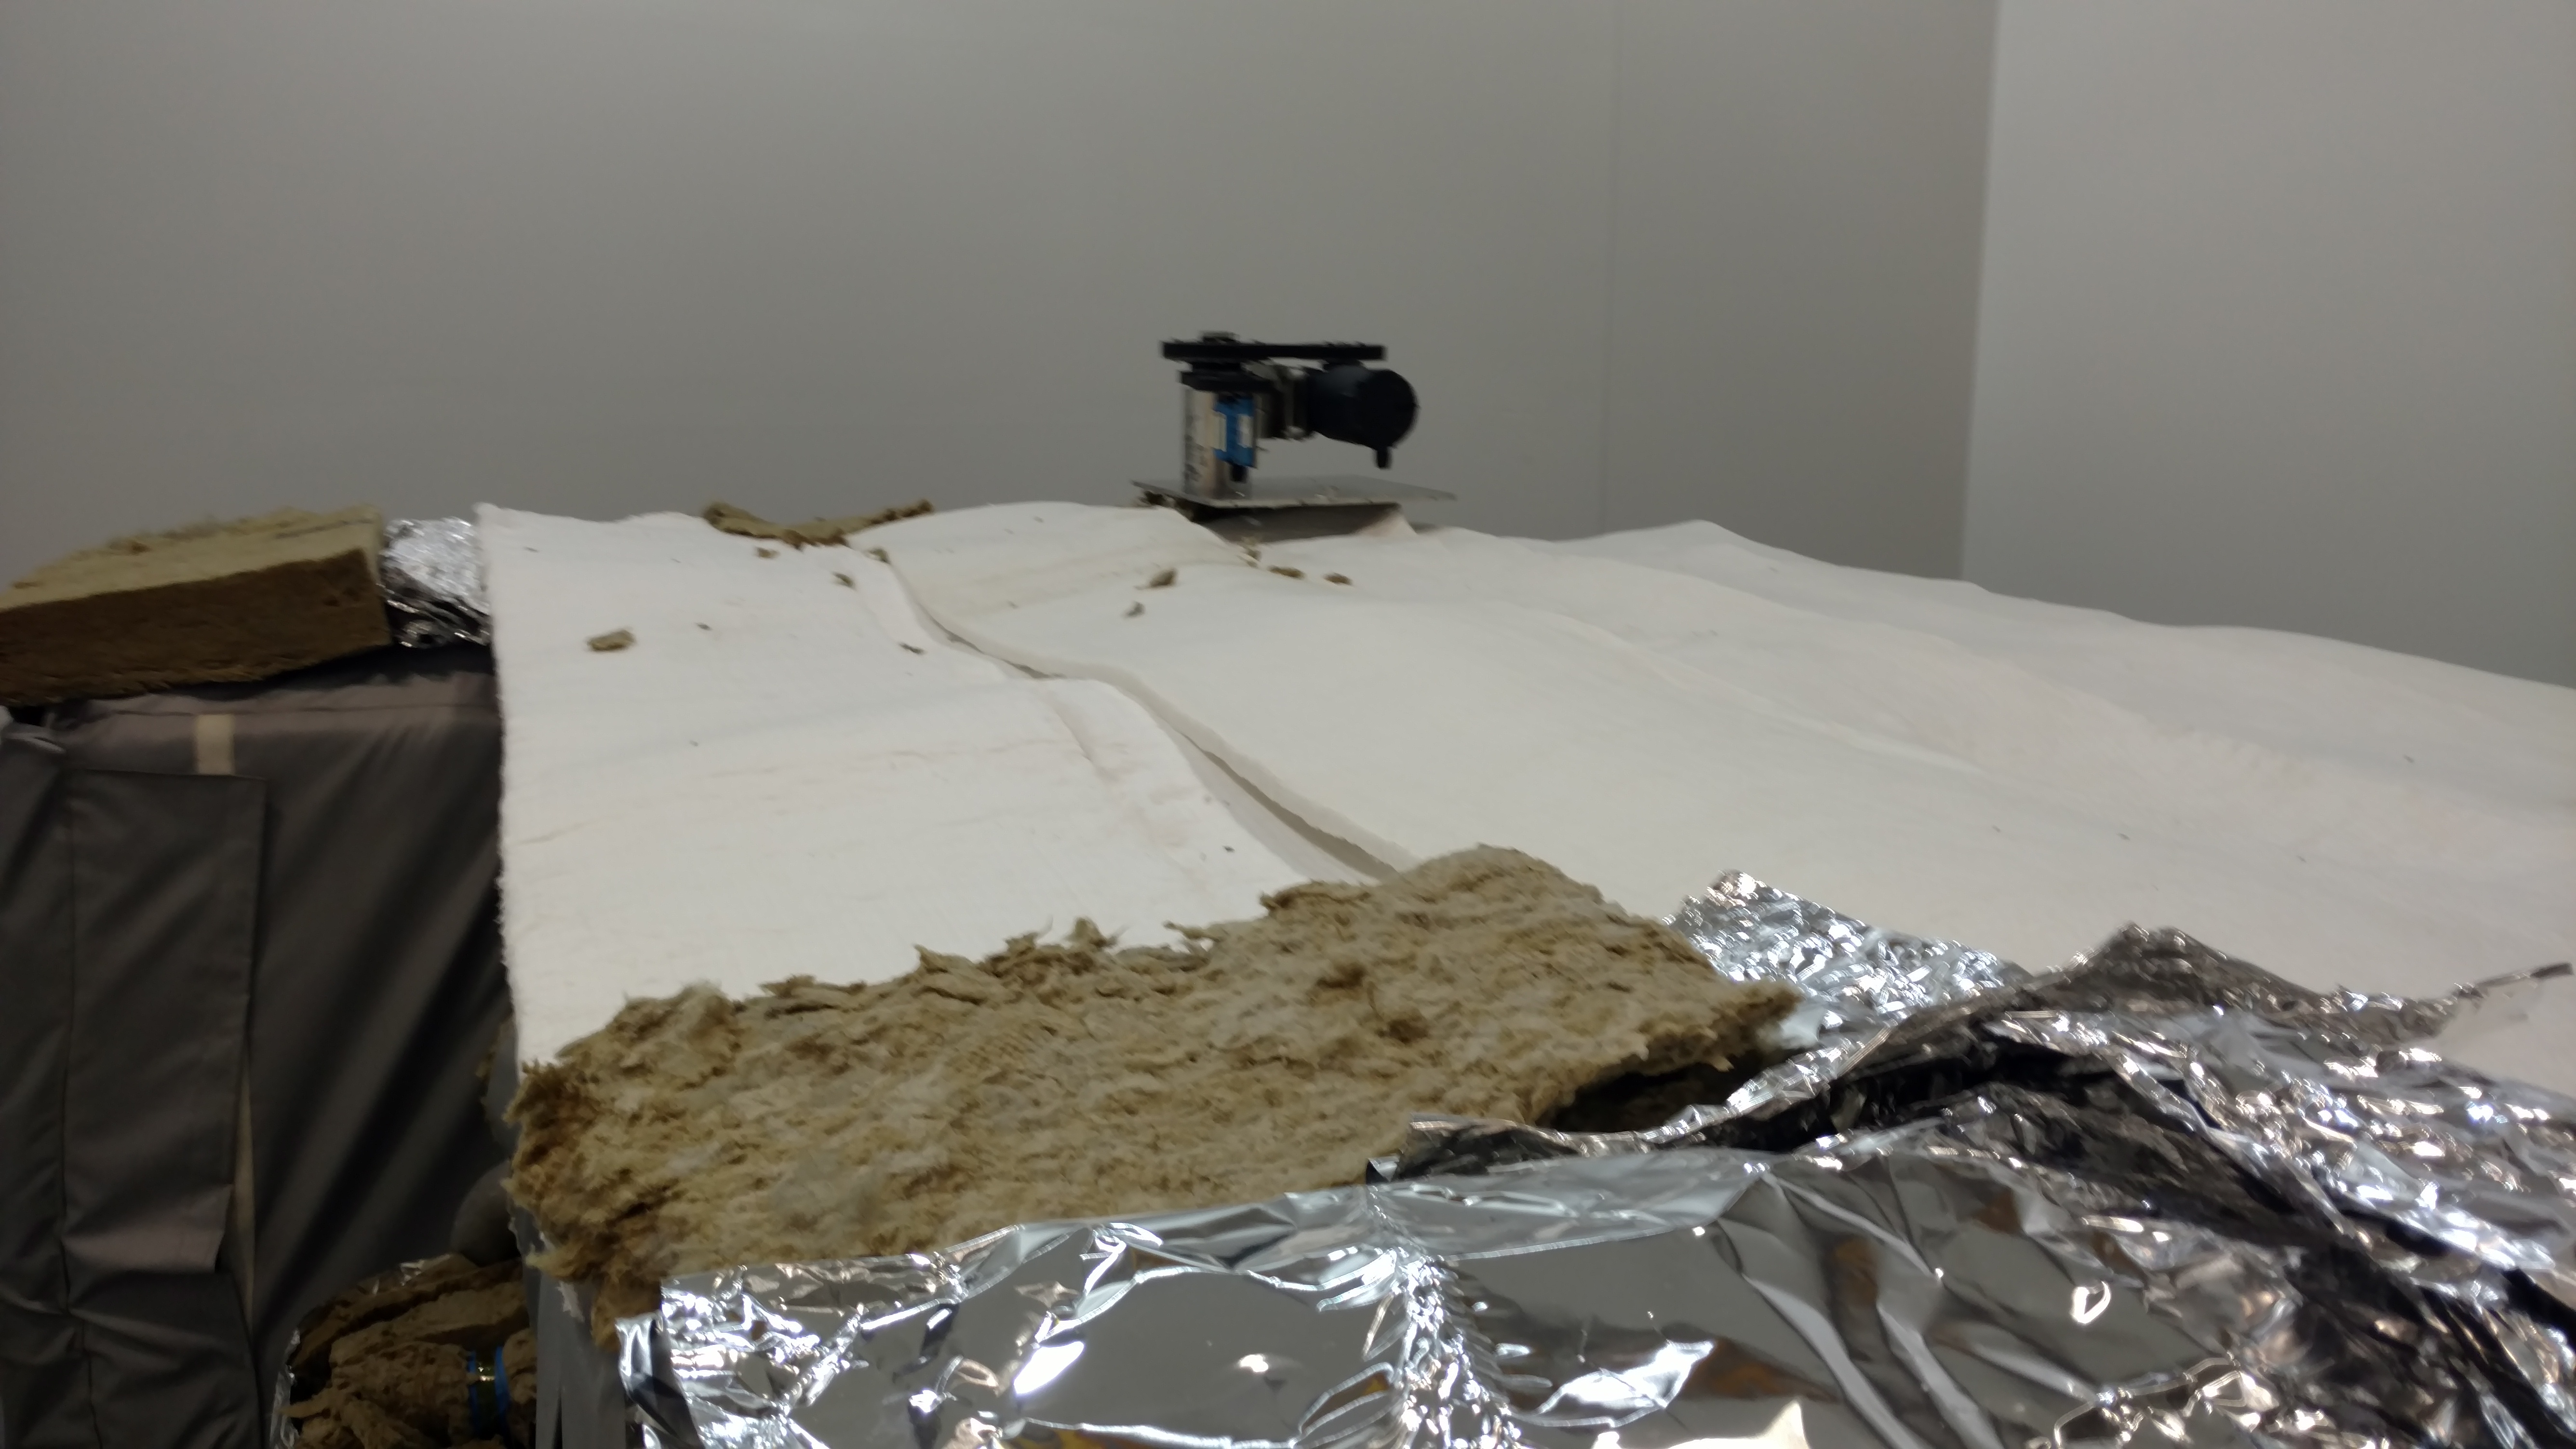
Here are some images to help clarify what we saw.
I can't find an up to date drawing of the HAM5 layout, but here is a preliminary drawing https://dcc.ligo.org/DocDB/0121/D1500303/002/HAM5.PNG, which shows ZM2 much further in the +y direction than it really is placed. In reality the beam from the OFI to ZM2 runs nearly parallel to the septum.
Here are some photos taken from the easternmost viewport on the north side of HAM 5 (the -y viewport on the +x side of HAM5). The first photo is a blurry overview of what we can see, the fly off mirror for the squeezed beam is in the center (there is a black glass clip on the back of the mirror), behind that you can see the cage of ZM2. The violet looking thing that is just peaking over the black glass clip is our beam or scatter from our beam.
The second photo shows that at some alignments on ZM1/ZM2, we can see a quite bright thing in HAM5 which is probably our beam. The fourth photo shows an alignment for ZM1 for which the beam clips on the bracket for the eddy current damper on ZM2, while the third photo shows an alignment of ZM1 where we think the beam should be hitting ZM2. You can see some difuse IR light, and what looks like the outline of the black glass clip in that scattered light. This seems like a good candidate for our best alignment, you might think that this scatter means that the beam is hitting or nearly hitting the fly off mirror with the black glass clip, however, we saw nothing in HAM6 for this alignment.
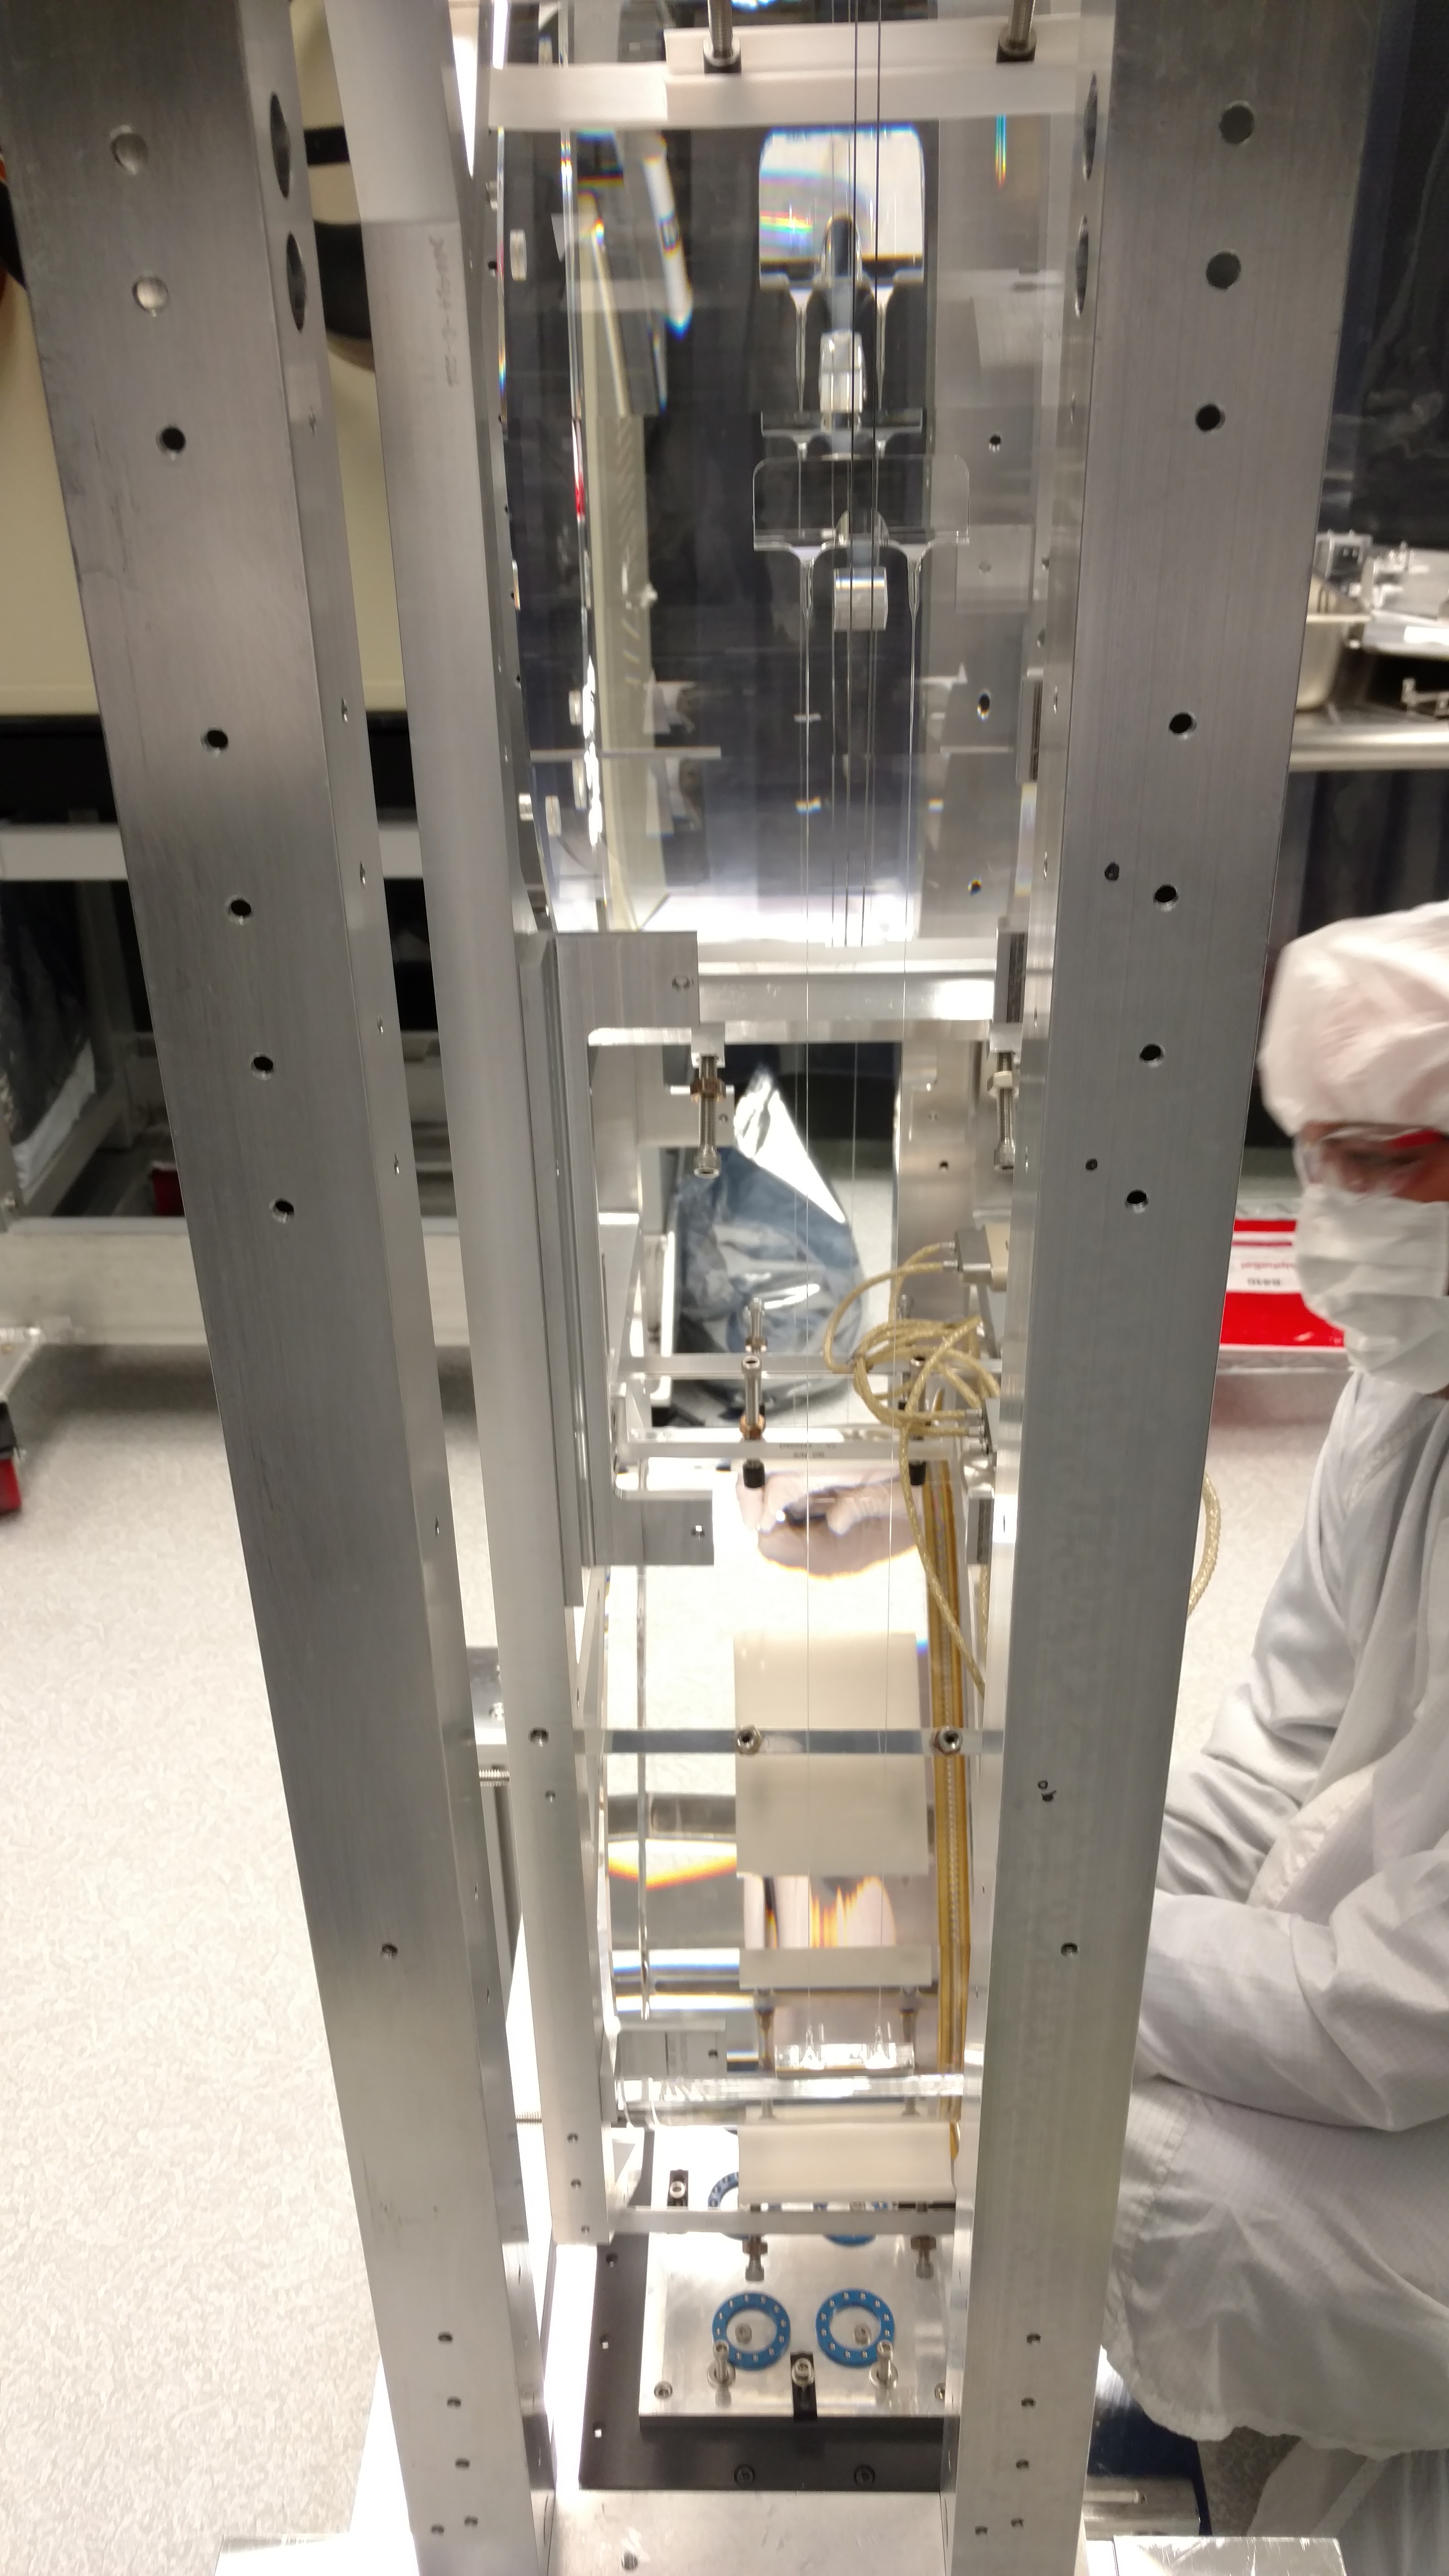
A few images and notes to help
1) Photo of path from ZM2 to OFI bench, from LHO alog 39663 and "big picture 1" see links below.
https://alog.ligo-wa.caltech.edu/aLOG/index.php?callRep=39663
https://alog.ligo-wa.caltech.edu/aLOG/uploads/39663_20171206192338_ZM2_BigPicture_1.jpg
2) LIGO-D1500303 linked above is / was a temp (preliminary) layout. Refer now to SYS links below. We have added a note to D1500303.
a) LLO
LHAM5 - LIGO-D0900456
ZM2 - LIGO-D1600094
b) LHO
WHAM5- LIGO-D0901129 (please note this top level is pending, refer to D1700472 and D0900456 for now)
ZM2 - LIGO-D1700472
Hope these help. Corey A, Eddie and Calum