Keita TVo
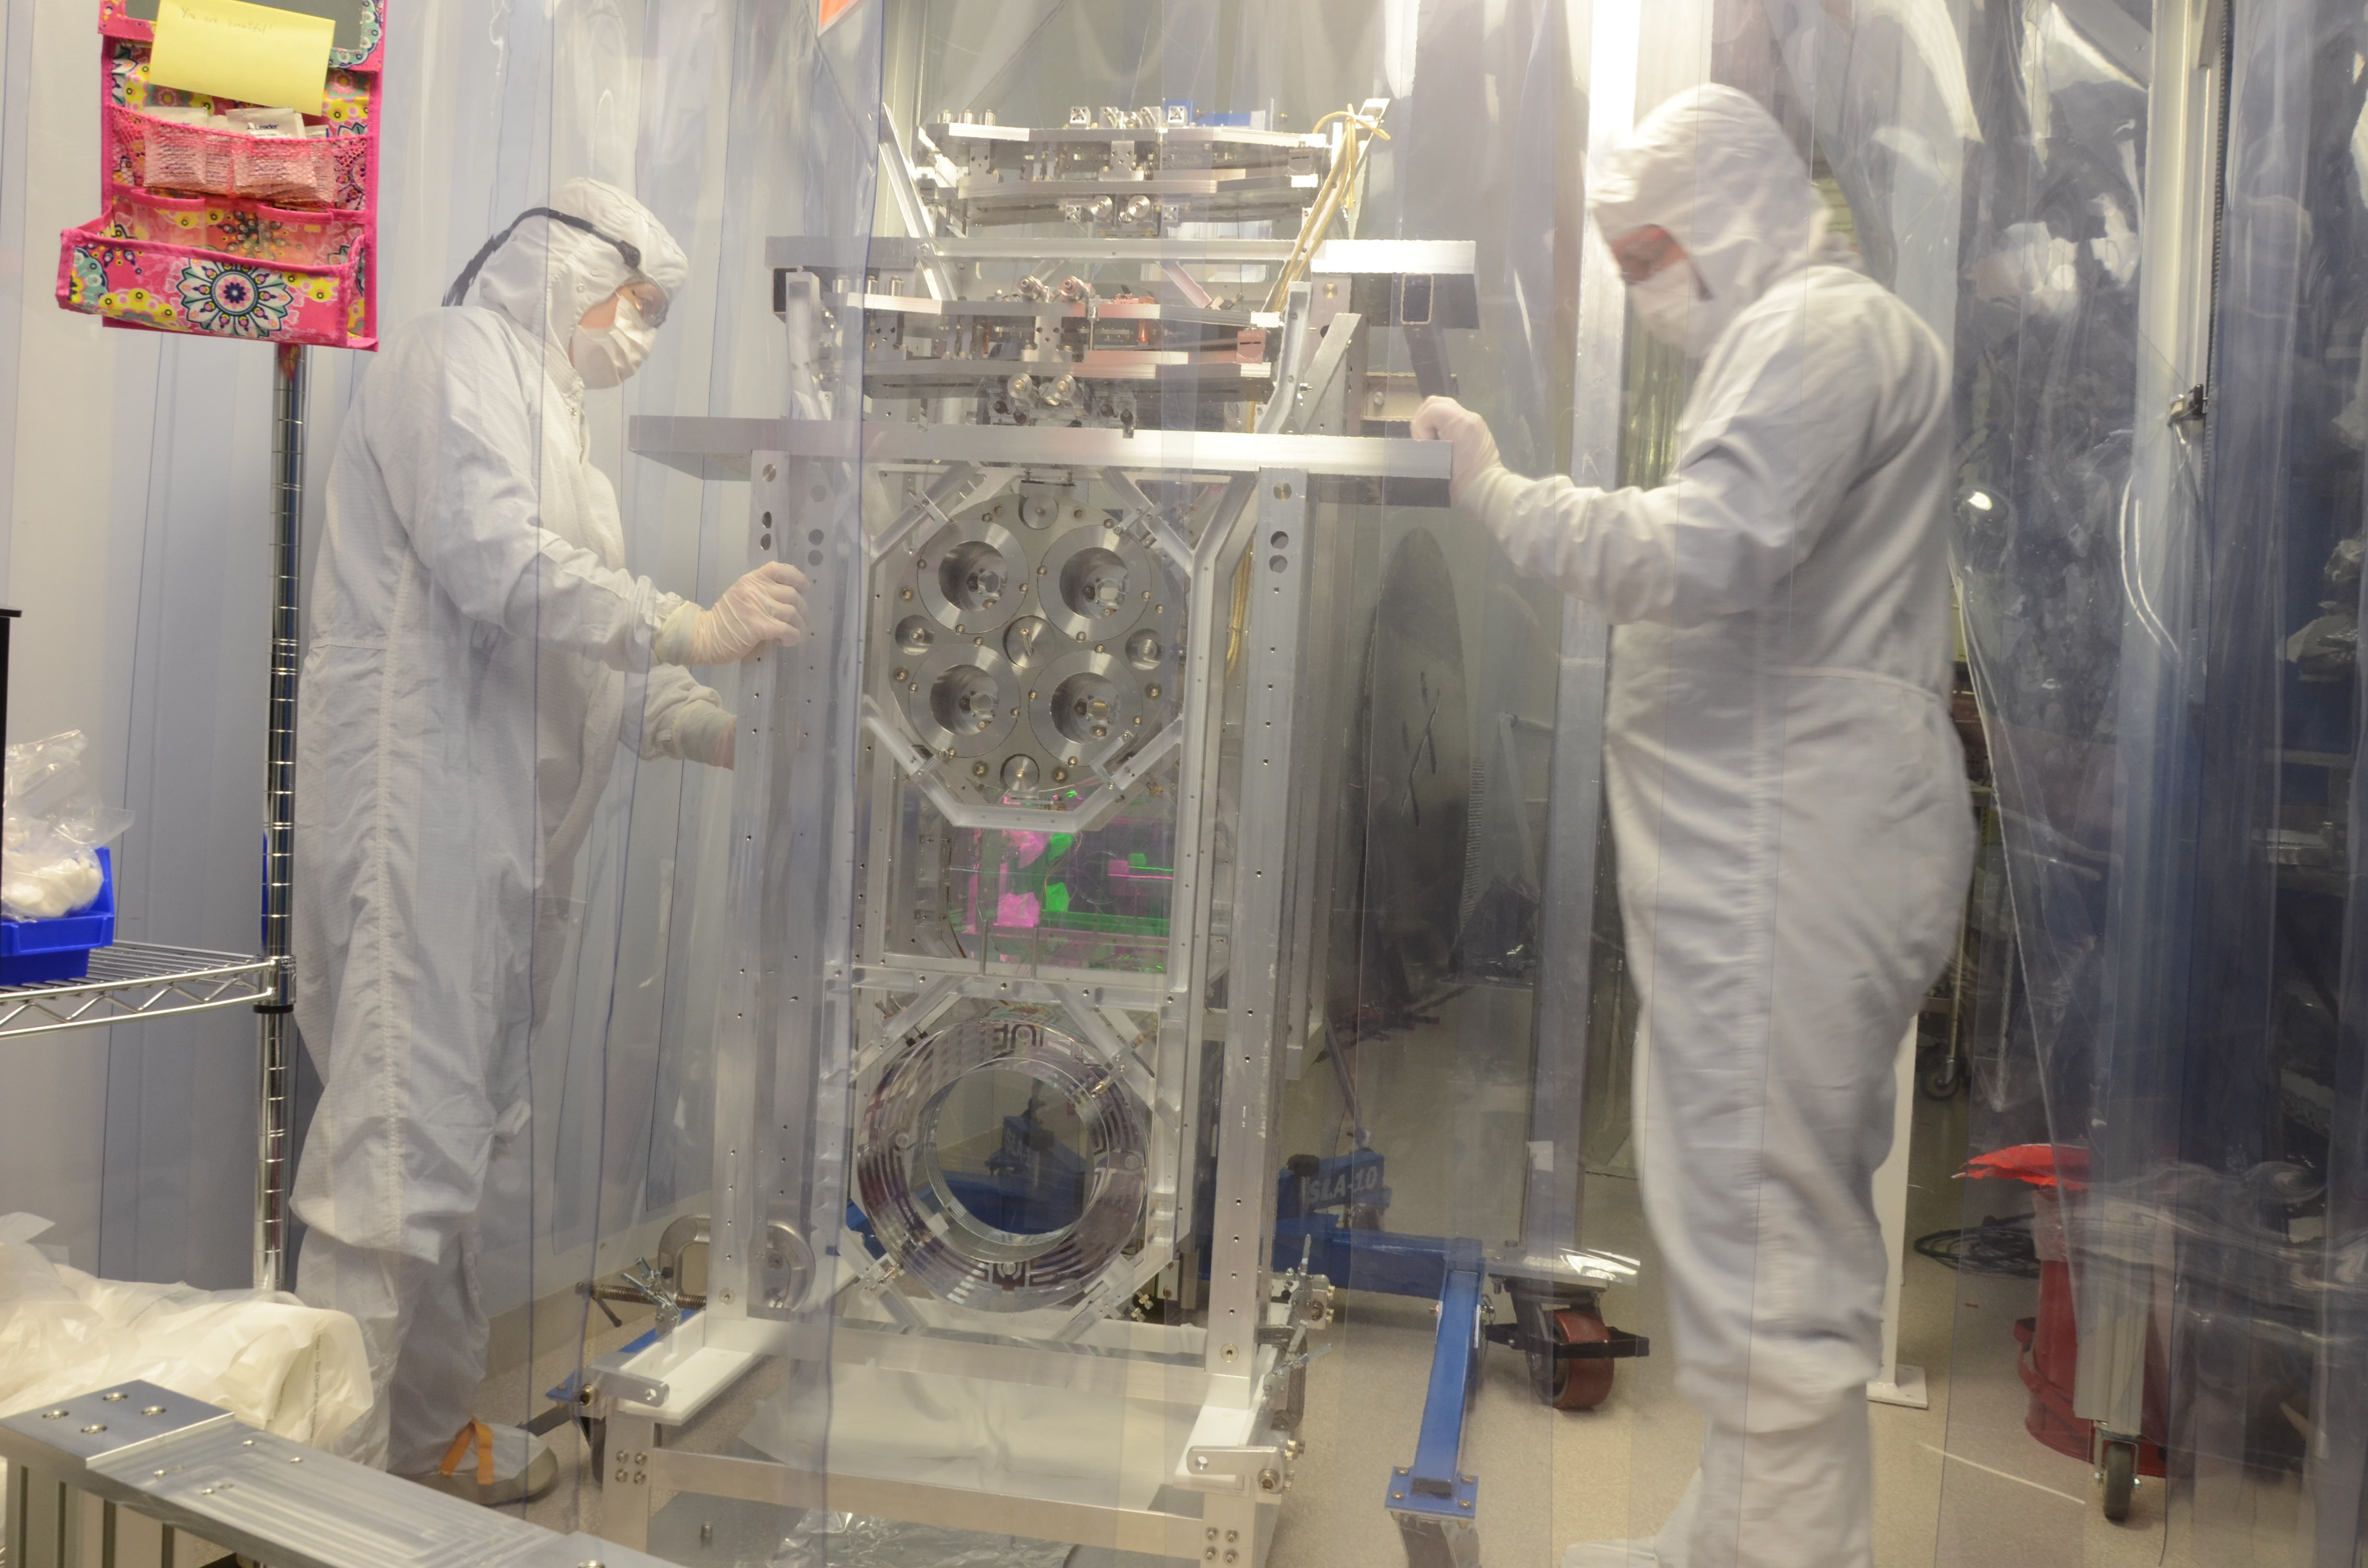
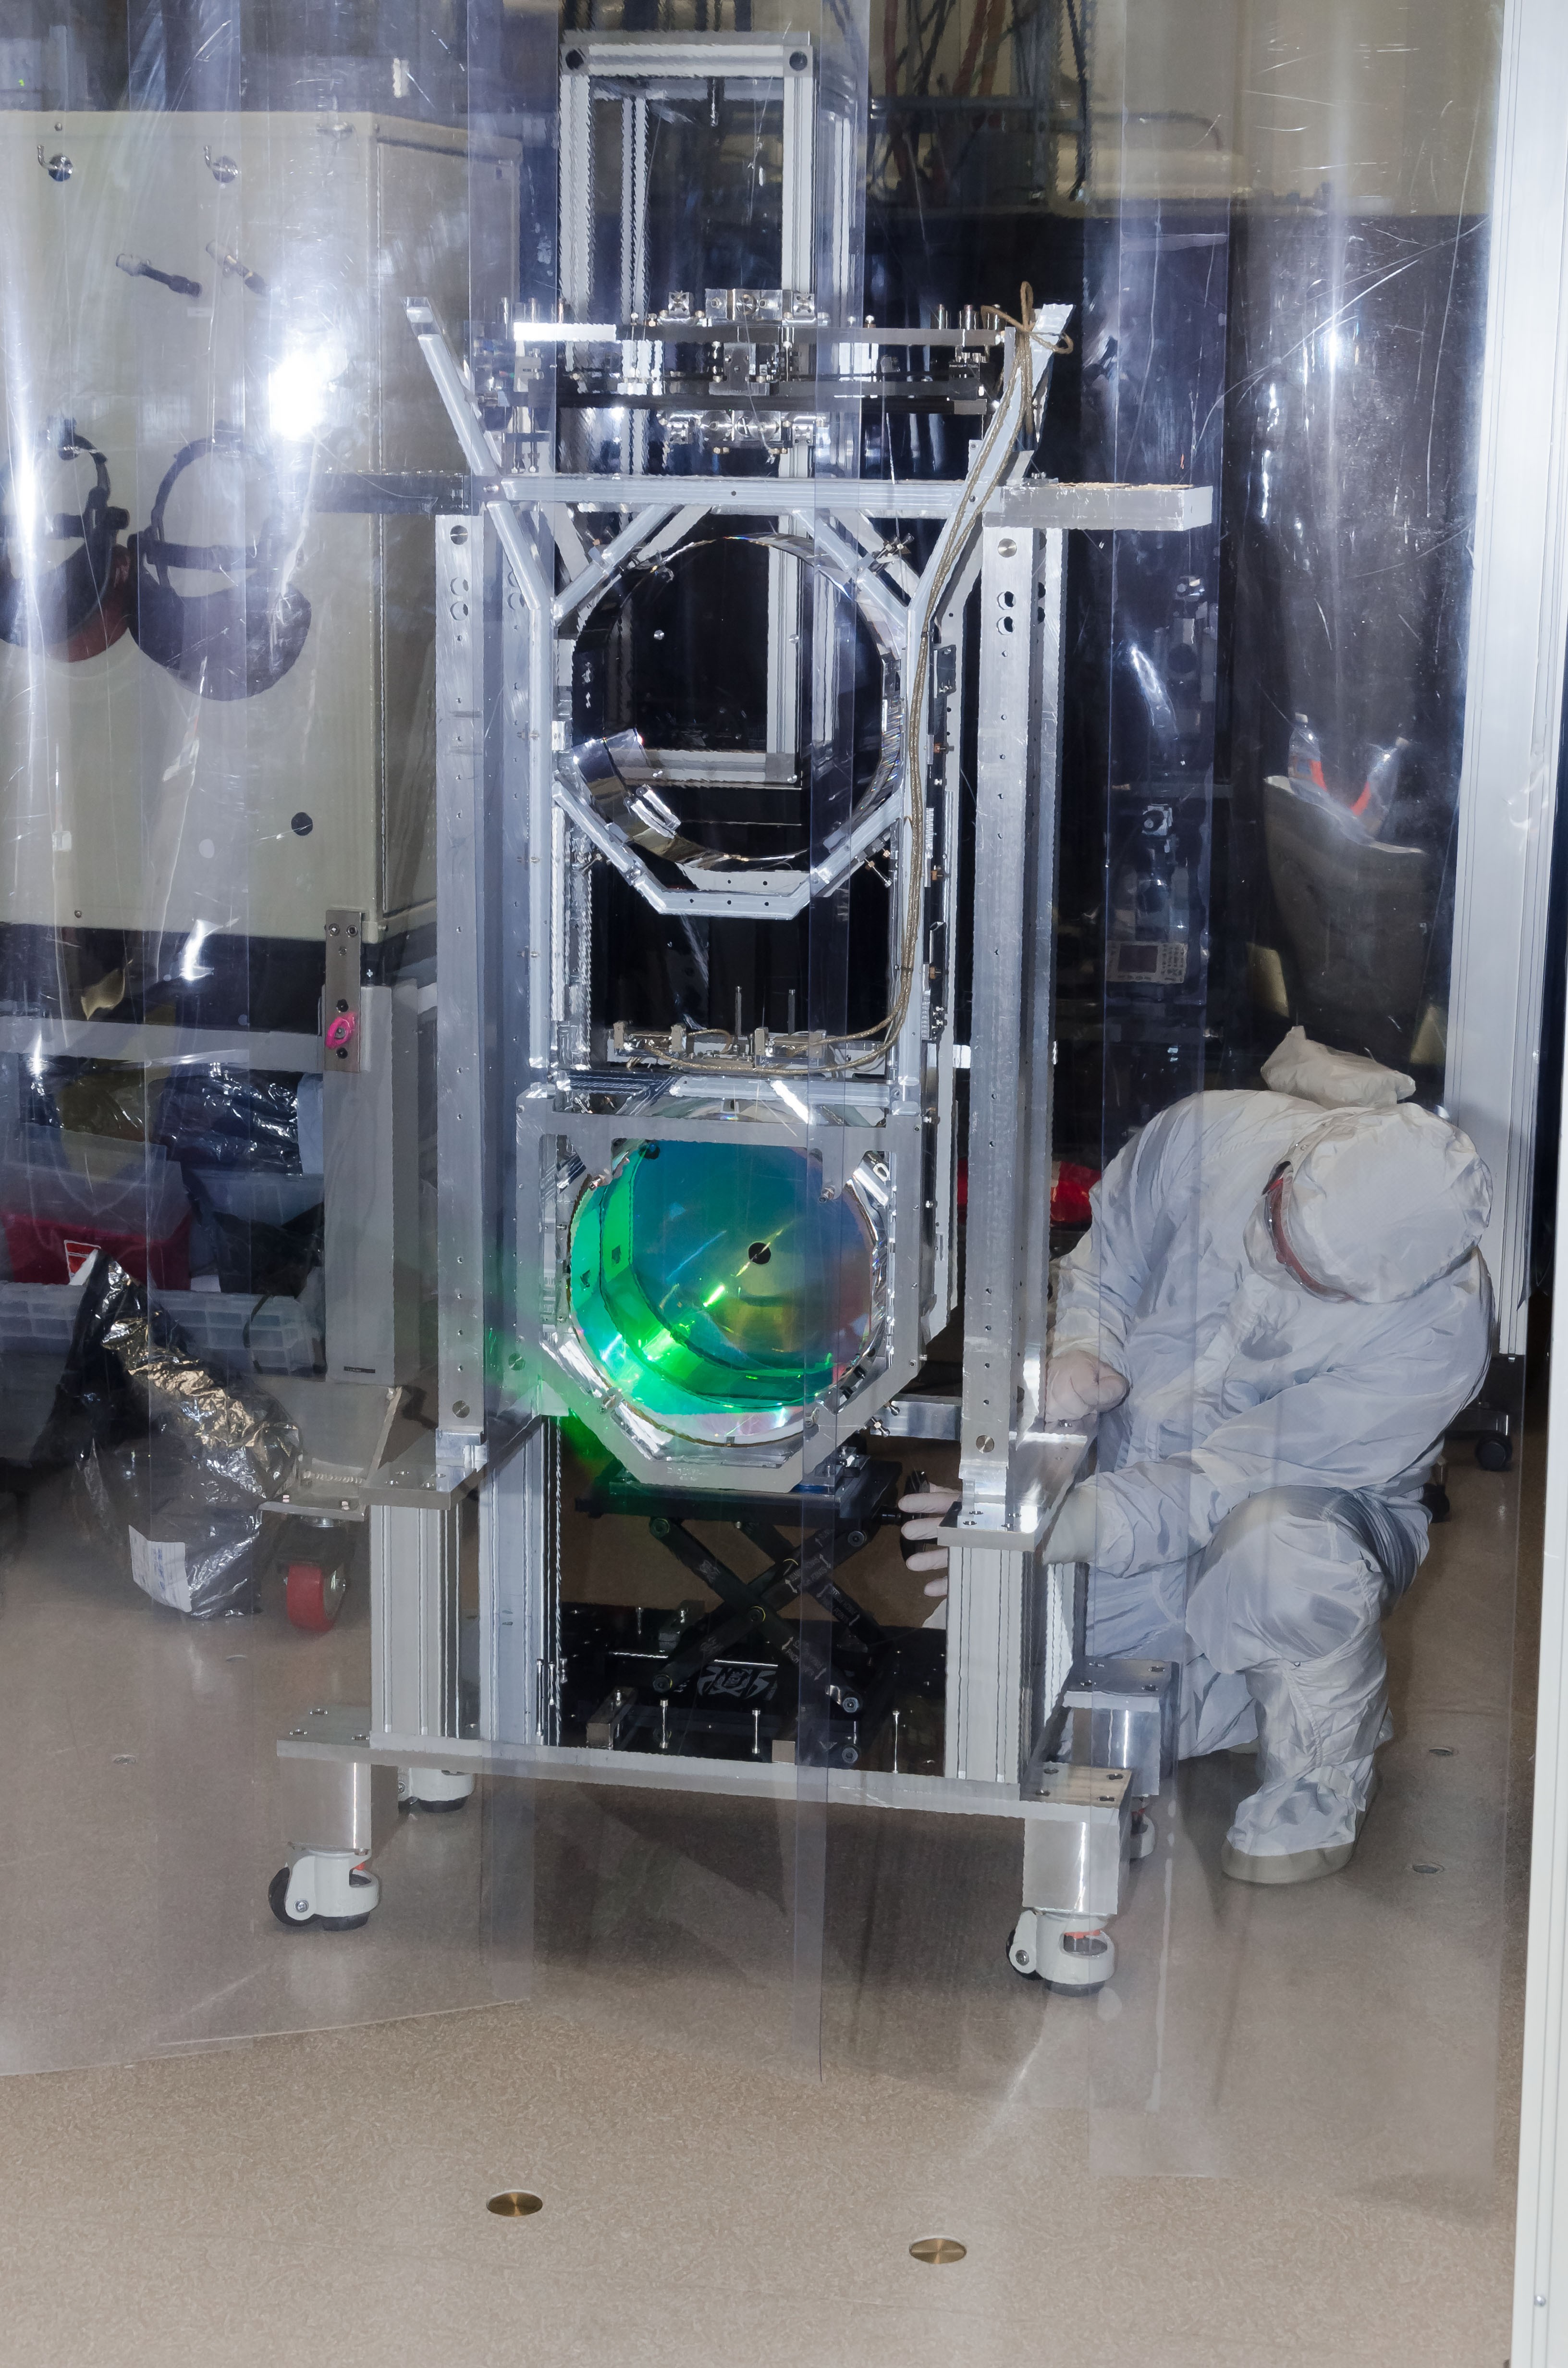
We first set the final position of the fast shutter and the cable routing as well as position the reflection of the shutter to the center of the beam dump. This is done and the fast shutter has one tightened dog clamp on each side. The incoming beam from HAM5 clears the shutter wire by 10 mm and the structure is even further than that. We had similar difficulties with closing and opening the shutter as yesterday but Keita seems to have found a way to make it work with some odd logic that he will post about in a comment.
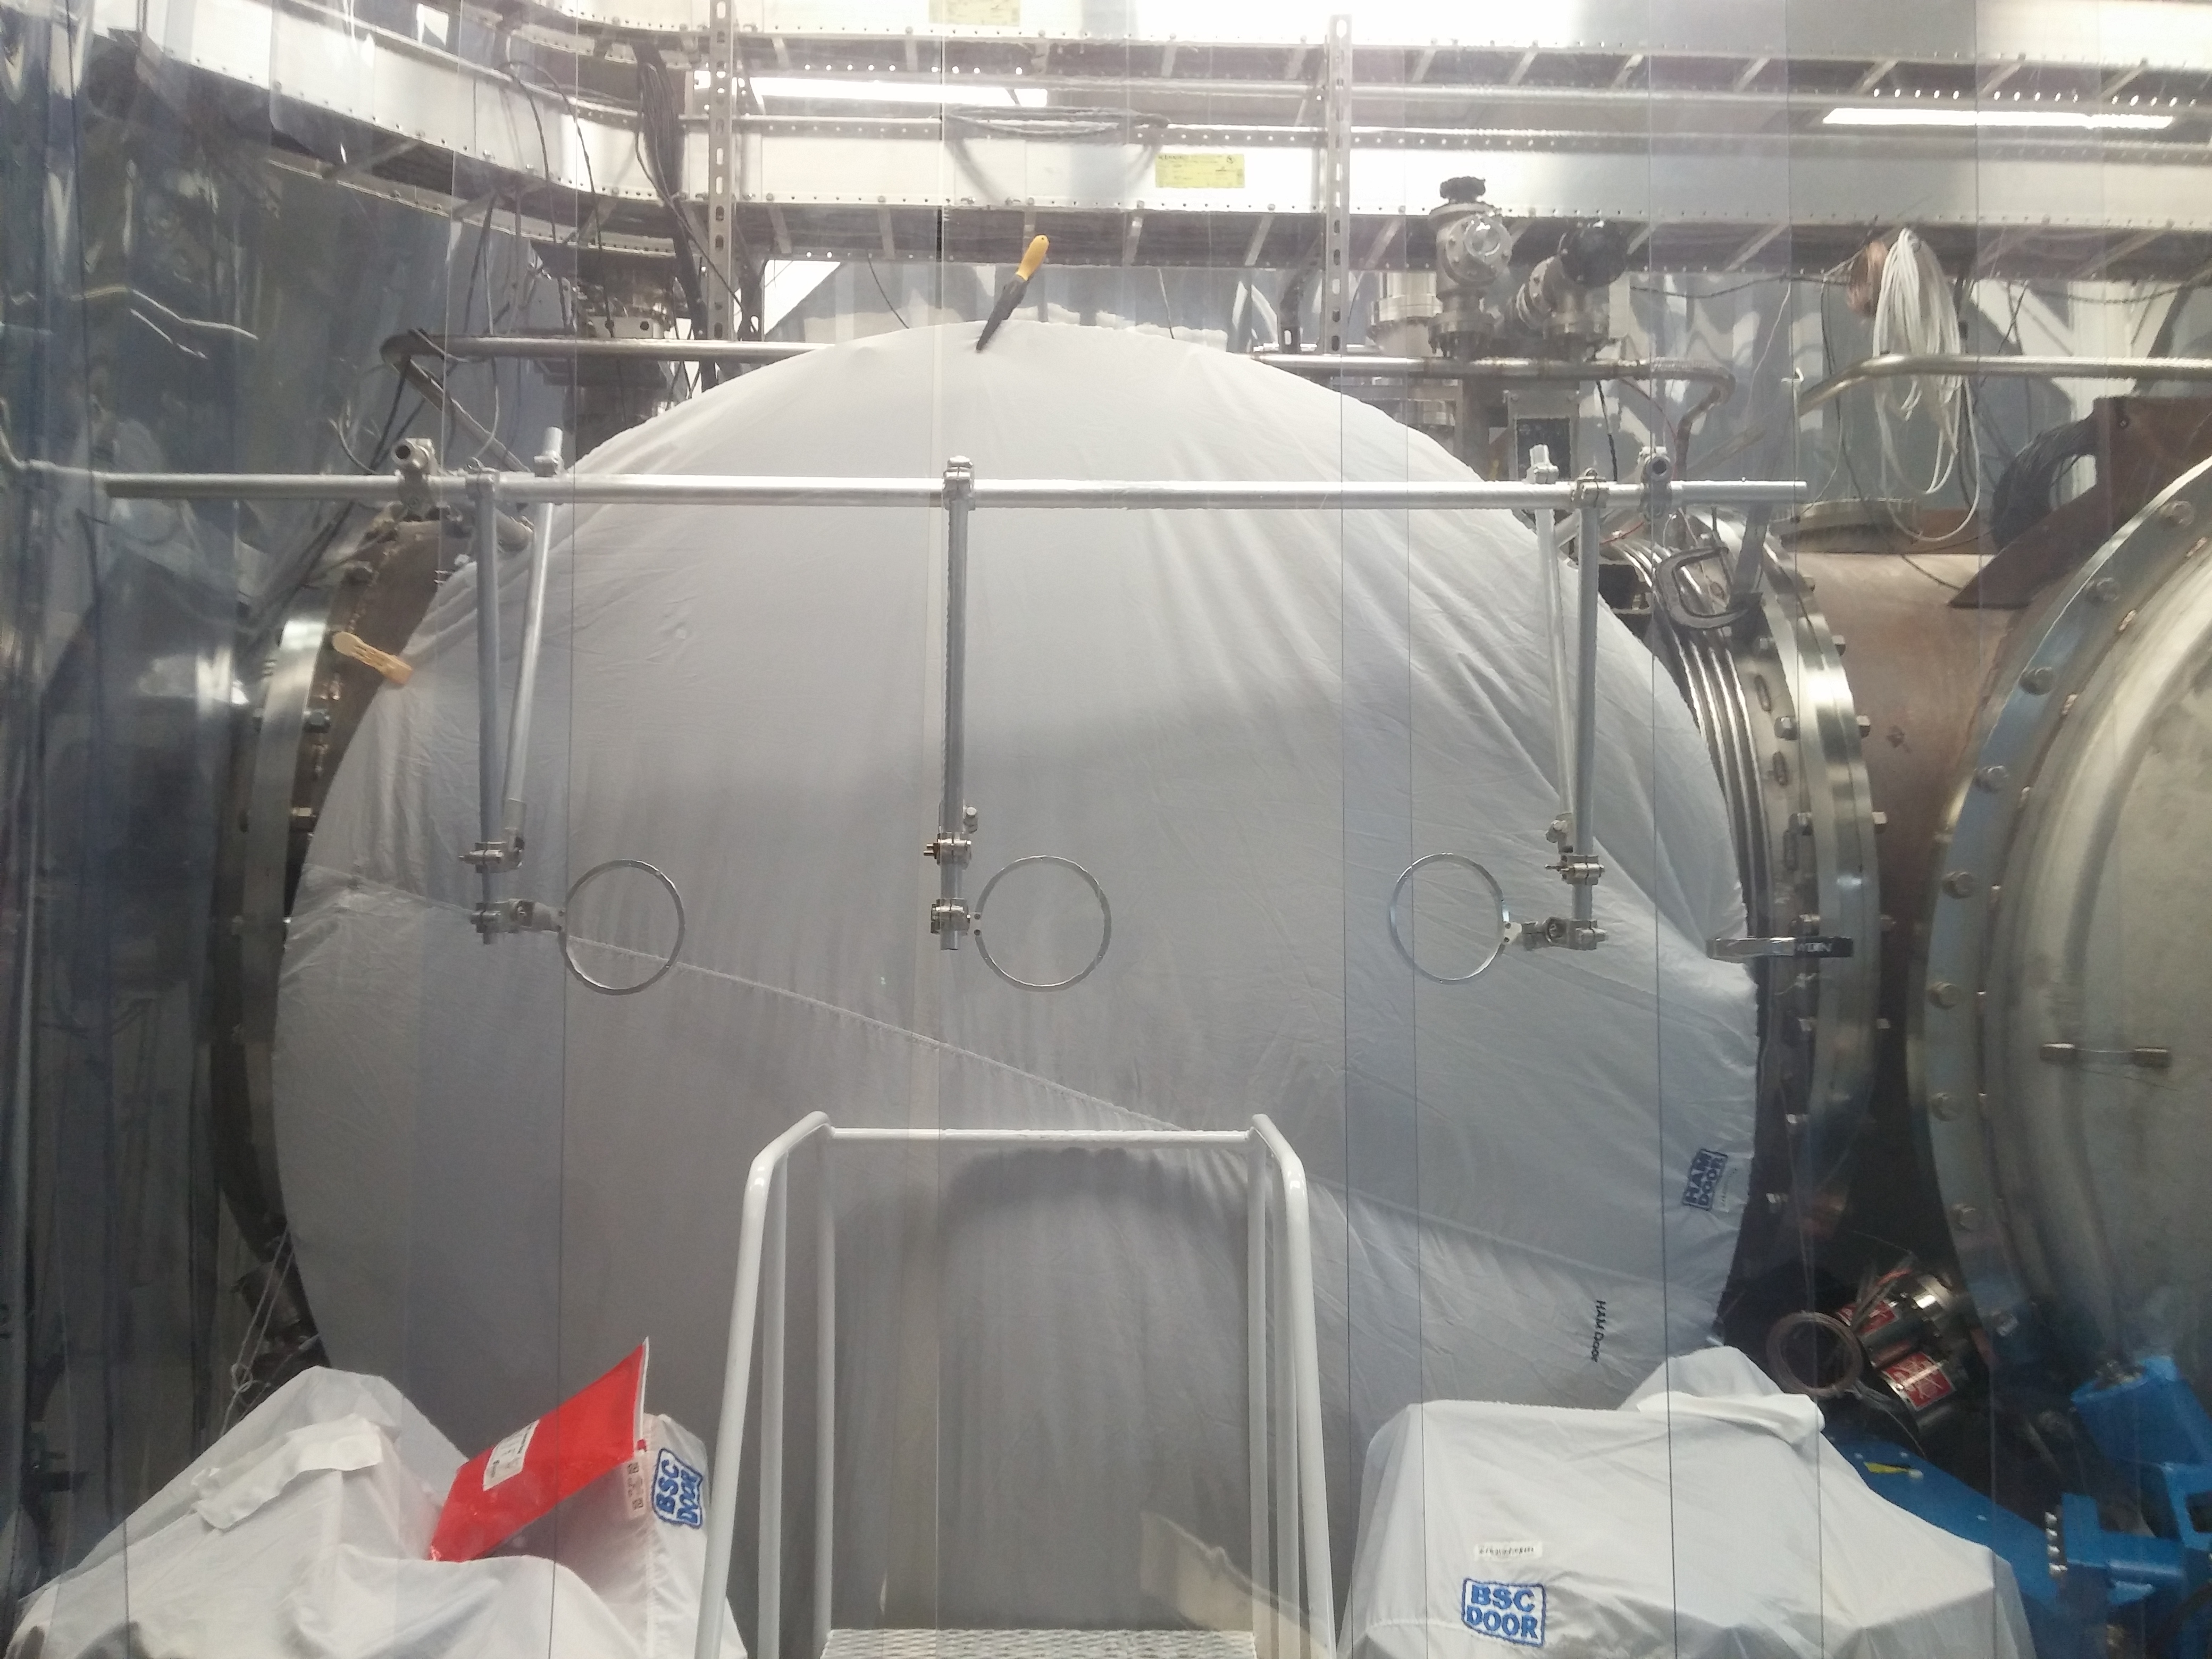
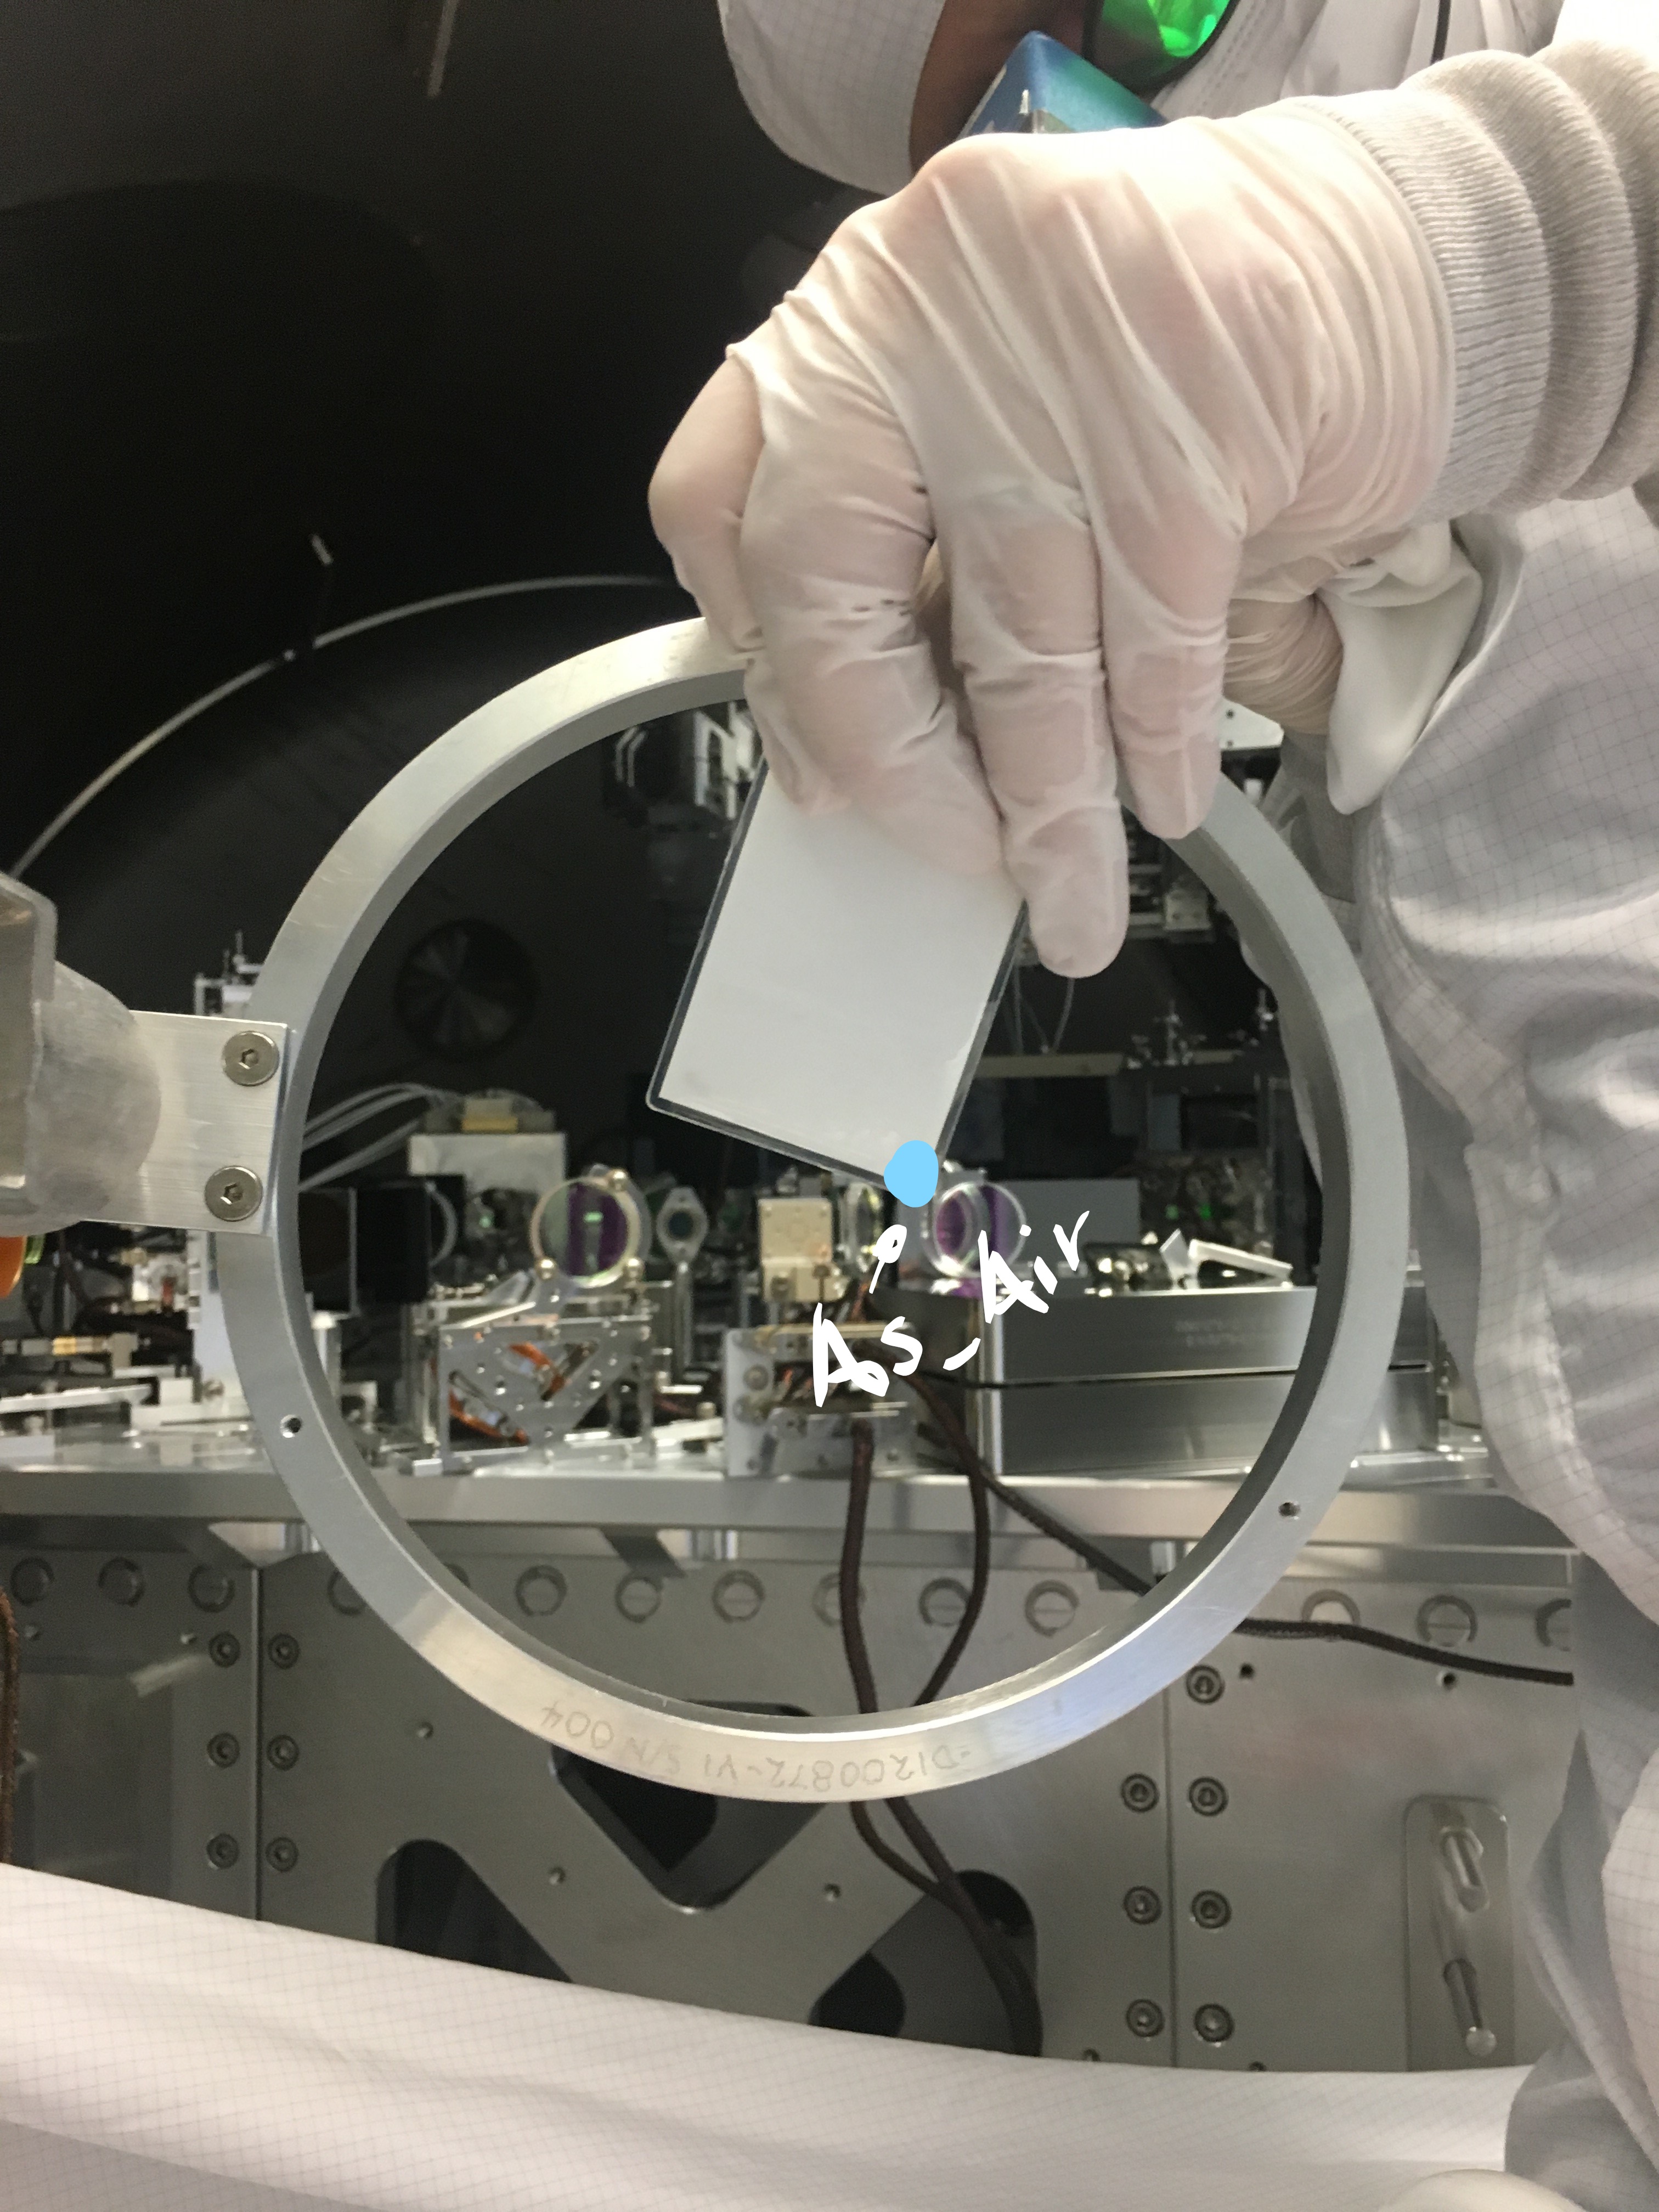
We've also aligned the AS_AIR path through to the viewport simulator as well as the beam diverter and the beam dump. Note of caution, when Jason and I installed the viewport emulator, it was already well aligned to three blank flanges on the other door of HAM6. Keita reminded me that this is not the same as an actual viewport with its viewport protector housing attached so we tried our best guess to account for this by eye when aligning the beam coming out of the chamber. I've attached a picture that shoes where the beam is coming out of the emulator, it is at the bottom most corner of the laser card.
Next step was OMC_TRANS path which was particularly difficult because the OMC would not stably lock with the purge air on and even when it was locked, we were not able to see anything coming out of the shroud. It was getting a bit late by this point and this alignment should be done with three people
Fast shutter:
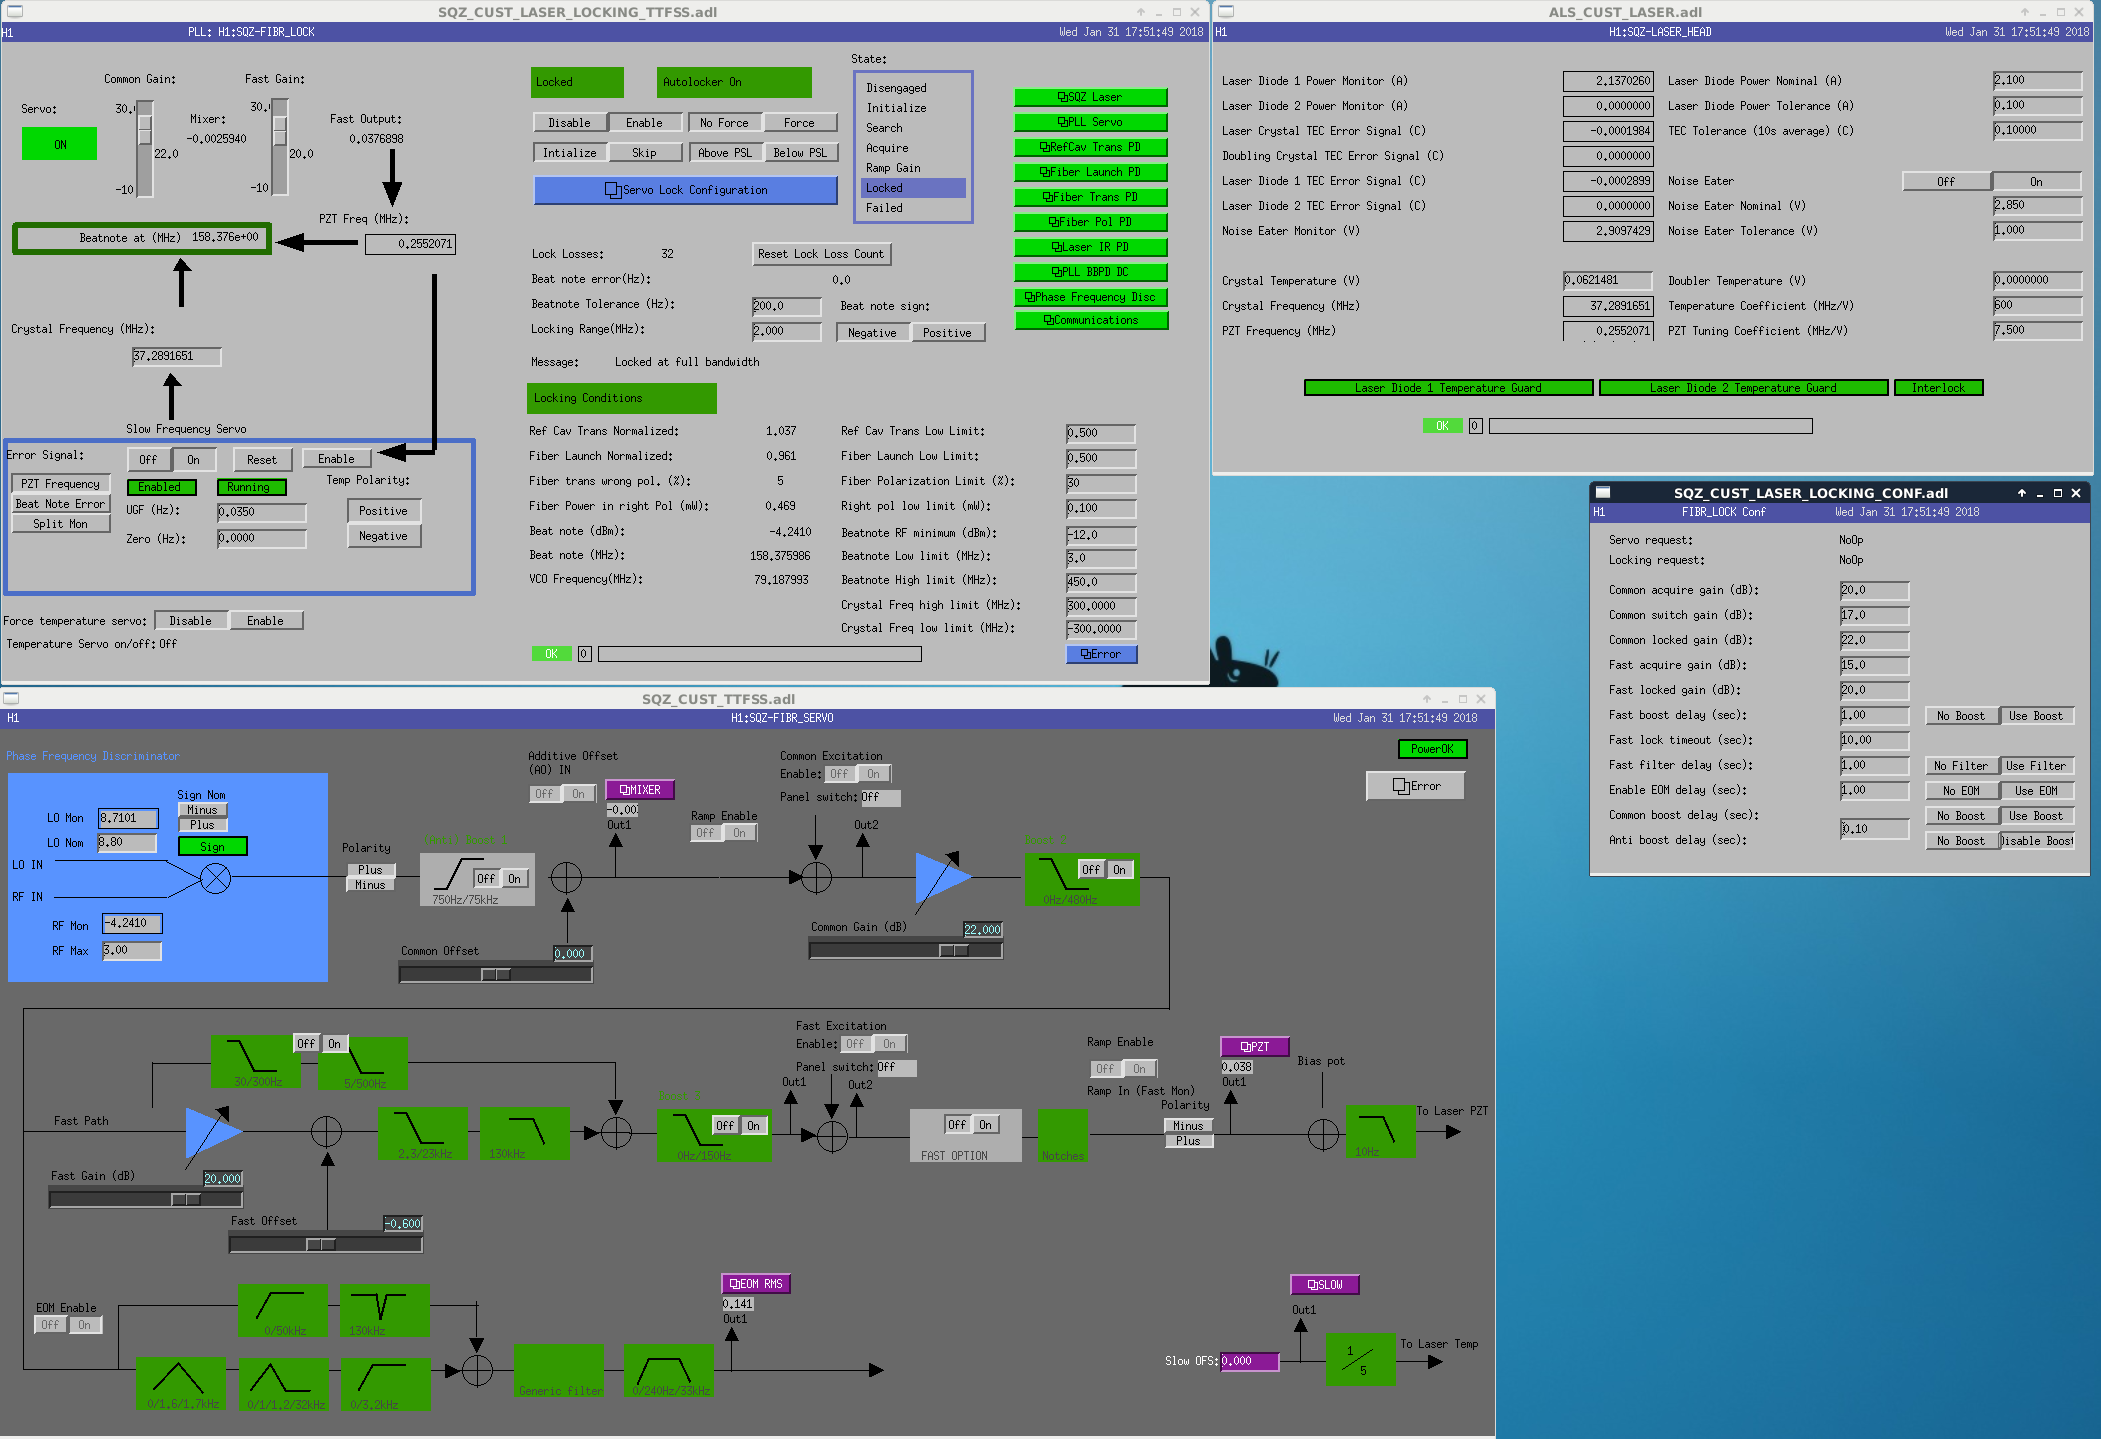
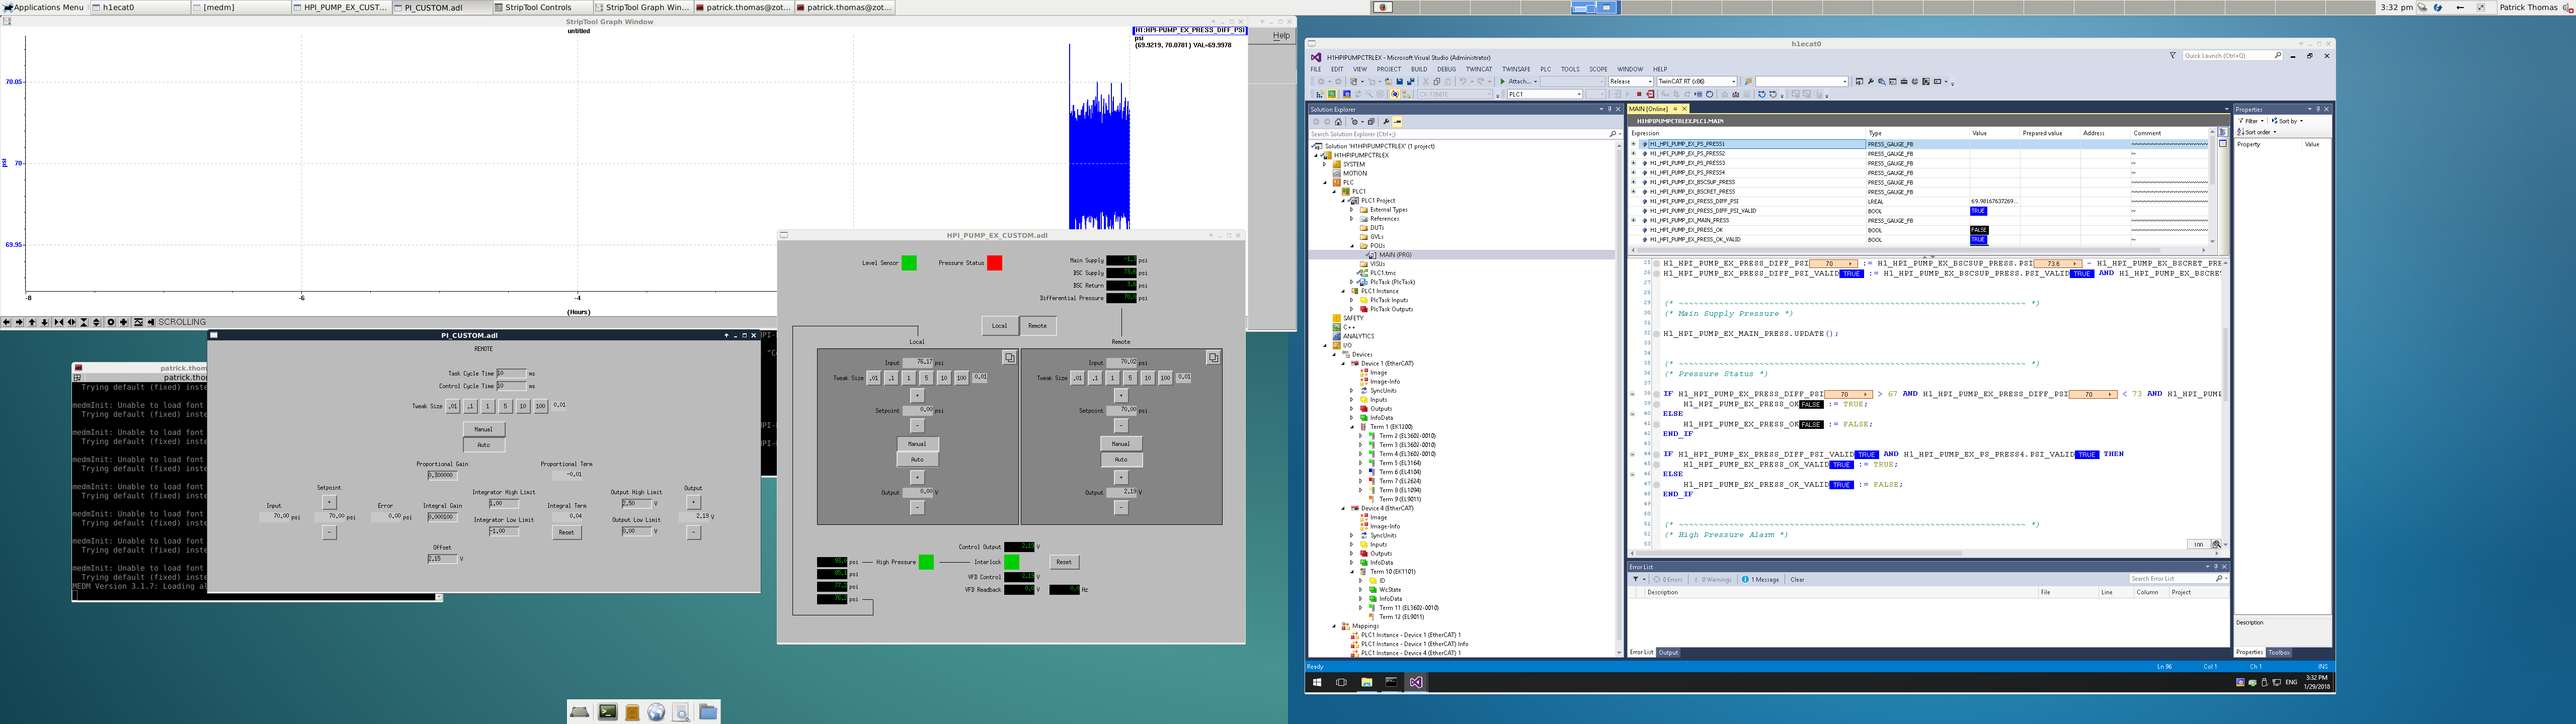
Temporary HV PSU was disconnected and the cable from the power rack was plugged into the FS driver. Front panel "HV enable" switch was turned on. After this the "open" "close" buttons on the FS MEDM screen worked, "close" would close the shutter as long as you'd like.
Odd thing was this:
Shutter was initially open -> Set the threshold negative (instead of using FS MEDM open/close button) -> Shutter would close immediately -> But the shutter would go back open after two to three seconds.
You would think that whenever the trigger diode shows a larger power than the threshold the shutter is always open. But maybe this is OK as the FS is the protection for lock loss, we don't expect continuous huge power.
Odder thing was this:
Shutter was open -> Set the threshold negative -> Shutter would close immediately -> Didn't wait for two or three sec, quickly set the threshold back to some positive number or zero -> Shutter would stay open.
I don't understand the logic here.
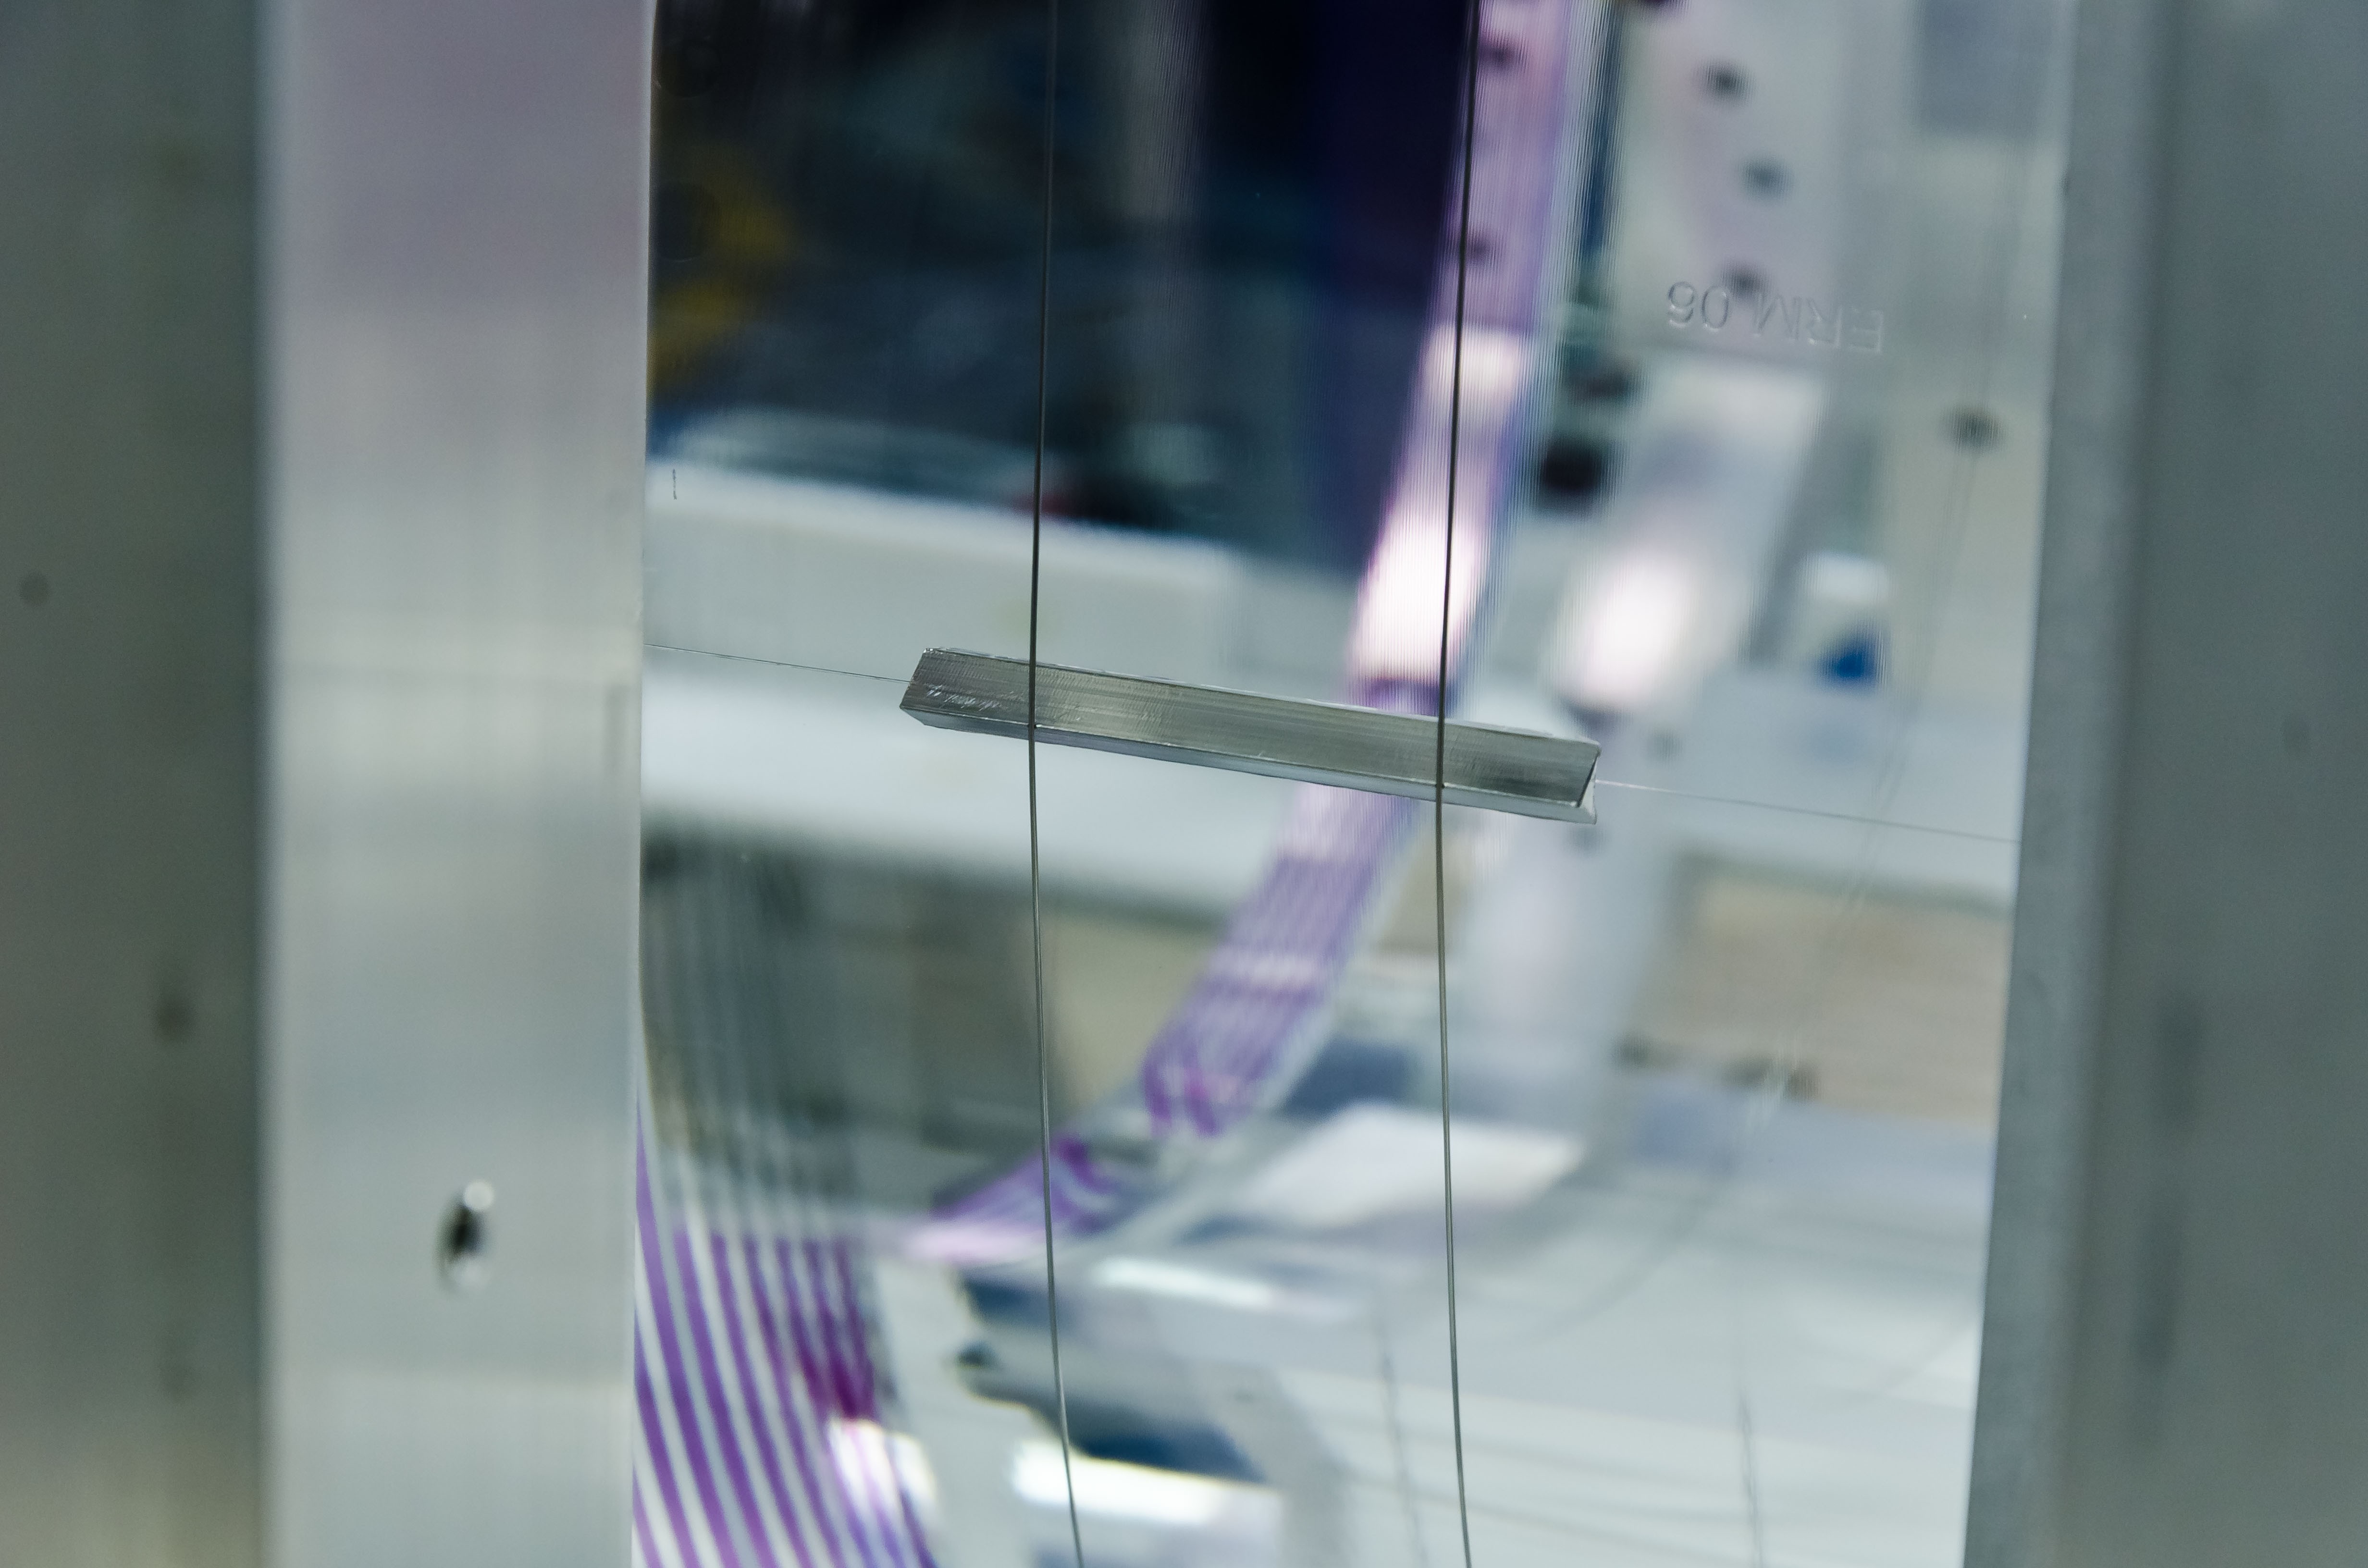
Pictures
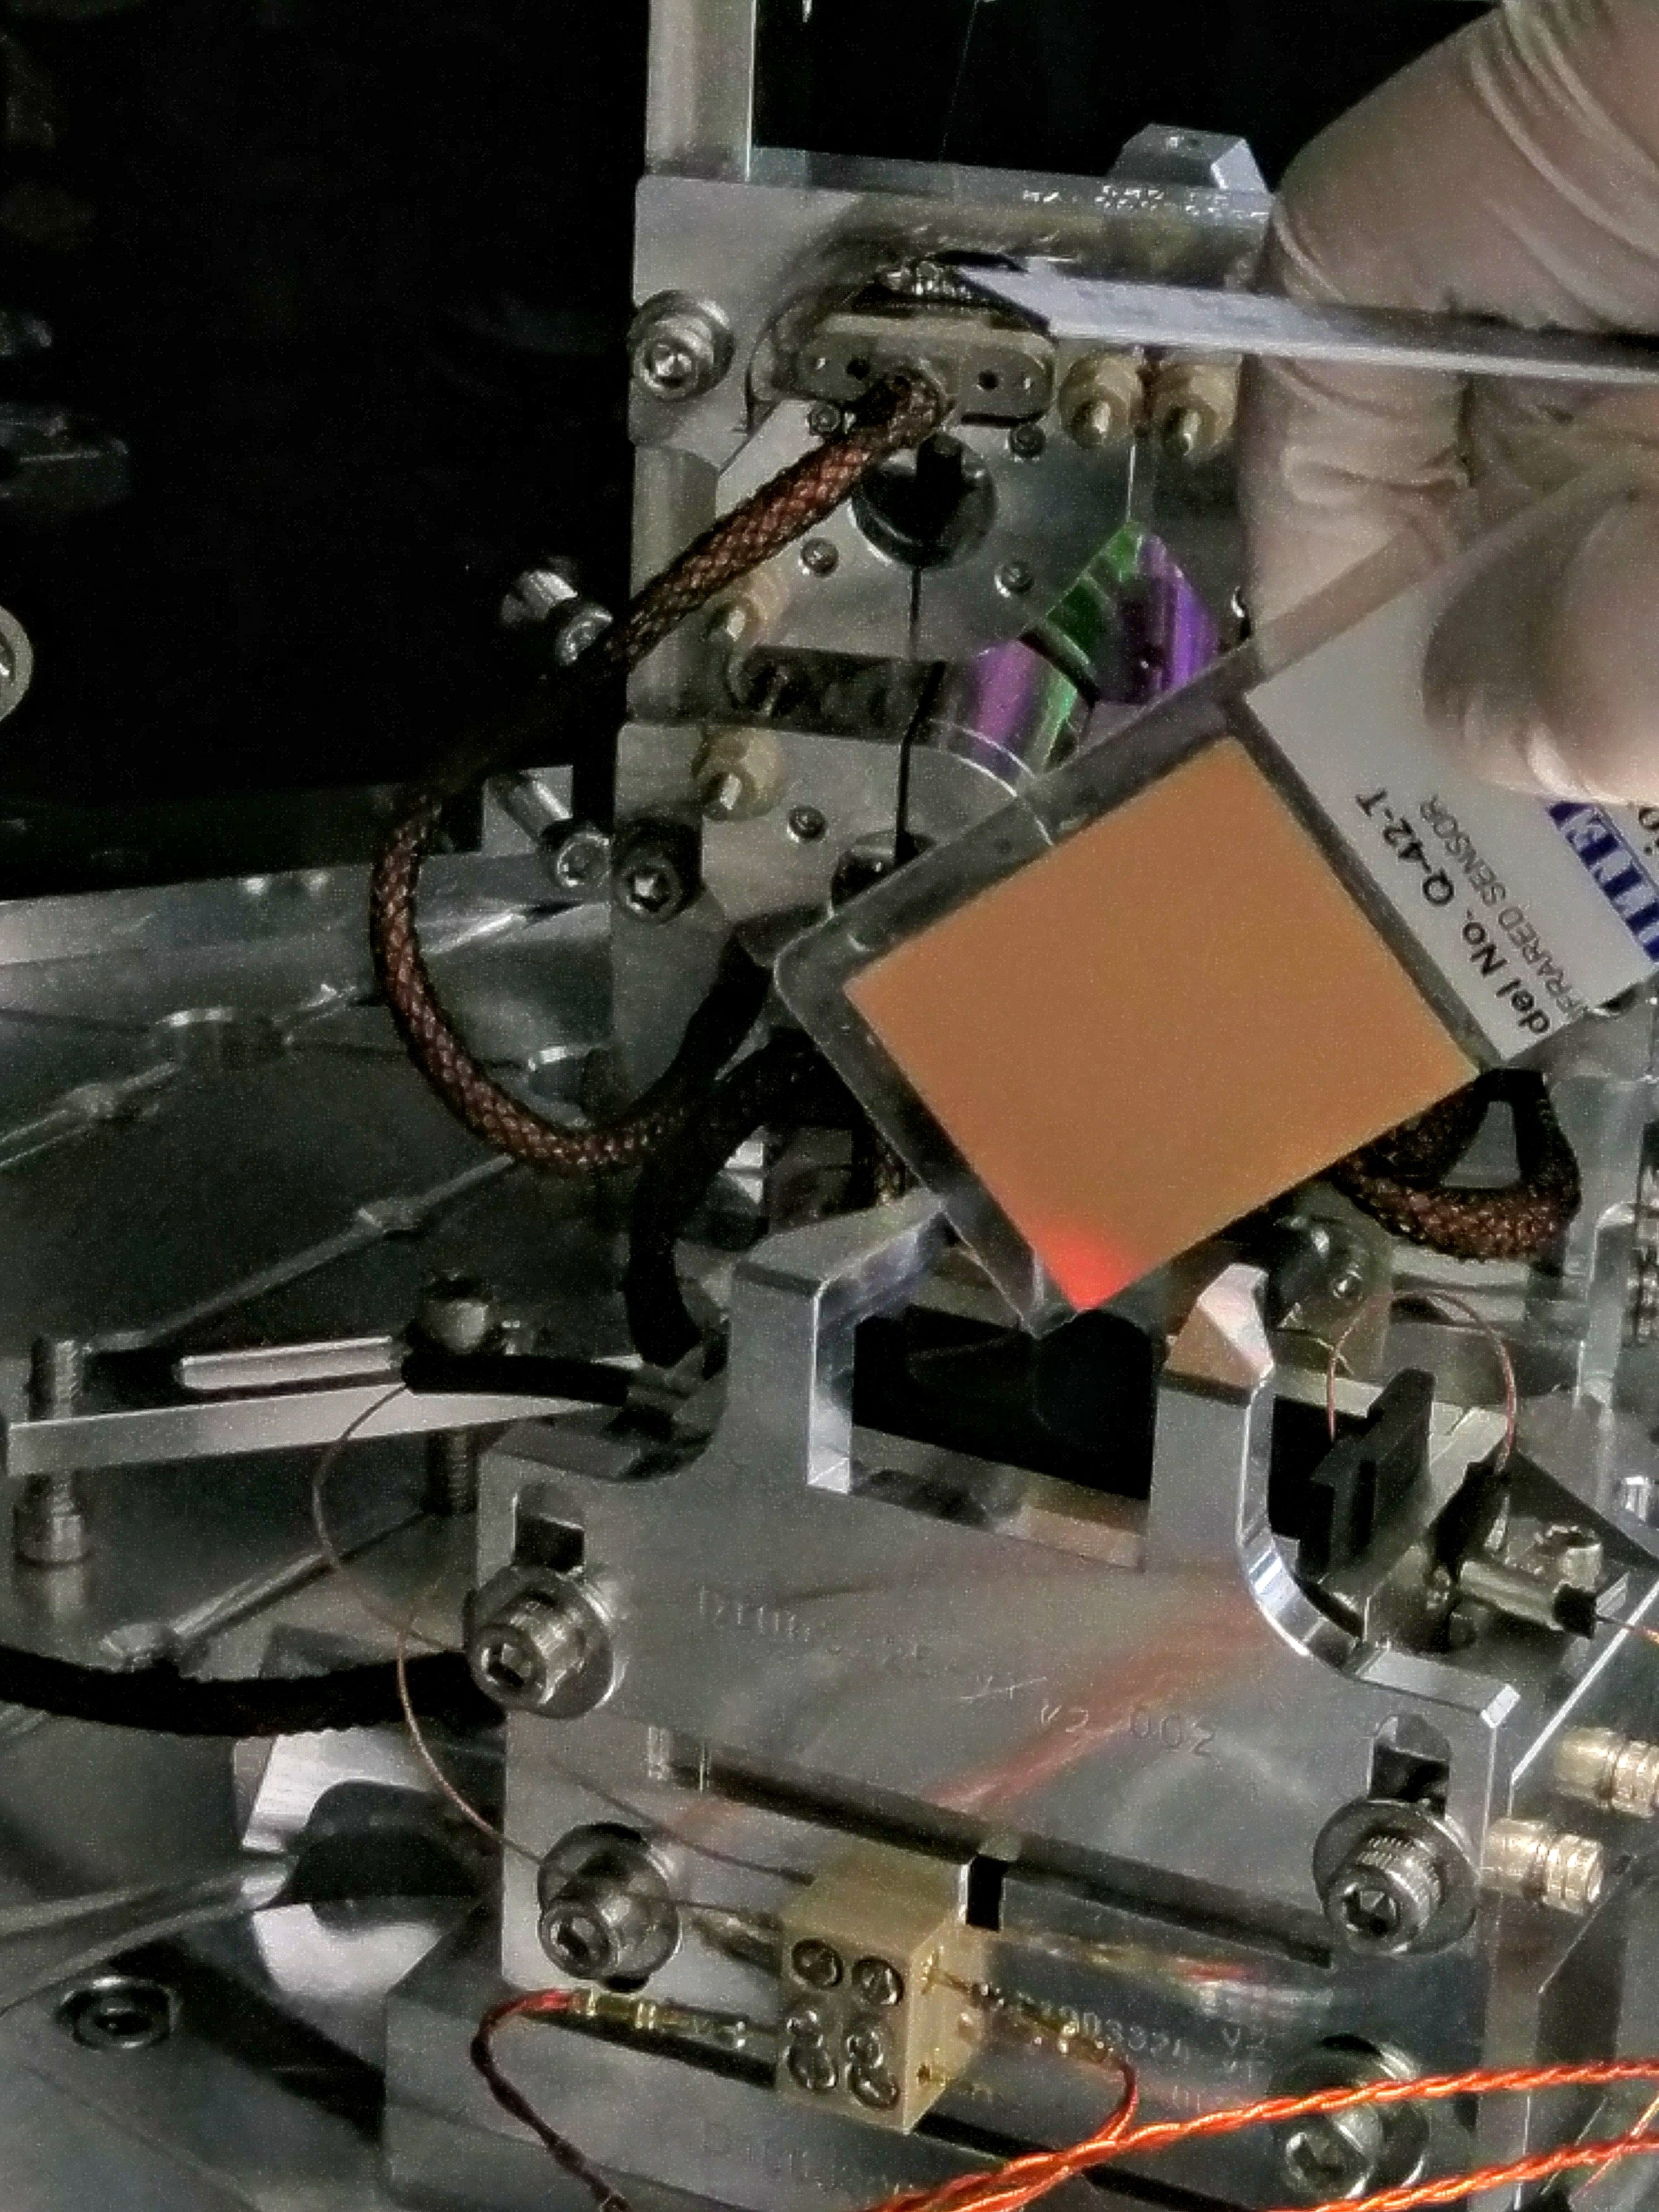
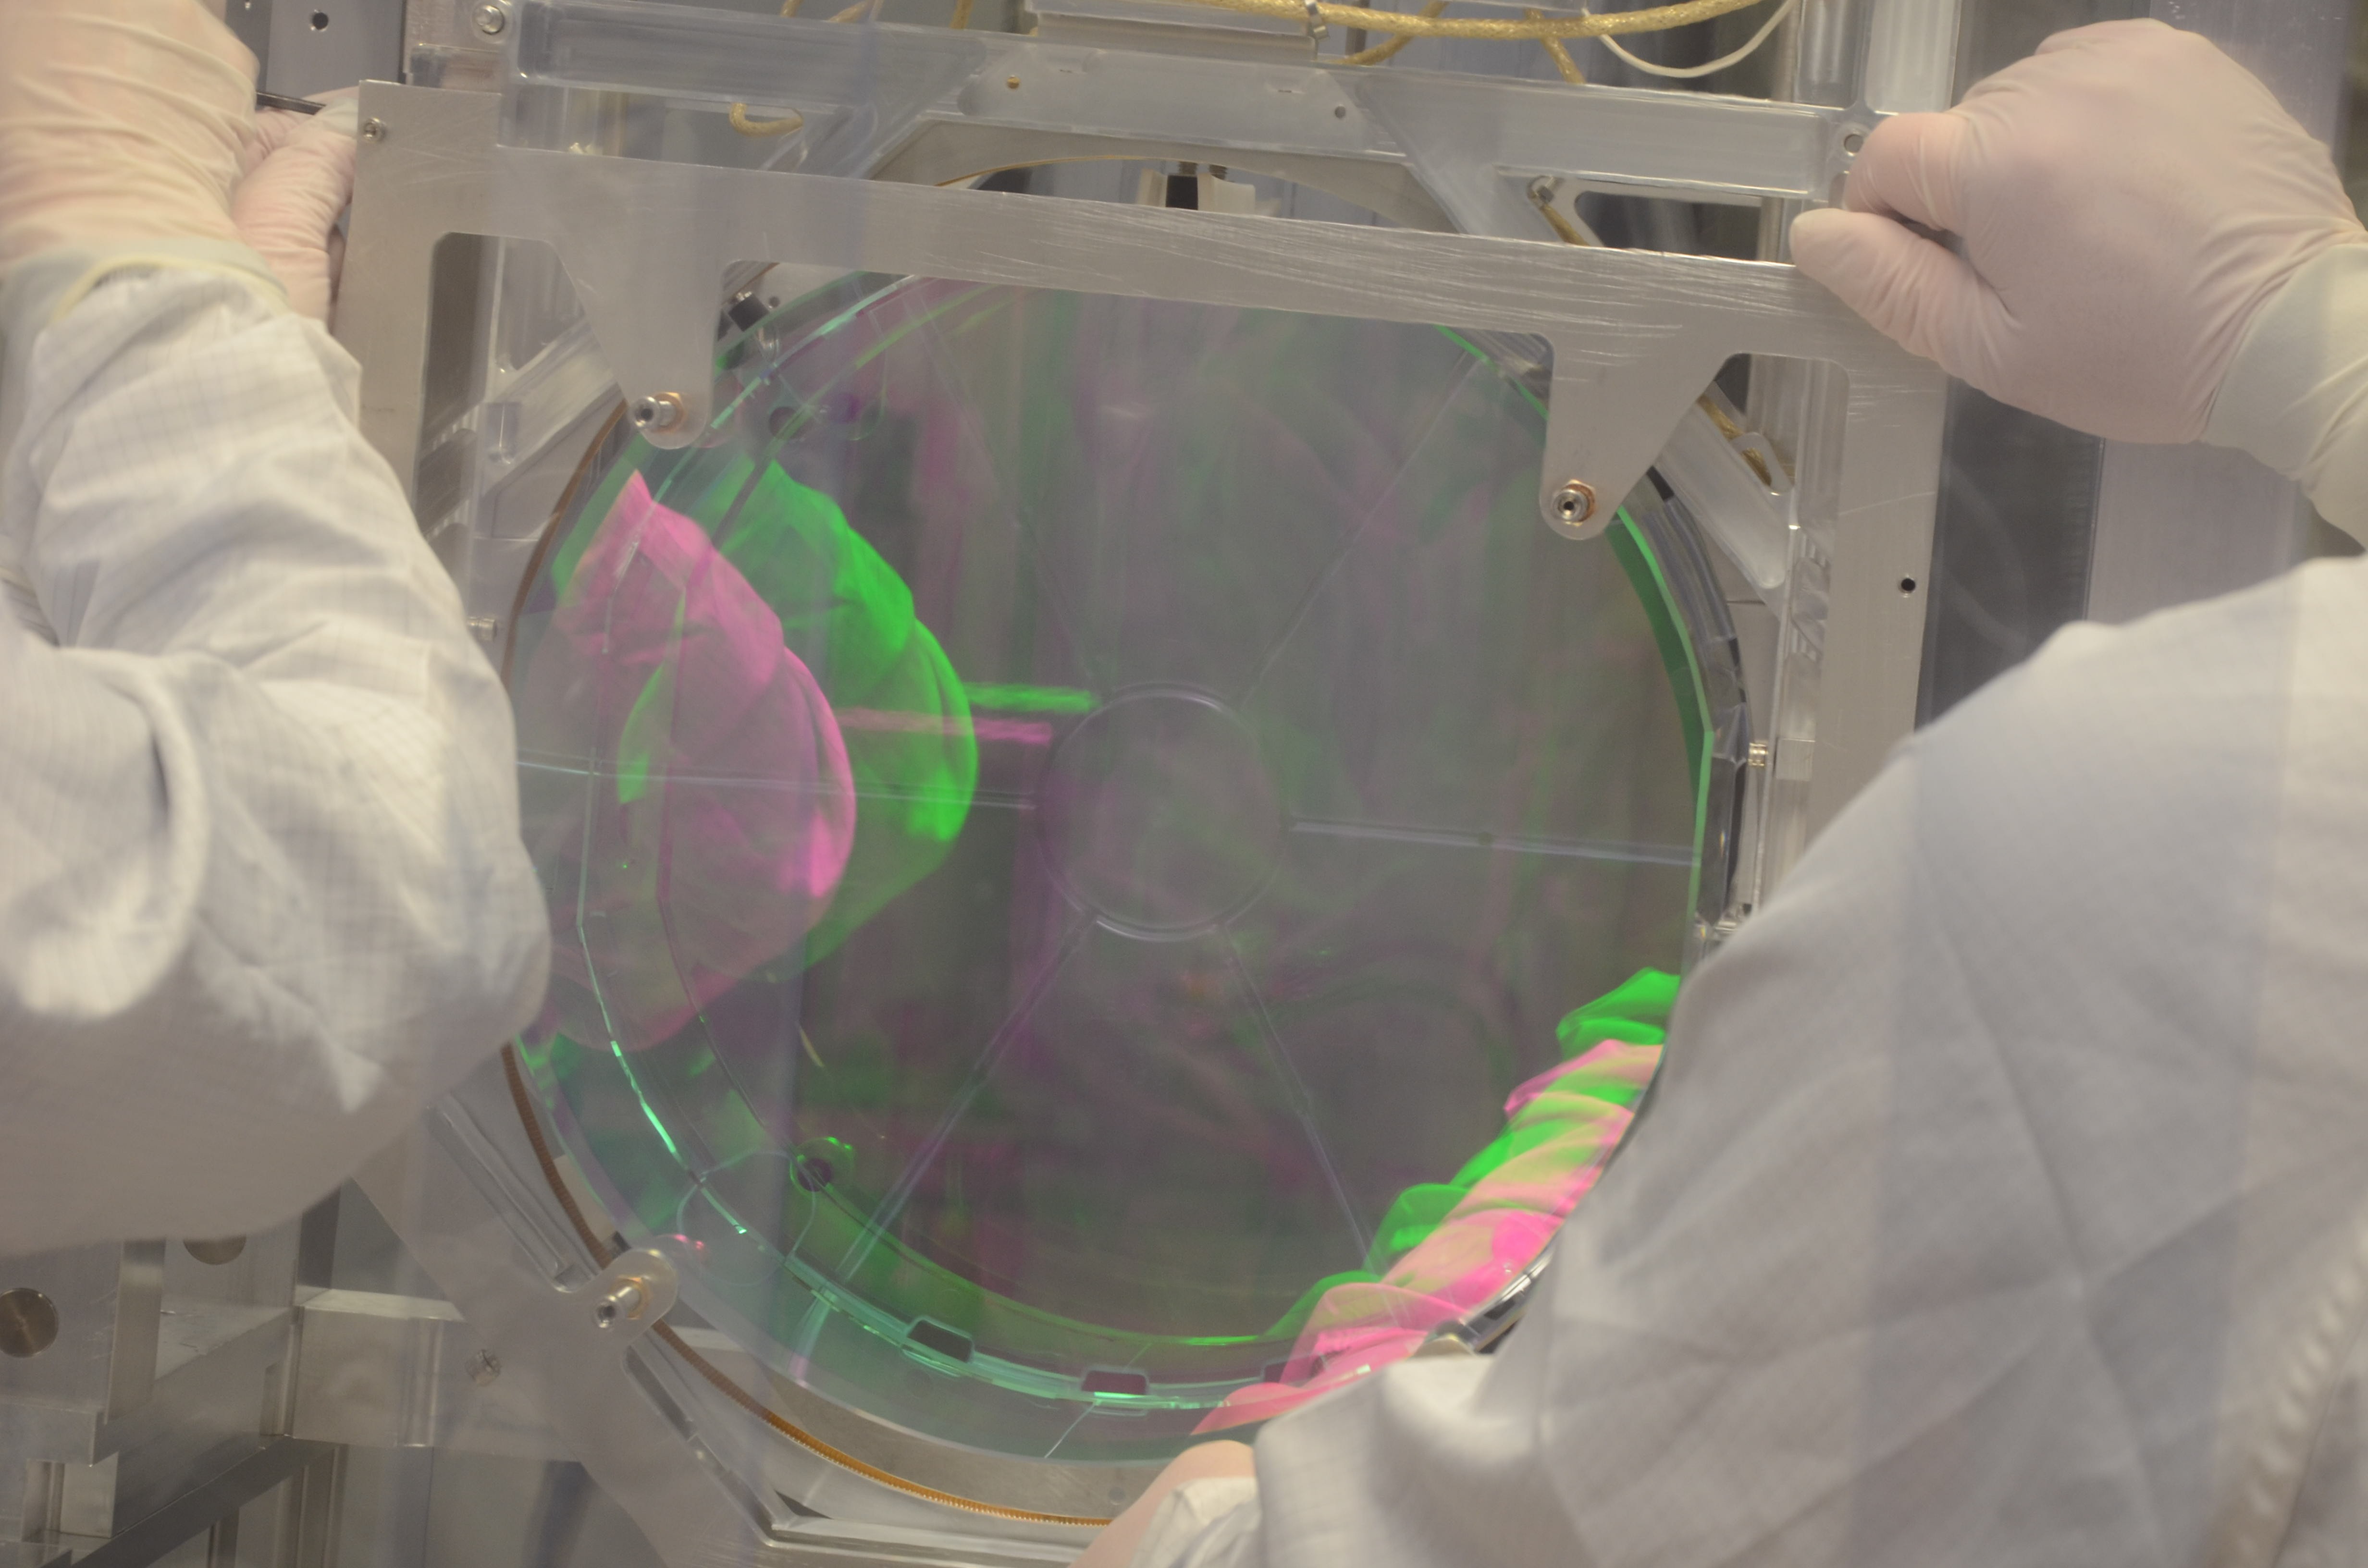
1st: centering on FS when it's closed.
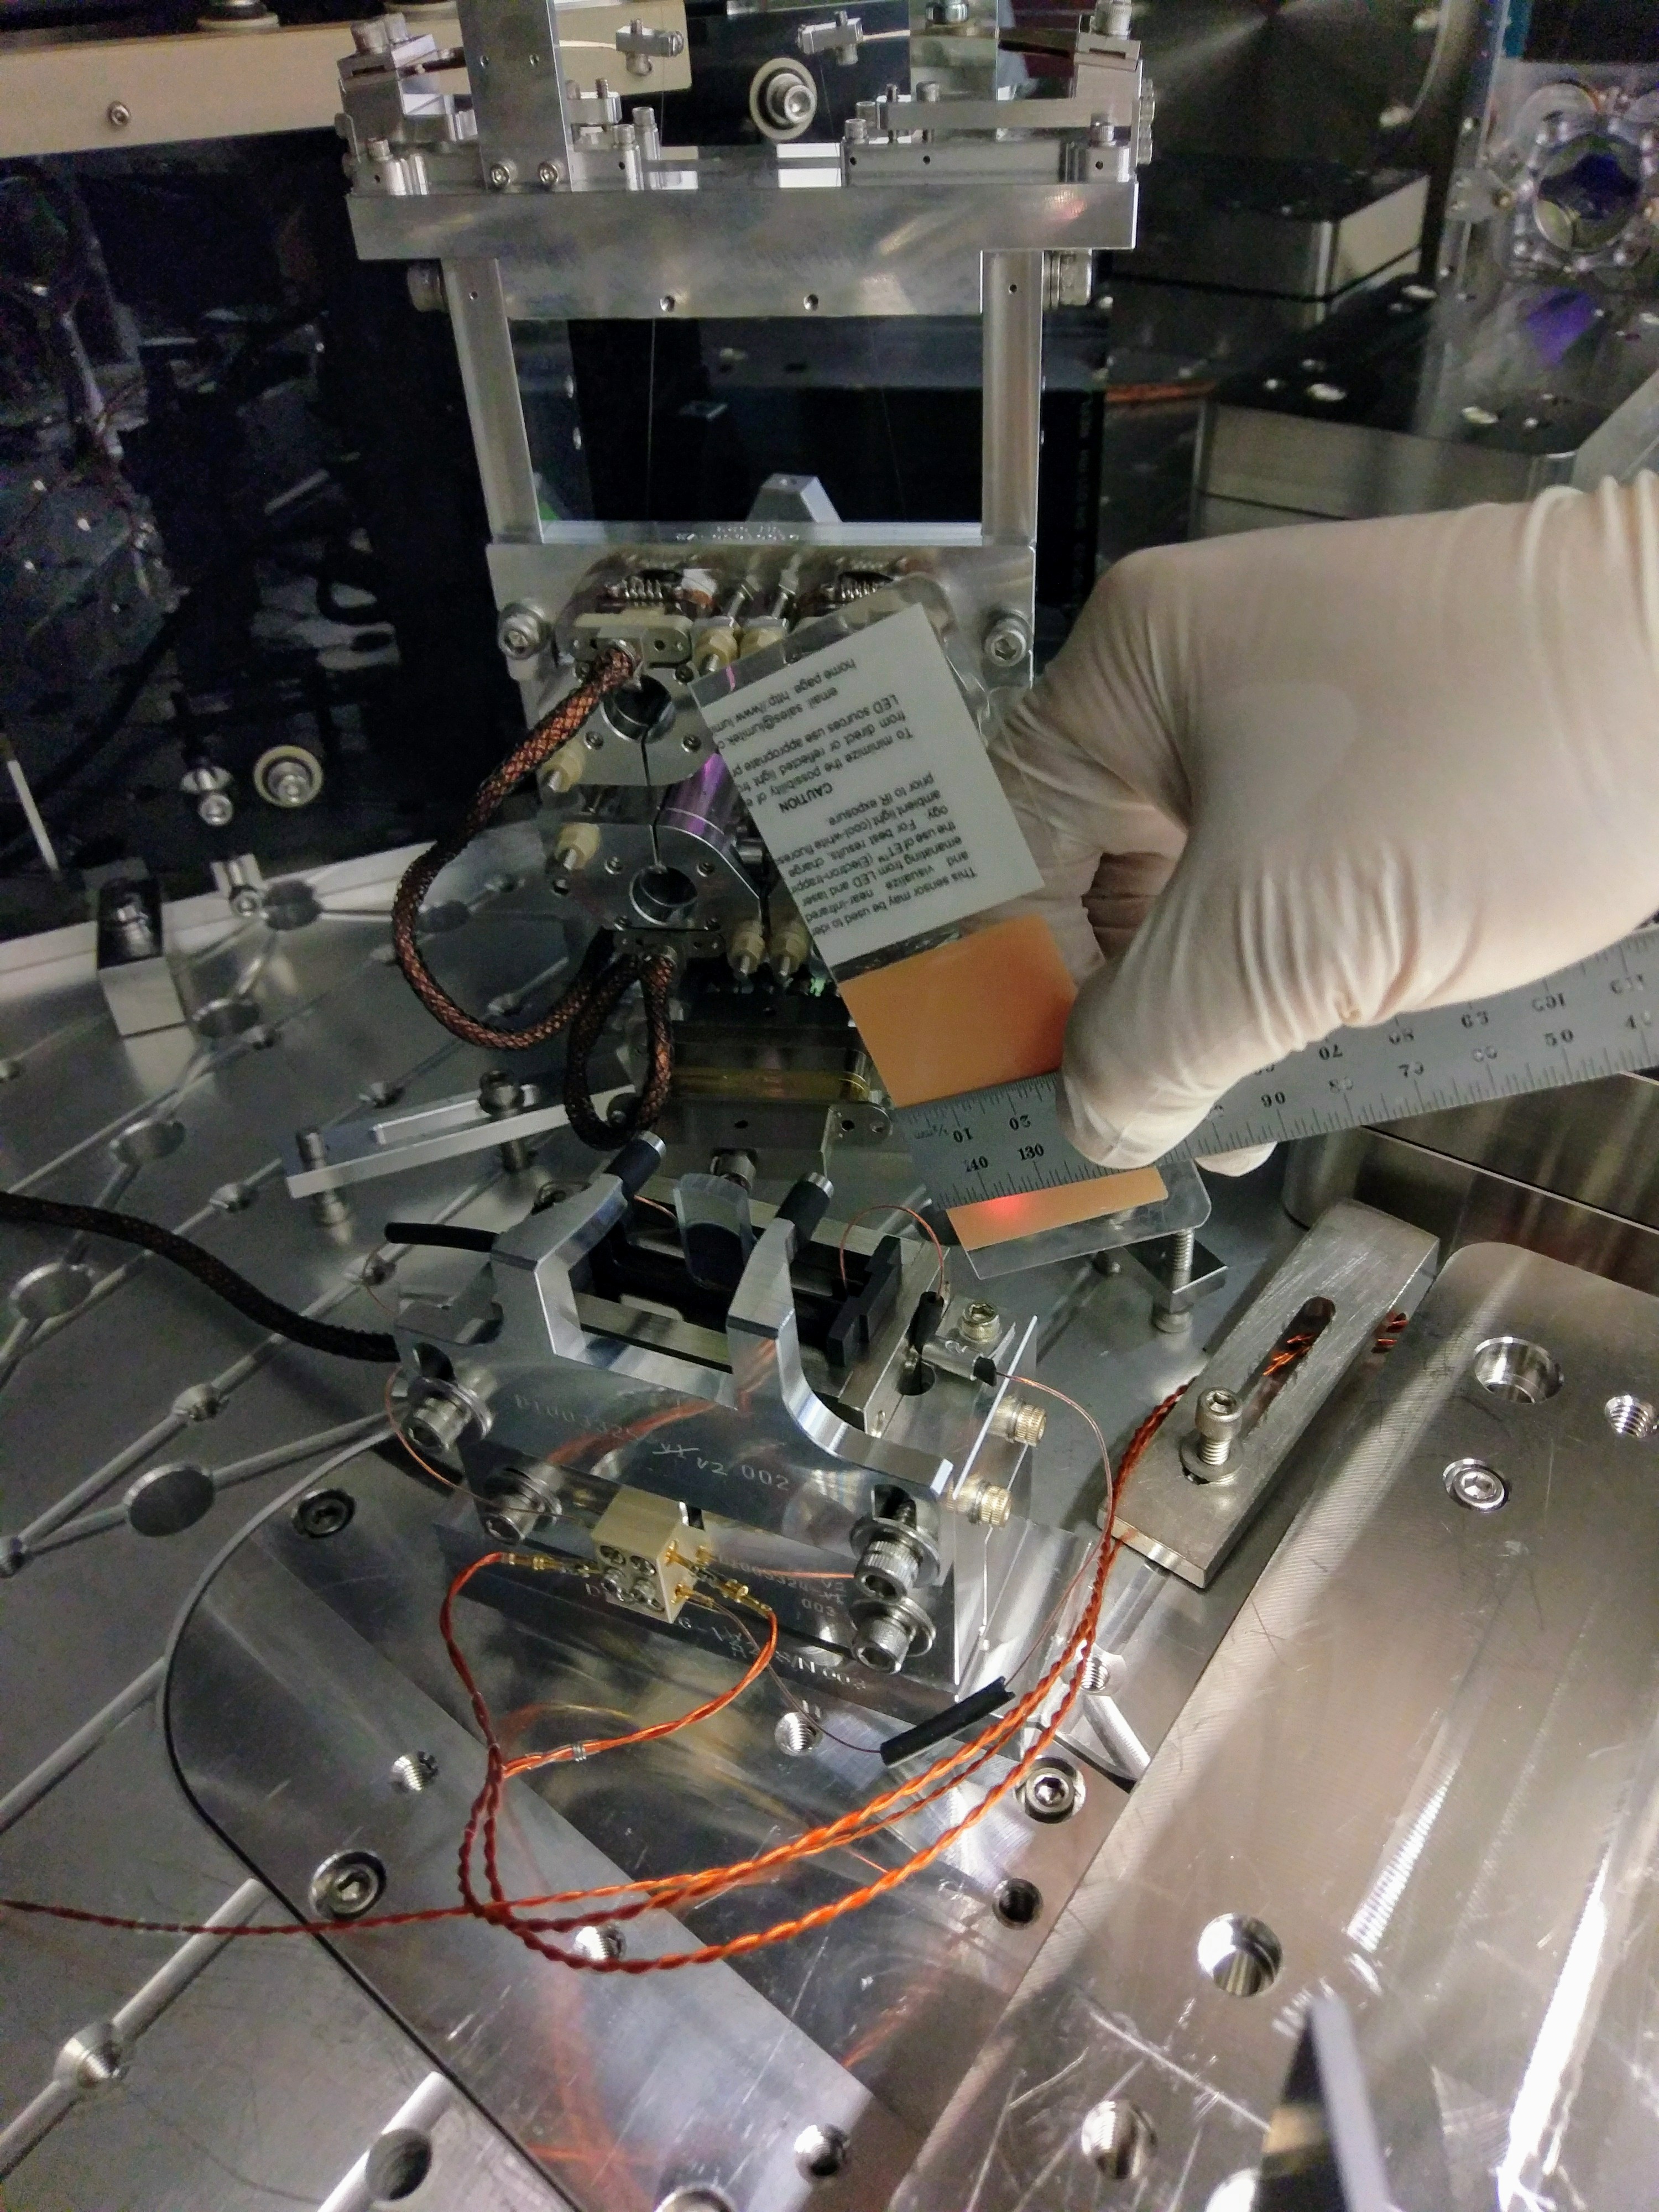
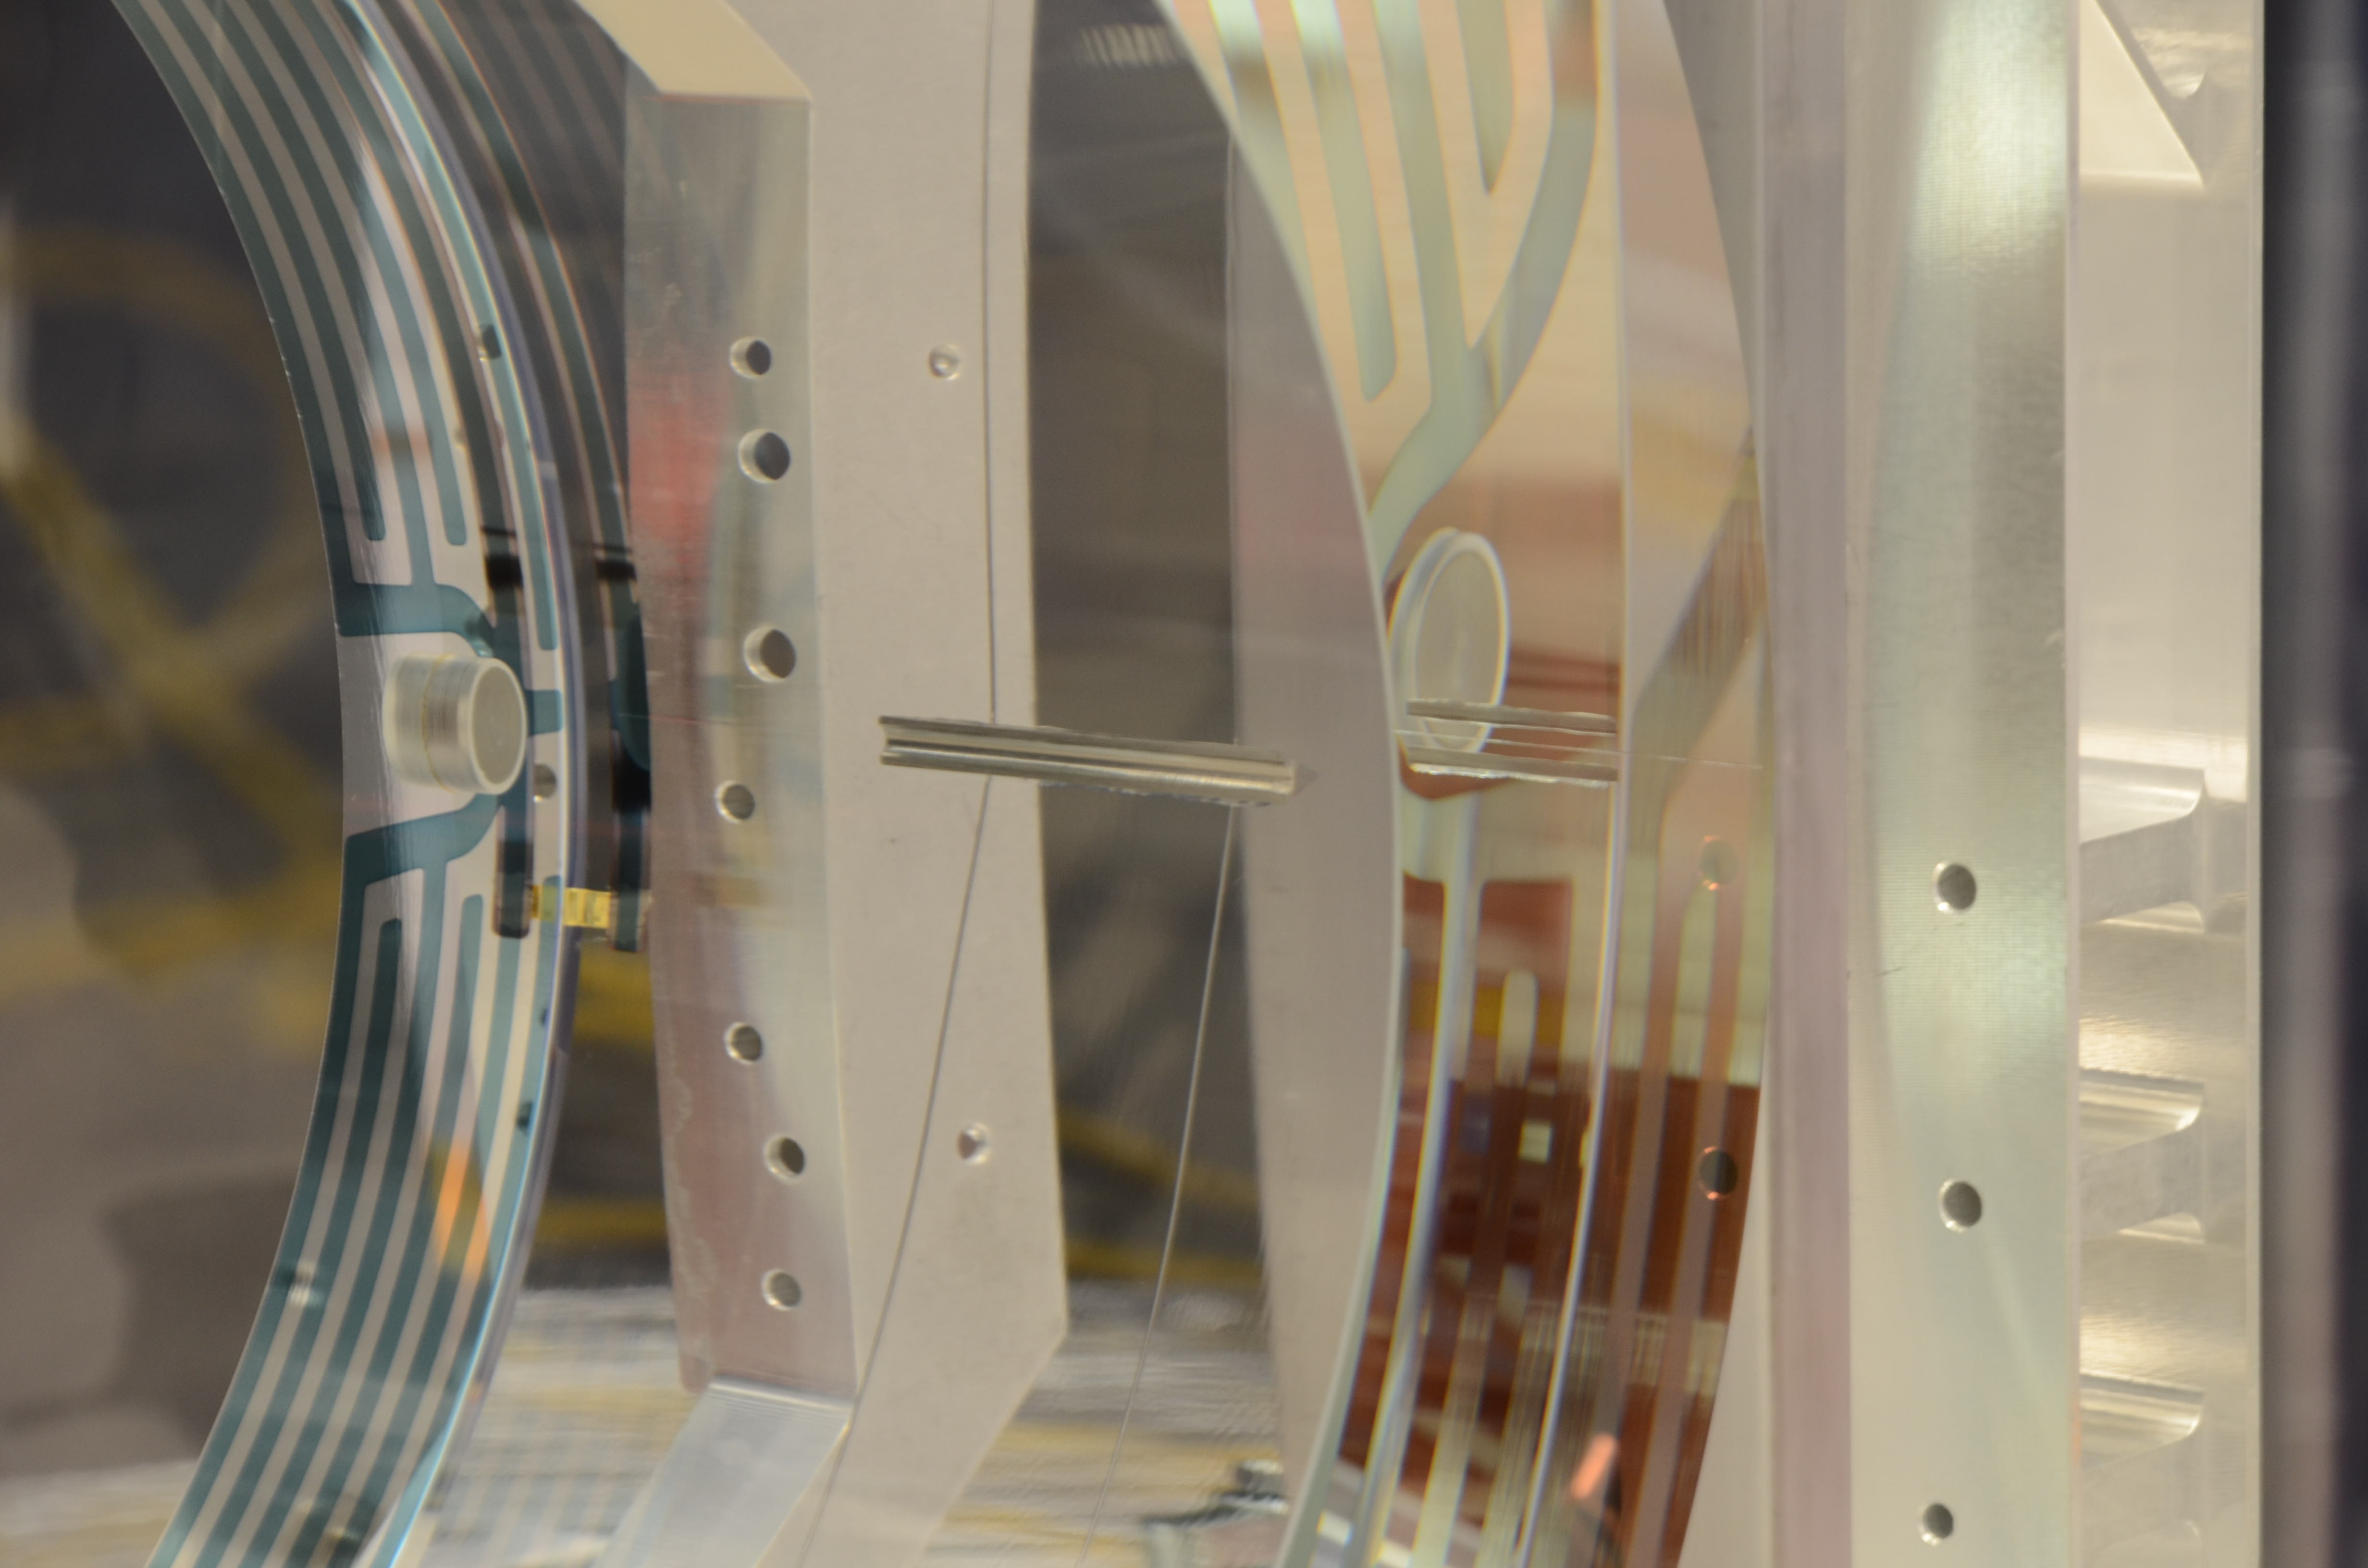
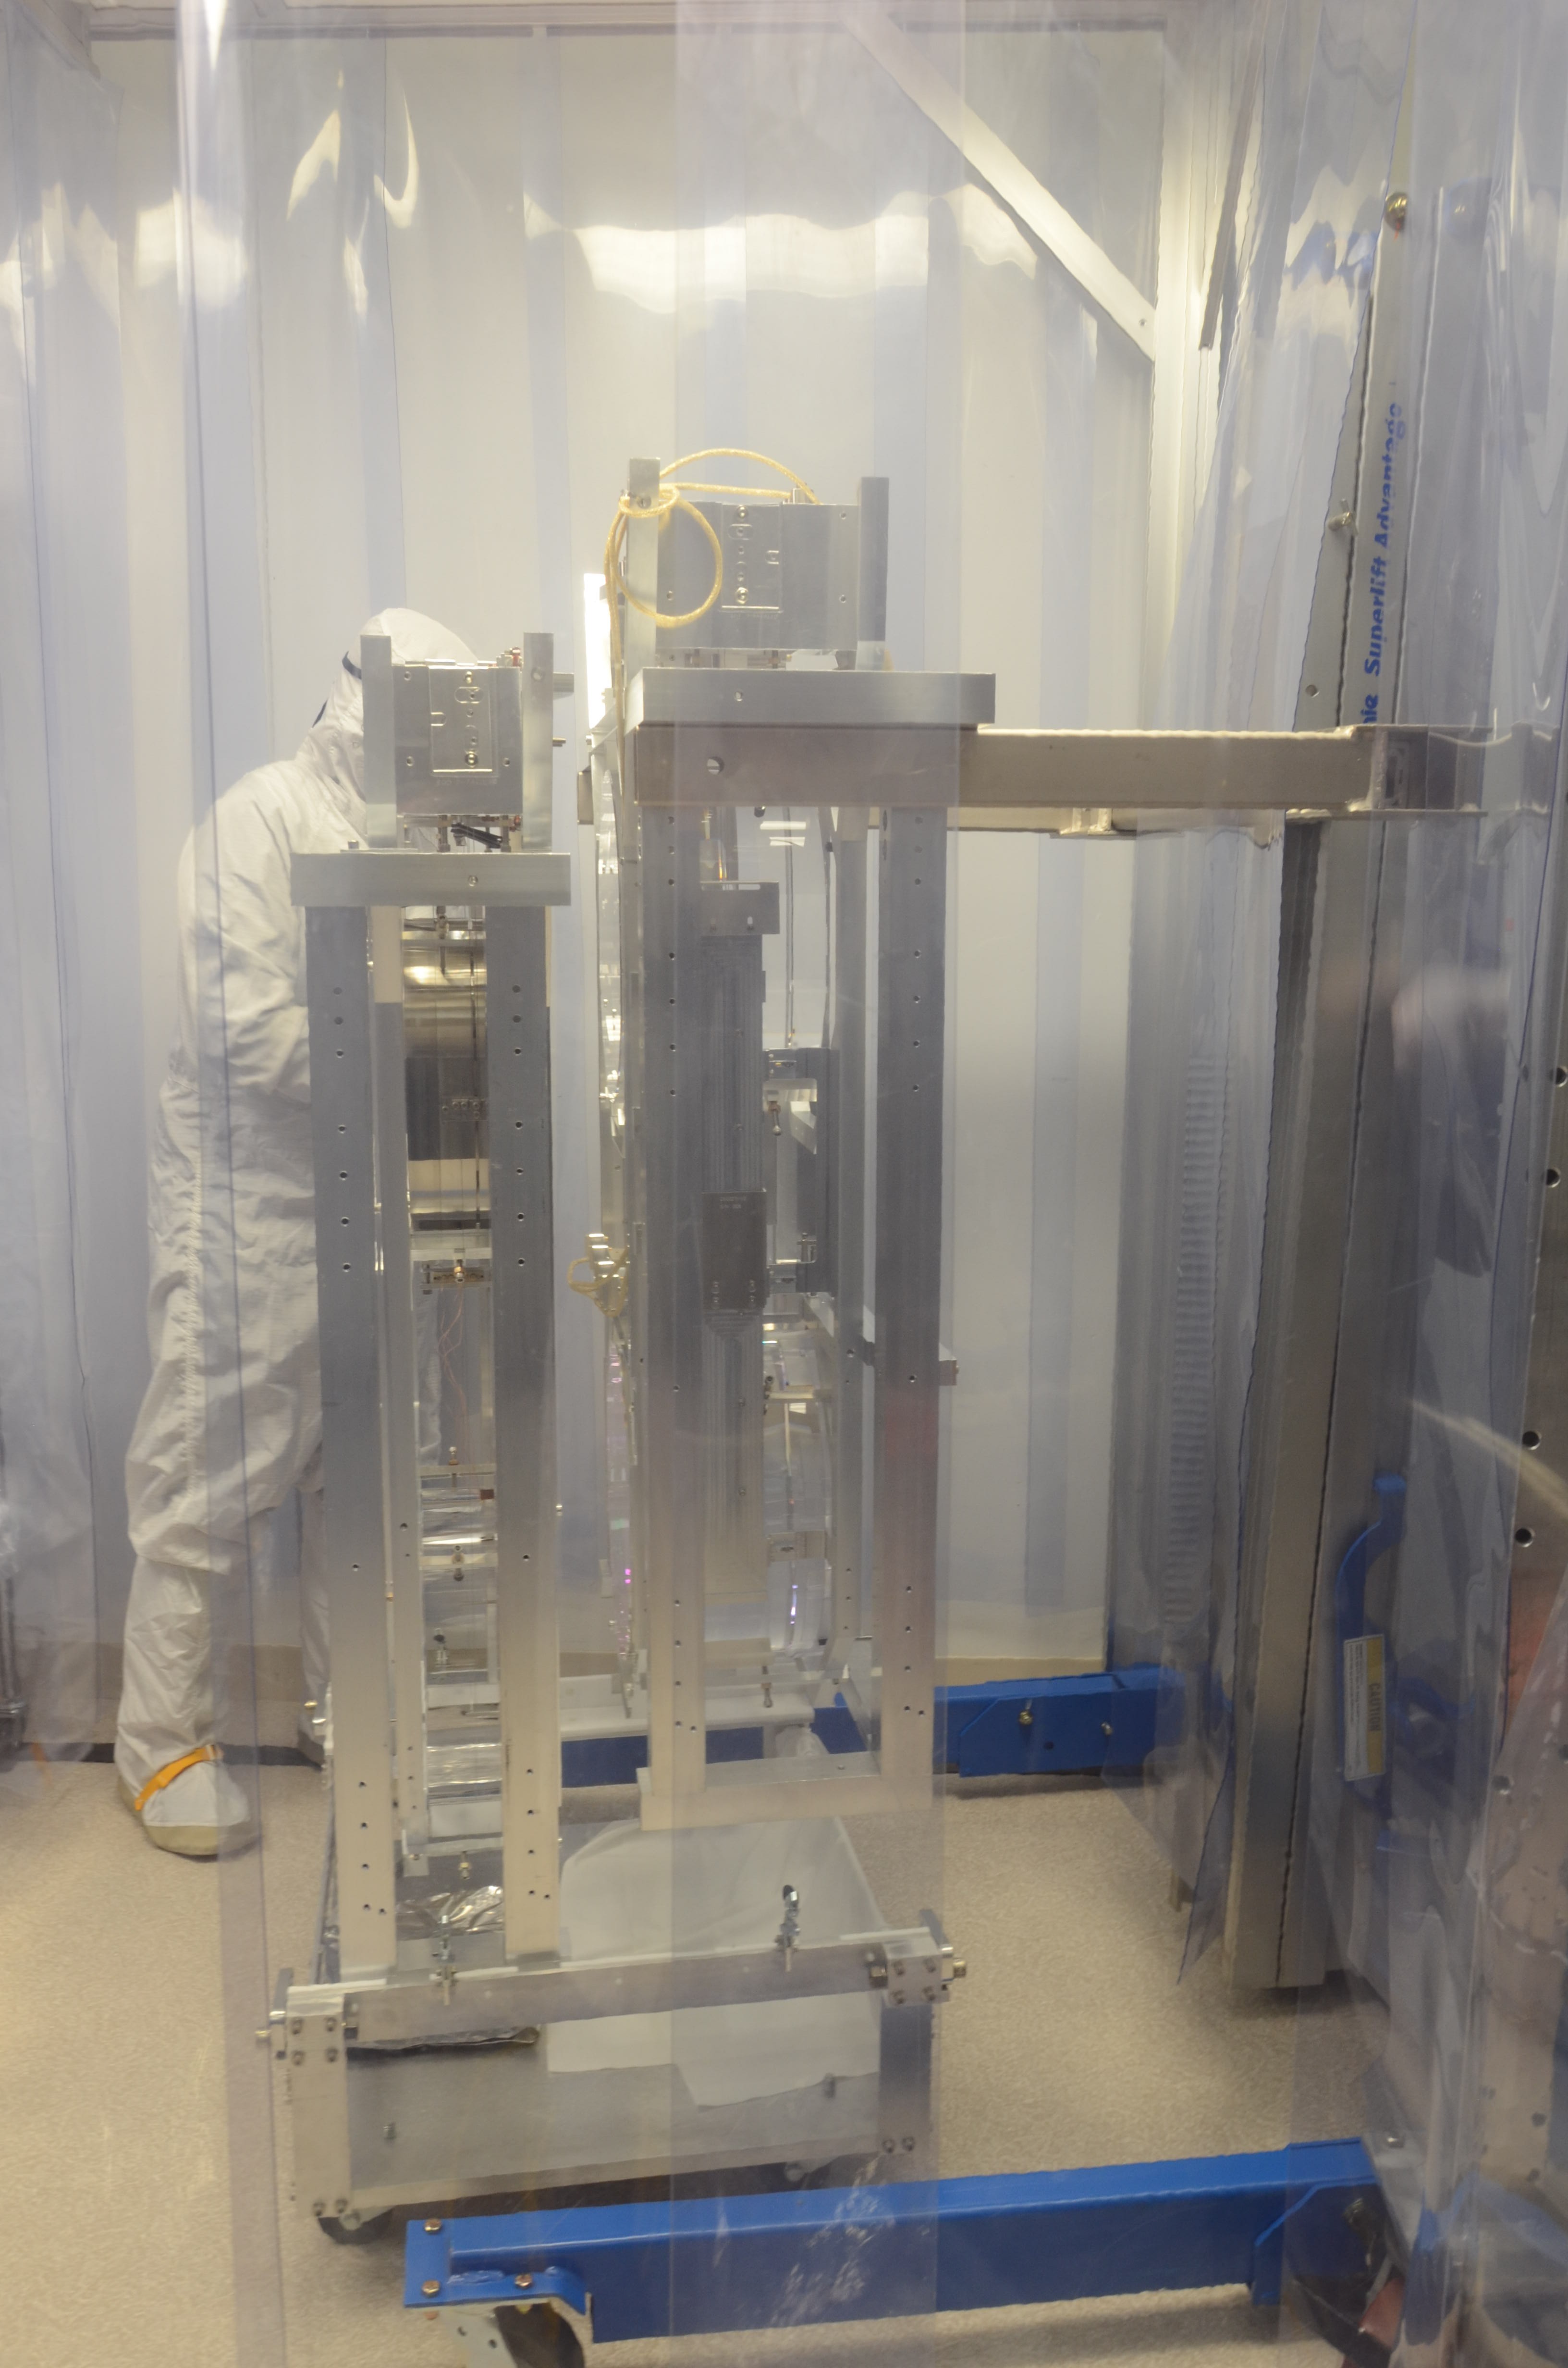
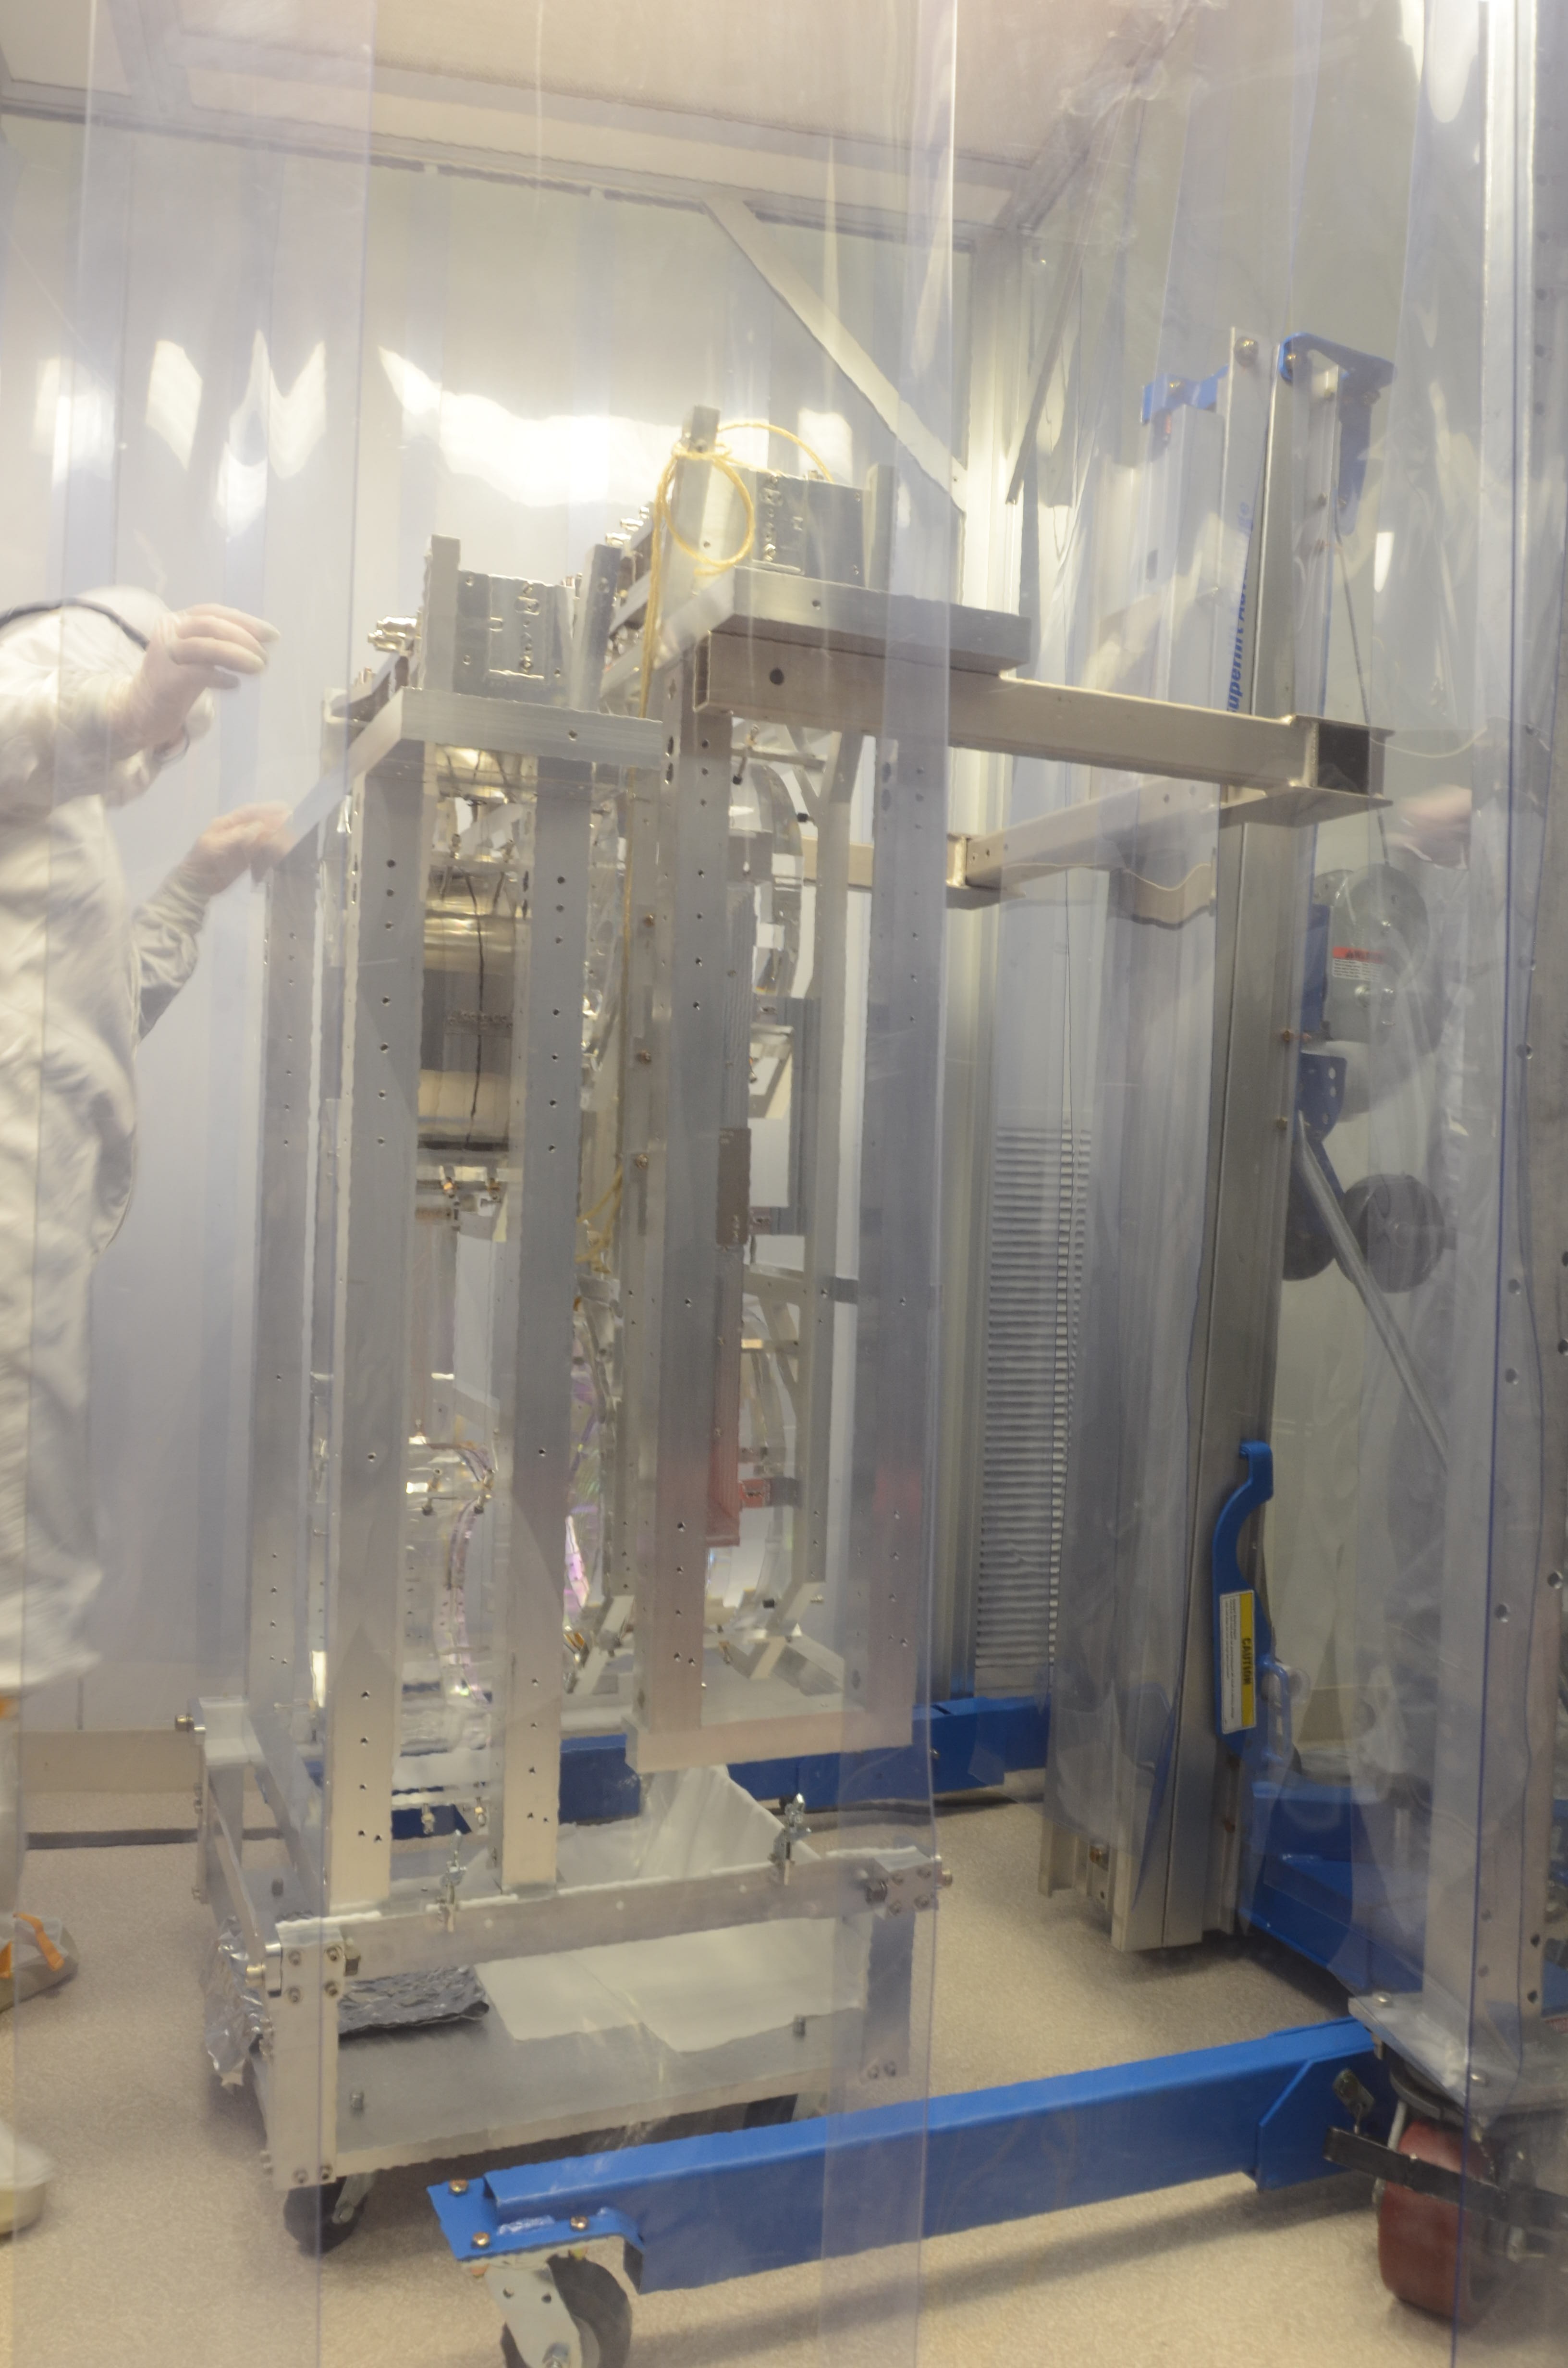
2nd: beam-FS wire distance more than 10mm.
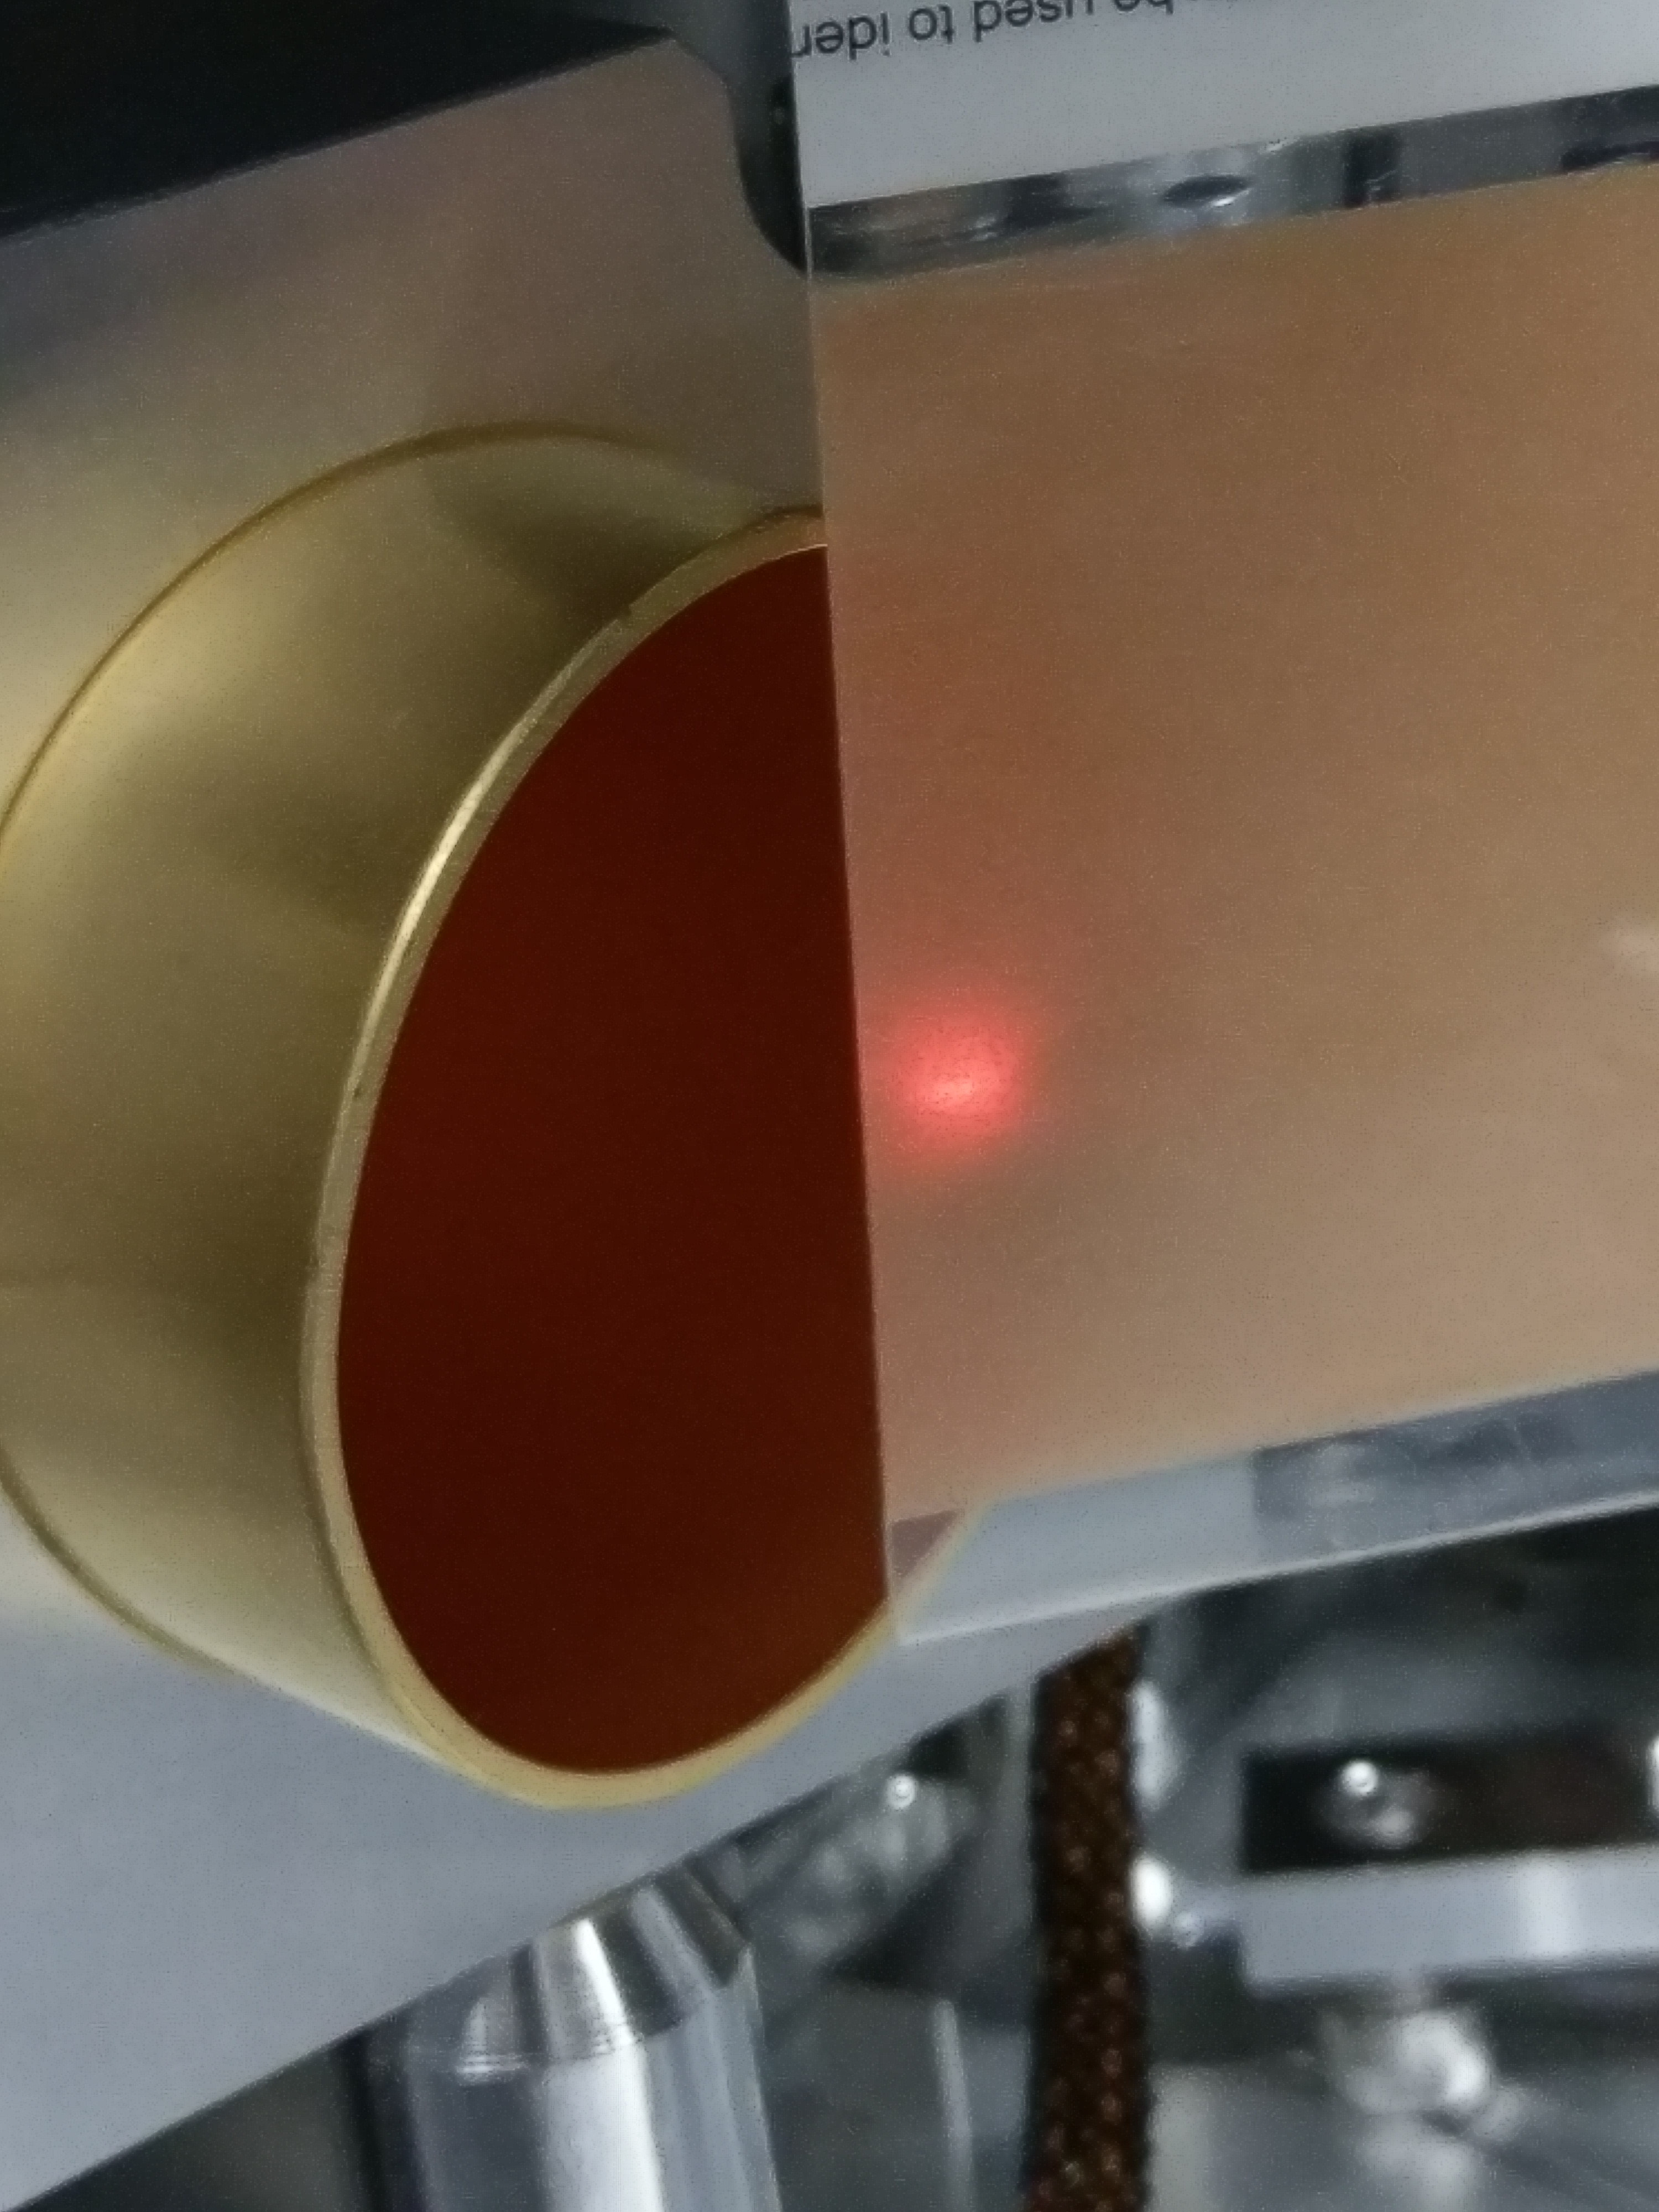
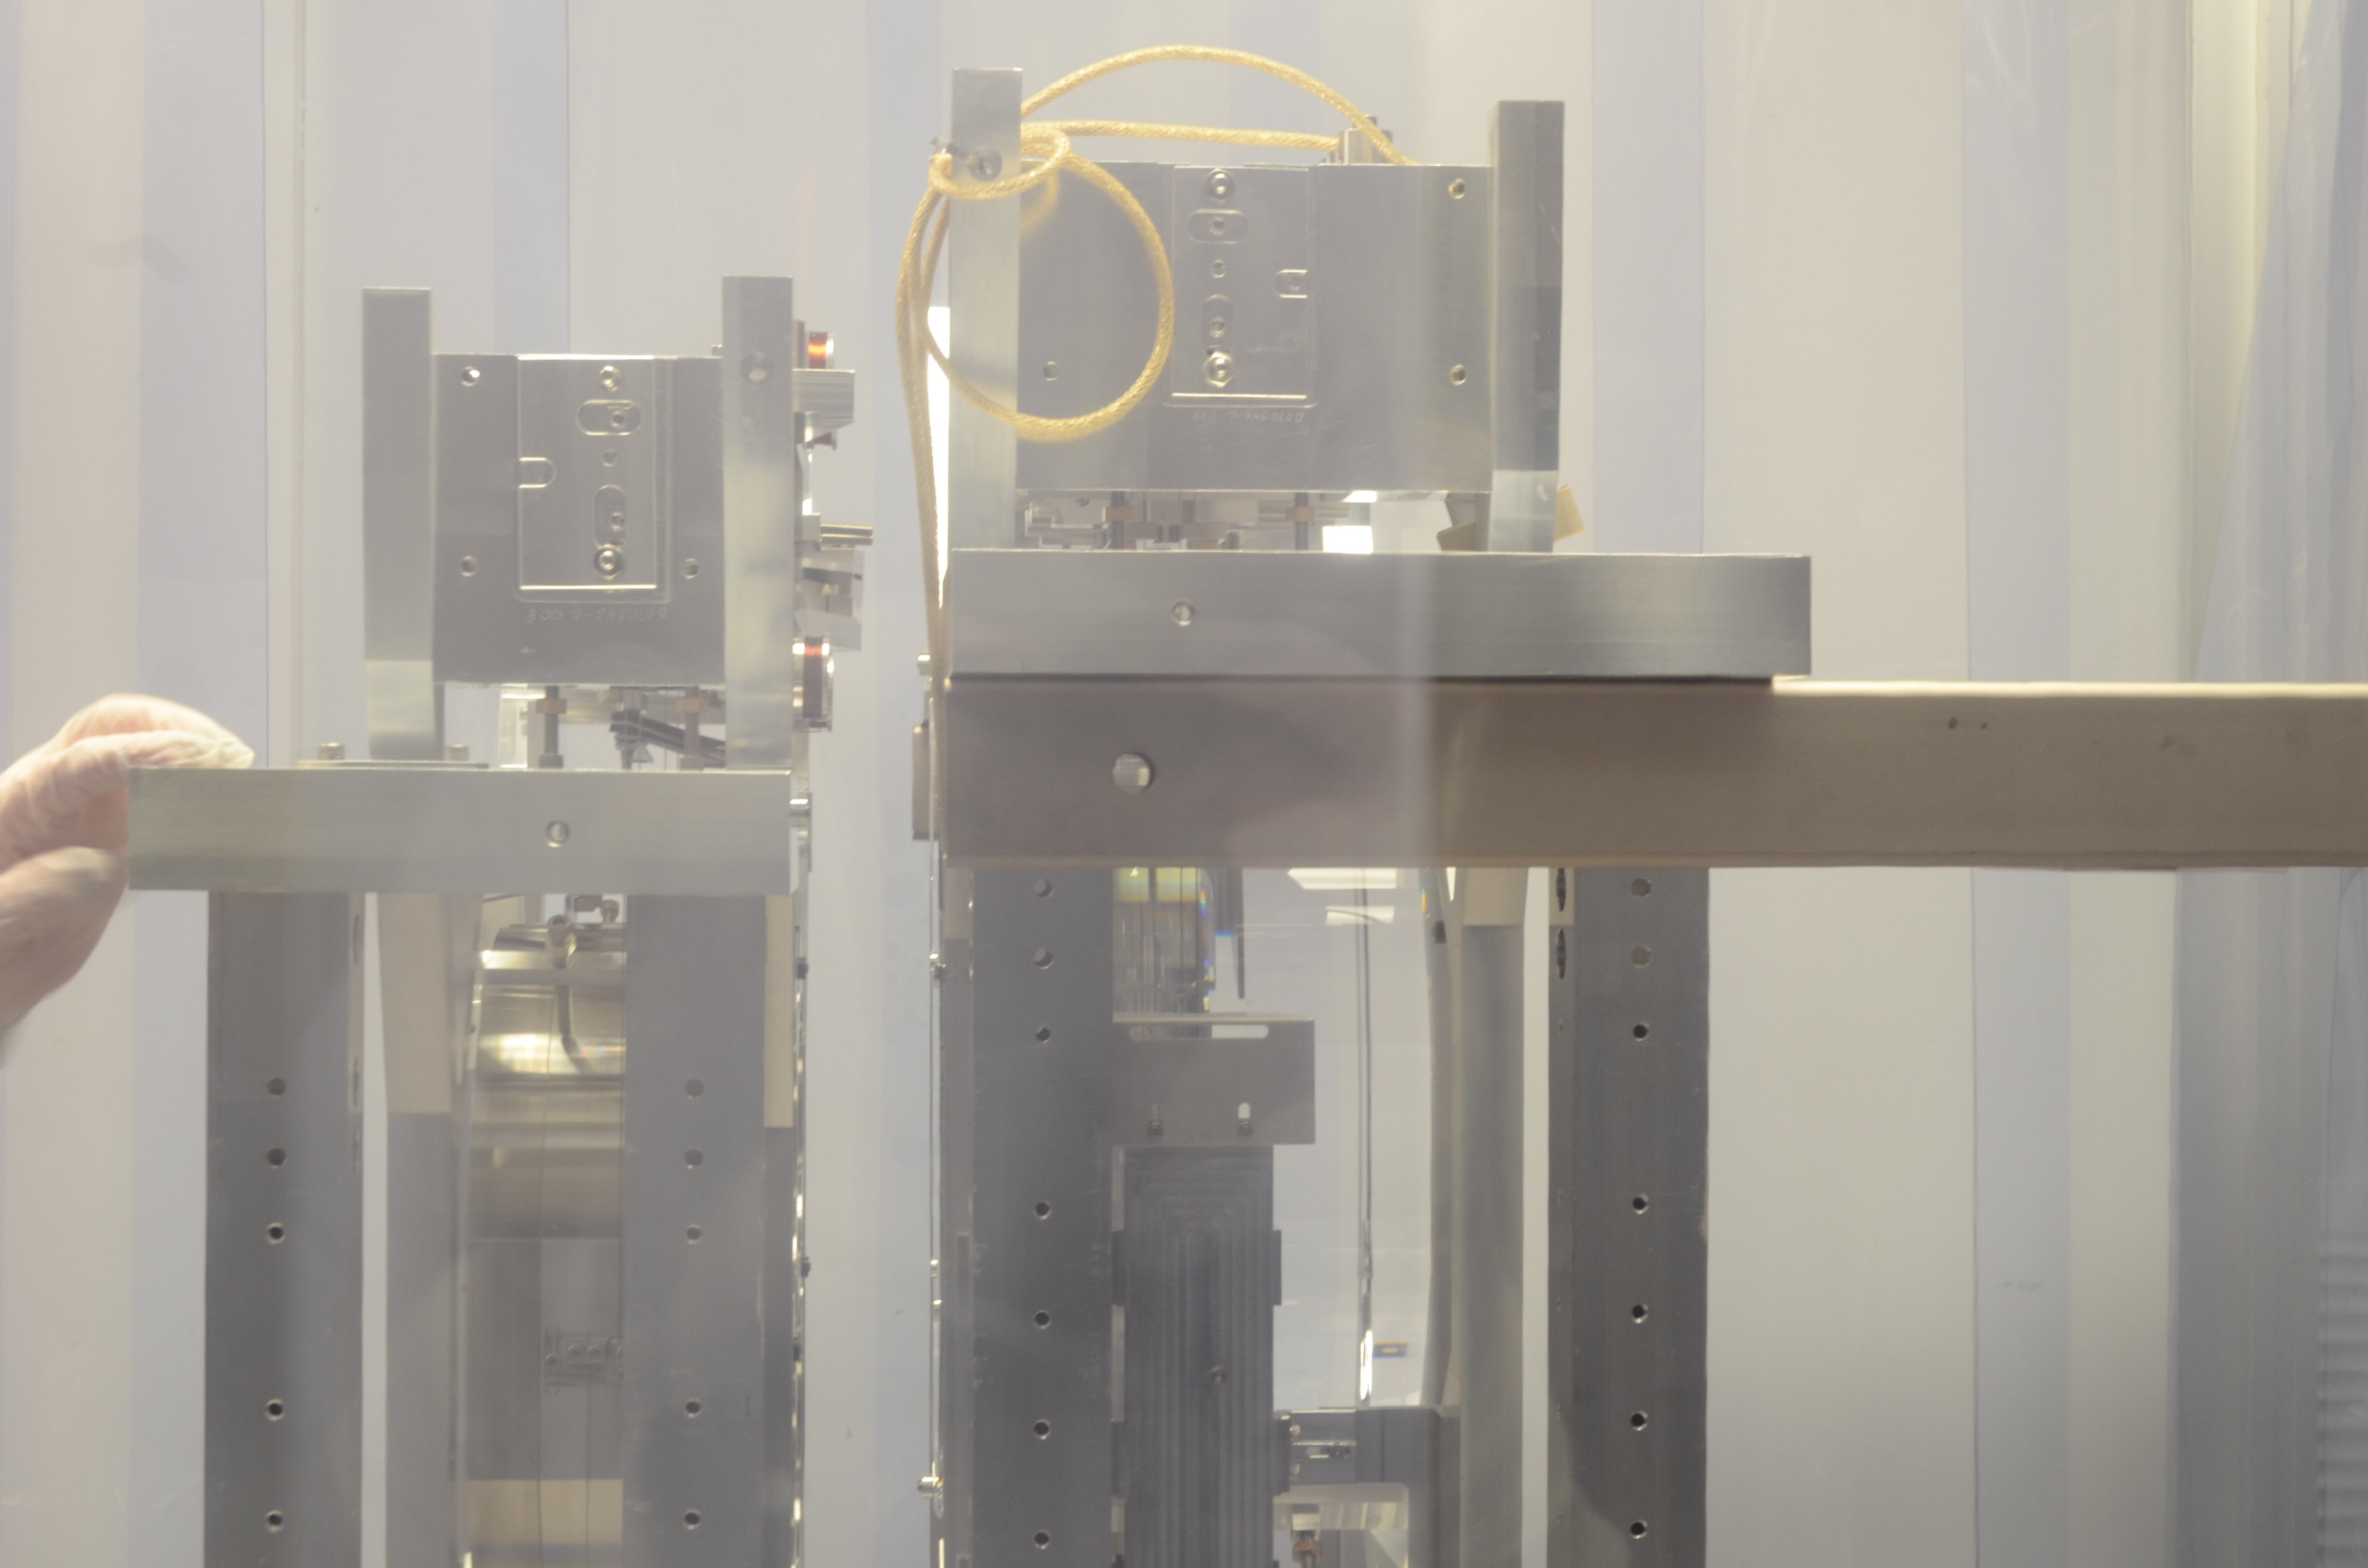
3rd: high power beam dump when FS is closed.