TITLE: 01/30 Day Shift: 16:00-00:00 UTC (08:00-16:00 PST), all times posted in UTC
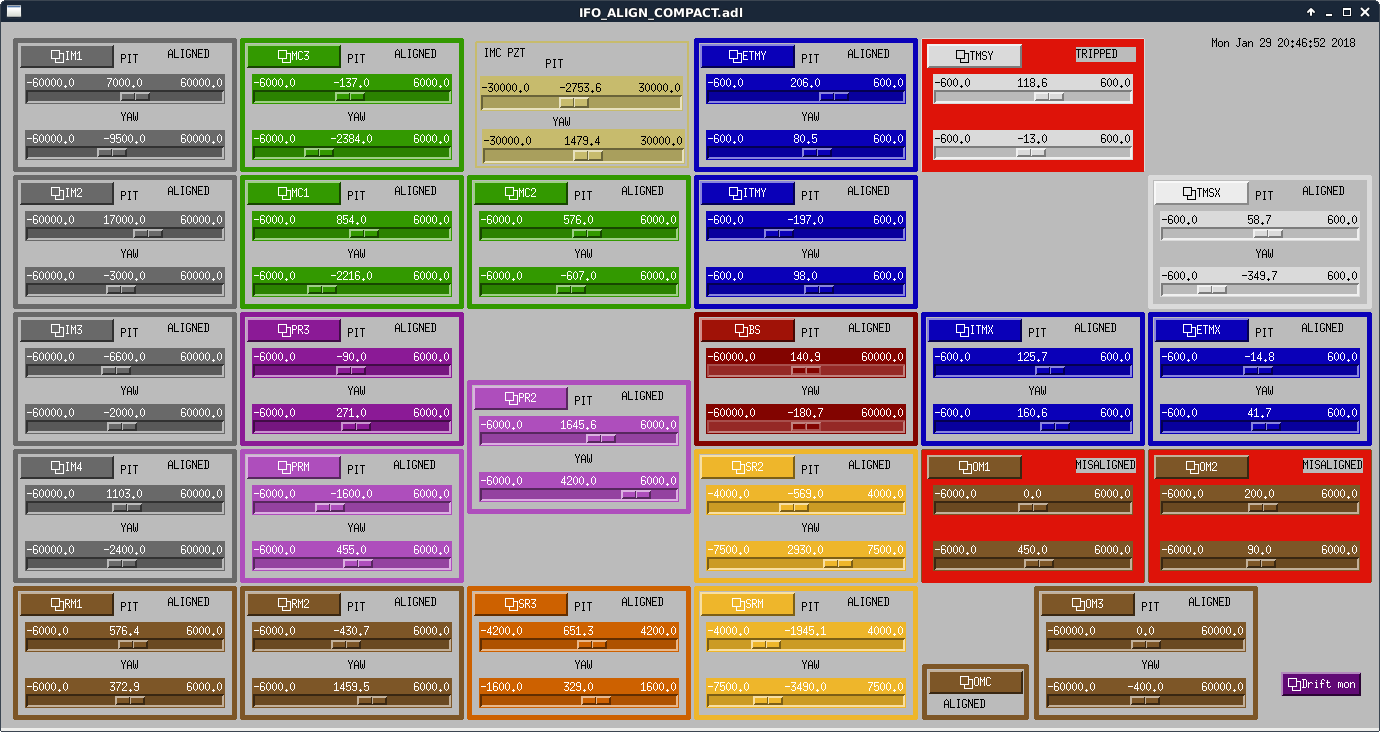
STATE of H1: Planned Engineering
INCOMING OPERATOR: None
SHIFT SUMMARY:
LOG:
15:18 (7:18) Mark and Tyler to LVEA
15:50 (7:50) Hugh to LVEA -- Surveying
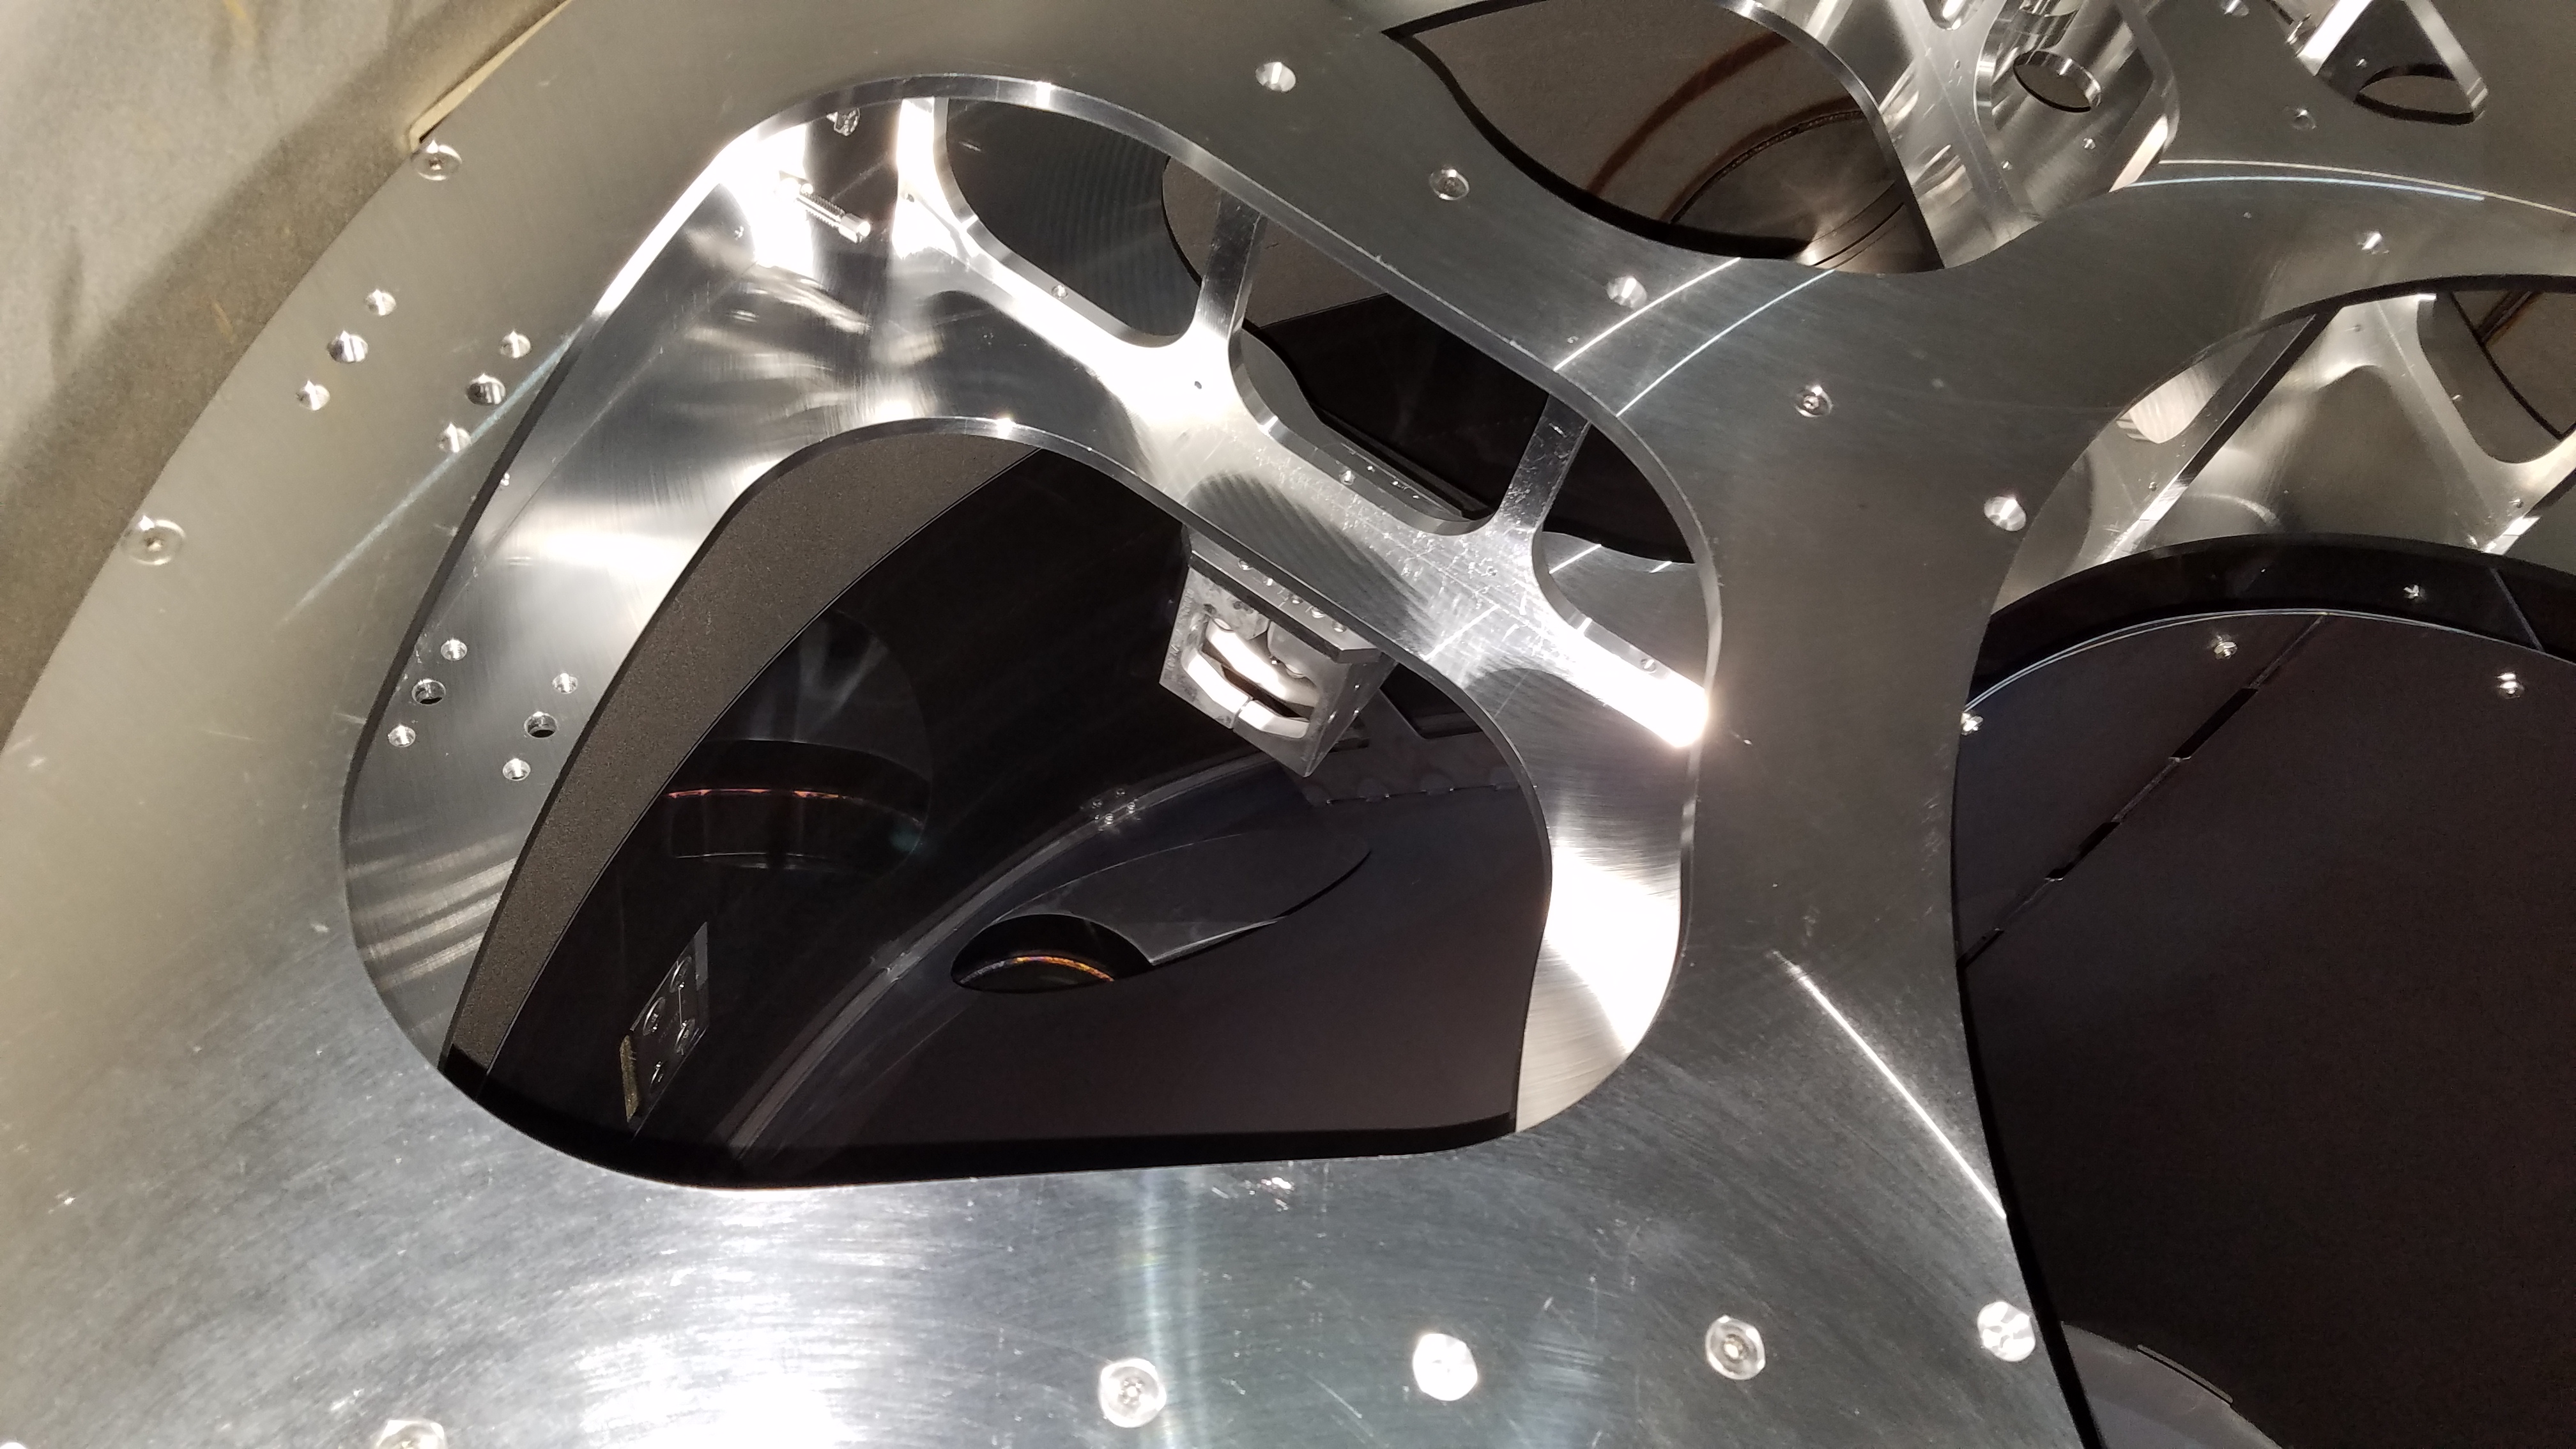
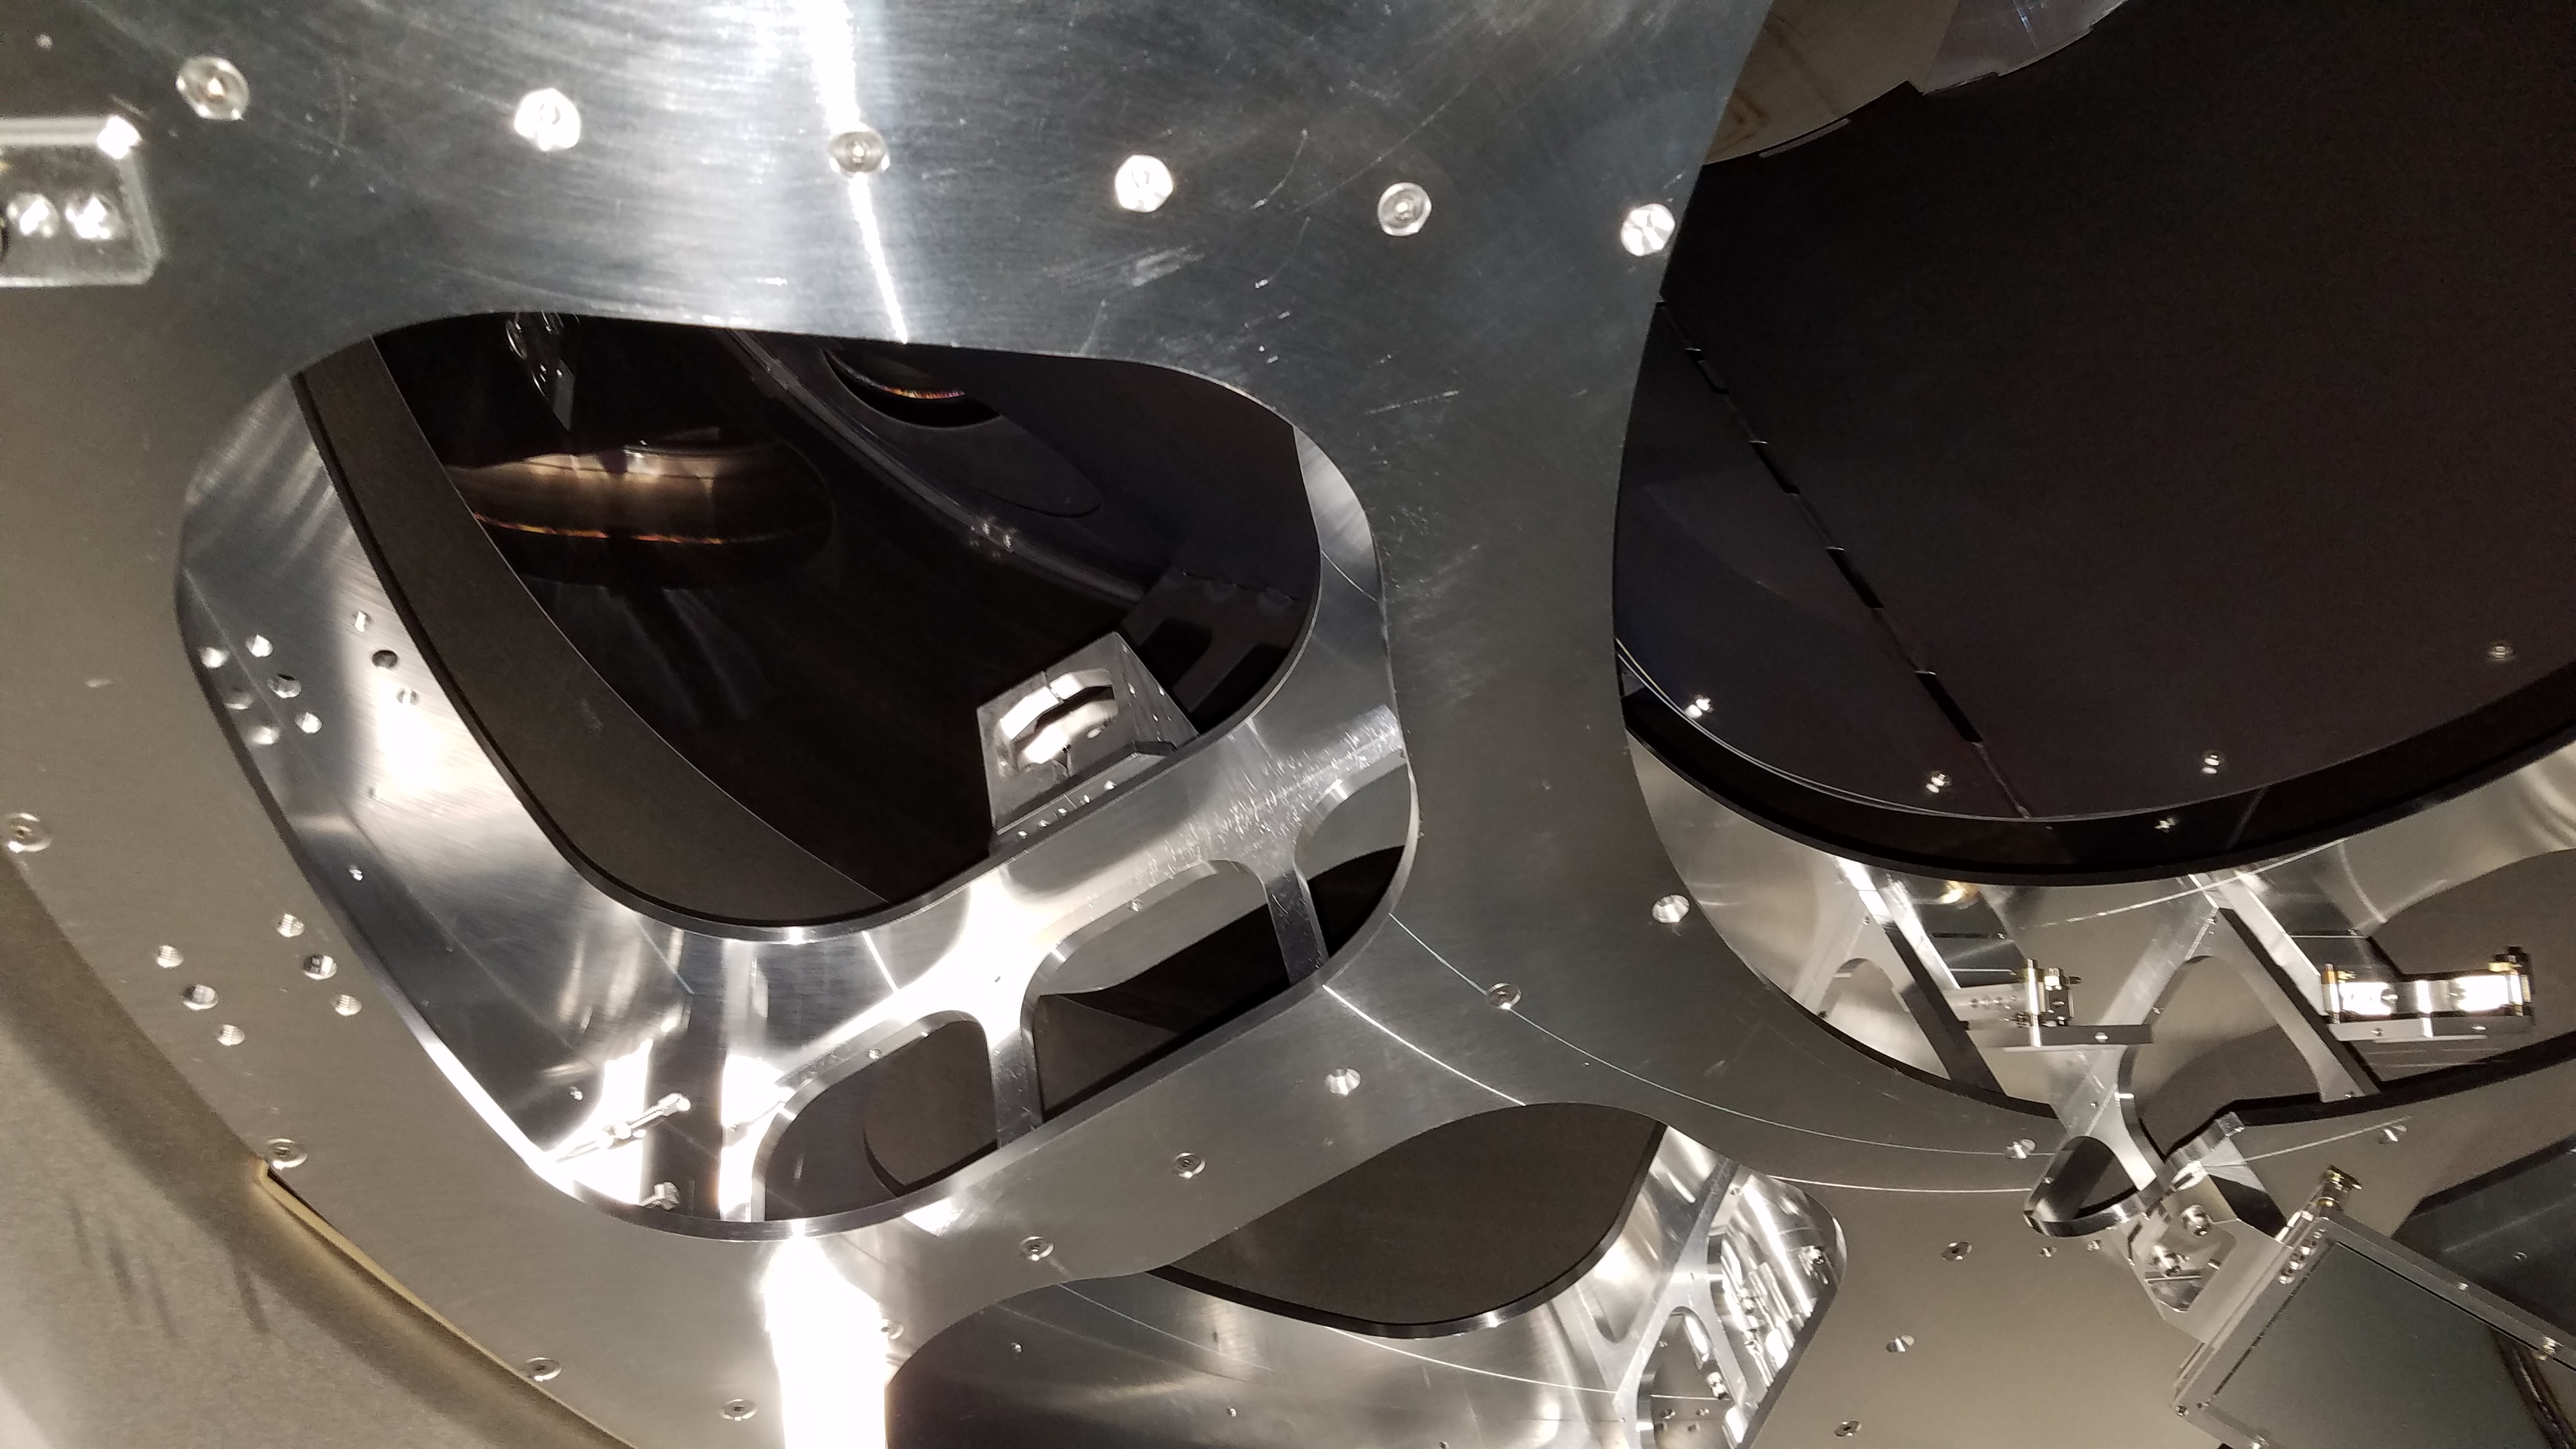
15:50 (7:50) Jeff to LVEA -- ITM-X camera work
16:00 (8:00) Start of shift
16:05 (8:05) Bubba to OMC -- Help with ion pump
16:34 (8:34) Bubba back from OMC
16:40 (8:40) Phil, Peter, Ed to diode room -- pulling fiber
16:46 (8:46) Chris to end station VEAs -- FAMIS tasks
16:52 (8:52) Tyler out of LVEA
17:03 (9:03) Mark out of LVEA -- Ion pump installed (not electrically)
17:10 (9:10) Mark to LVEA -- Find grounding bolt for ion pump
17:13 (9:13) Marc to TCS
17:16 (9:16) Tyler and Travis to End-Y -- grabbing part
17:19 (9:19) Mark out of LVEA
17:21 (9:21) Hugh out of LVEA
17:35 (9:35) Gerardo and Kyle to LVEA -- IP4 work
17:50 (9:50) Chris back from end stations, going into LVEA
17:52 (9:52) Nutsinee to SQZ bay, then Optics Lab
17:58 (9:58) Ed back from diode room
17:58 (9:58) Travis and Tyler back from End-Y
18:05 (10:05) Gerardo and Kyle out of LVEA
18:26 (10:26) Chris back from LVEA
18:28 (10:28) TVo and Sheila to HAM6
18:30 (10:30) Betsy to LVEA -- Find parts
18:34 (10:34) Terry to SQZ BAY
18:54 (10:54) Betsy out of LVEA
19:06 (11:06) Gerardo and Kyle to LVEA -- IP4 work
19:20 (11:20) TVo and Sheila back from HAM6
19:44 (11:44) Gerardo and Kyle out of LVEA -- IP4 work still in progress
20:11 (12:11) Daniel out of SQZ bay
20:52 (12:52) Nutsinee out of Optics Lab
21:04 (13:04) Betsy and Travis to End-Y -- Assembling ETMY
21:11 (13:11) Bartlett to LVEA -- Remove dust monitors
21:15 (13:15) Ed to CER -- Cable work
21:26 (13:26) Ed back from CER
21:26 (13:26) Ed and Phil to CER -- Re-terminate cables
21:39 (13:39) Kyle to Y-Mid
21:39 (13:39) Nutsinee to Optics Lab
21:46 (13:46) Jenne, TVo, Sheila to HAM6
21:48 (13:48) Marc to LVEA -- Re-terminate cables
21:52 (13:52) Ed, Marc, and Phil back from CER
21:58 (13:58) Corey to End-X -- Organizing
22:09 (14:09) Phil to End-Y -- Taking measurements
22:38 (14:38) Georgia and Cheryl to HAM6
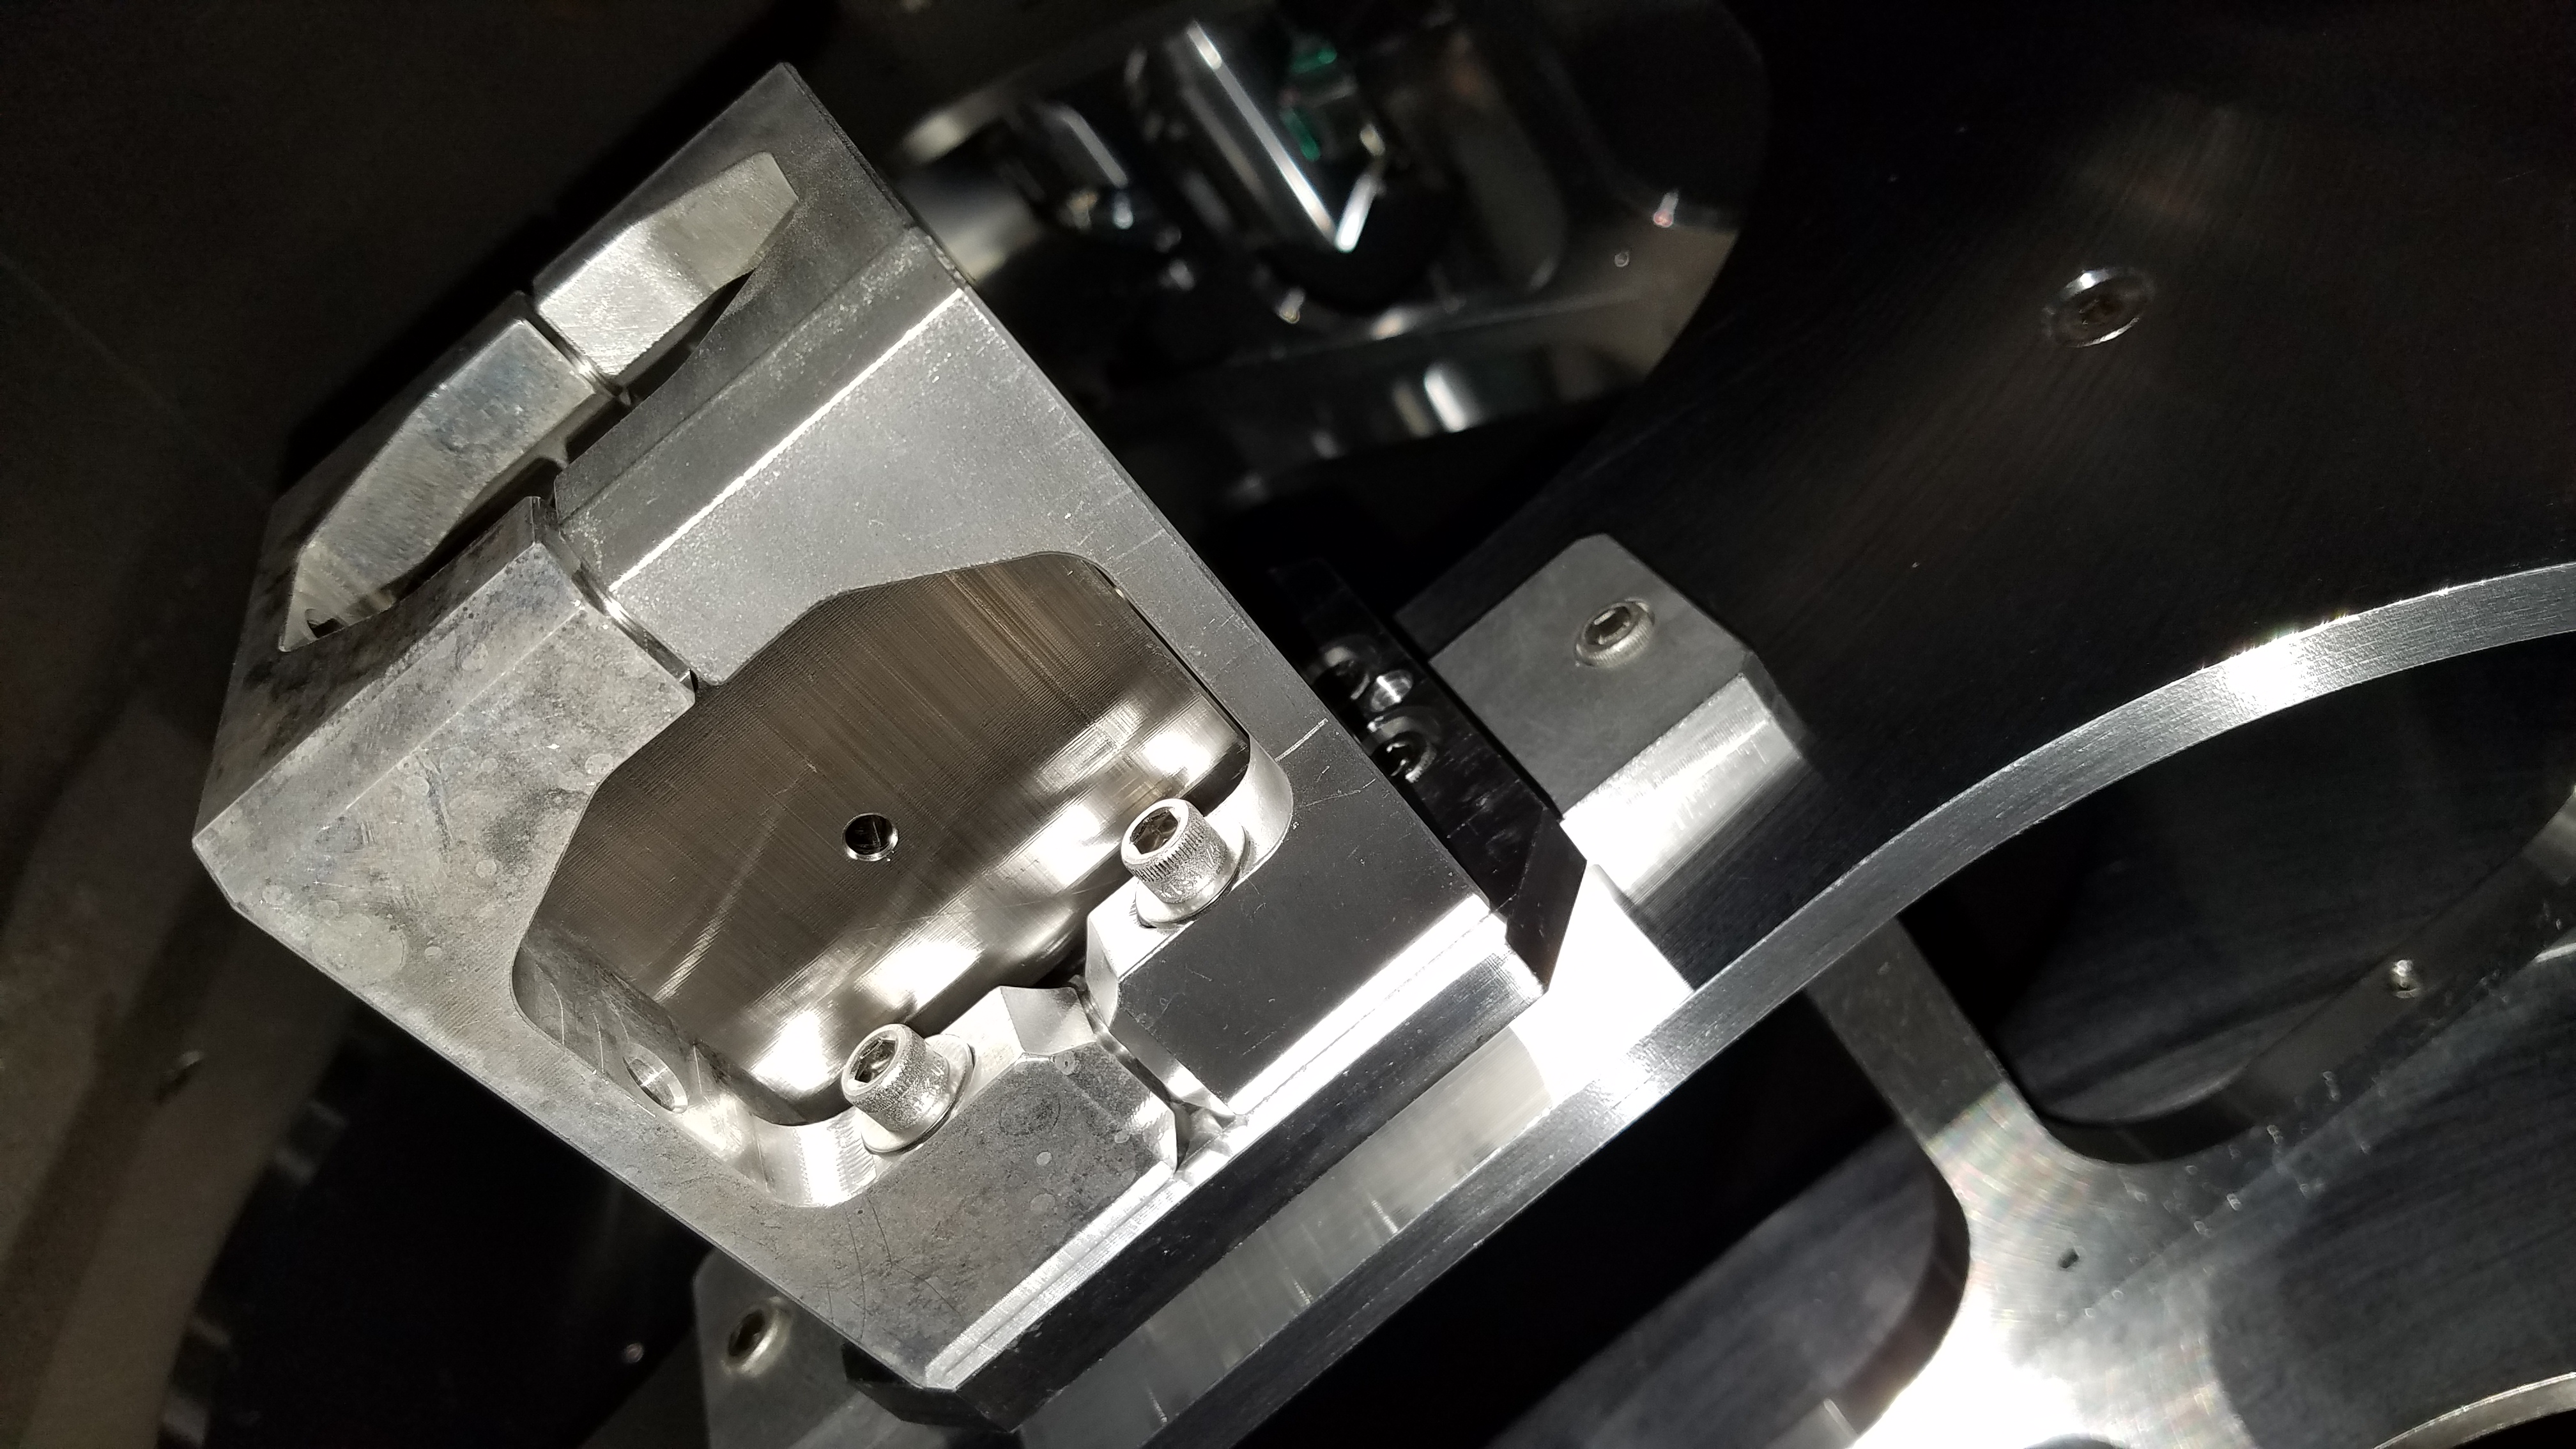
22:54 (14:54) Gerardo to CP1 -- Take photo of setup
22:53 (14:53) Cheryl back from HAM6
23:00 (15:00) Corey back from End-X
23:05 (15:05) Gerardo back from End-Y
23:07 (15:07) Nutsinee back from Optics Lab
23:10 (15:10) Kyle back from Y-Mid
23:12 (15:12) Betsy and Travis back from End-Y
23:12 (15:12) Betsy to LVEA -- Put away materials
23:15 (15:15) Chandra to LVEA
23:22 (15:22) Travis to LVEA
23:22 (15:22) Daniel and Nutsinee to SQZ Bay
23:27 (15:27) Corey to Optics Lab -- delivering part
23:30 (15:30) Ken back from End-X
23:39 (15:39) Corey back from Optics Lab
23:47 (15:47) Travis out of LVEA
00:00 (16:00) End of shift