Nutsinee, Sheila, Daniel
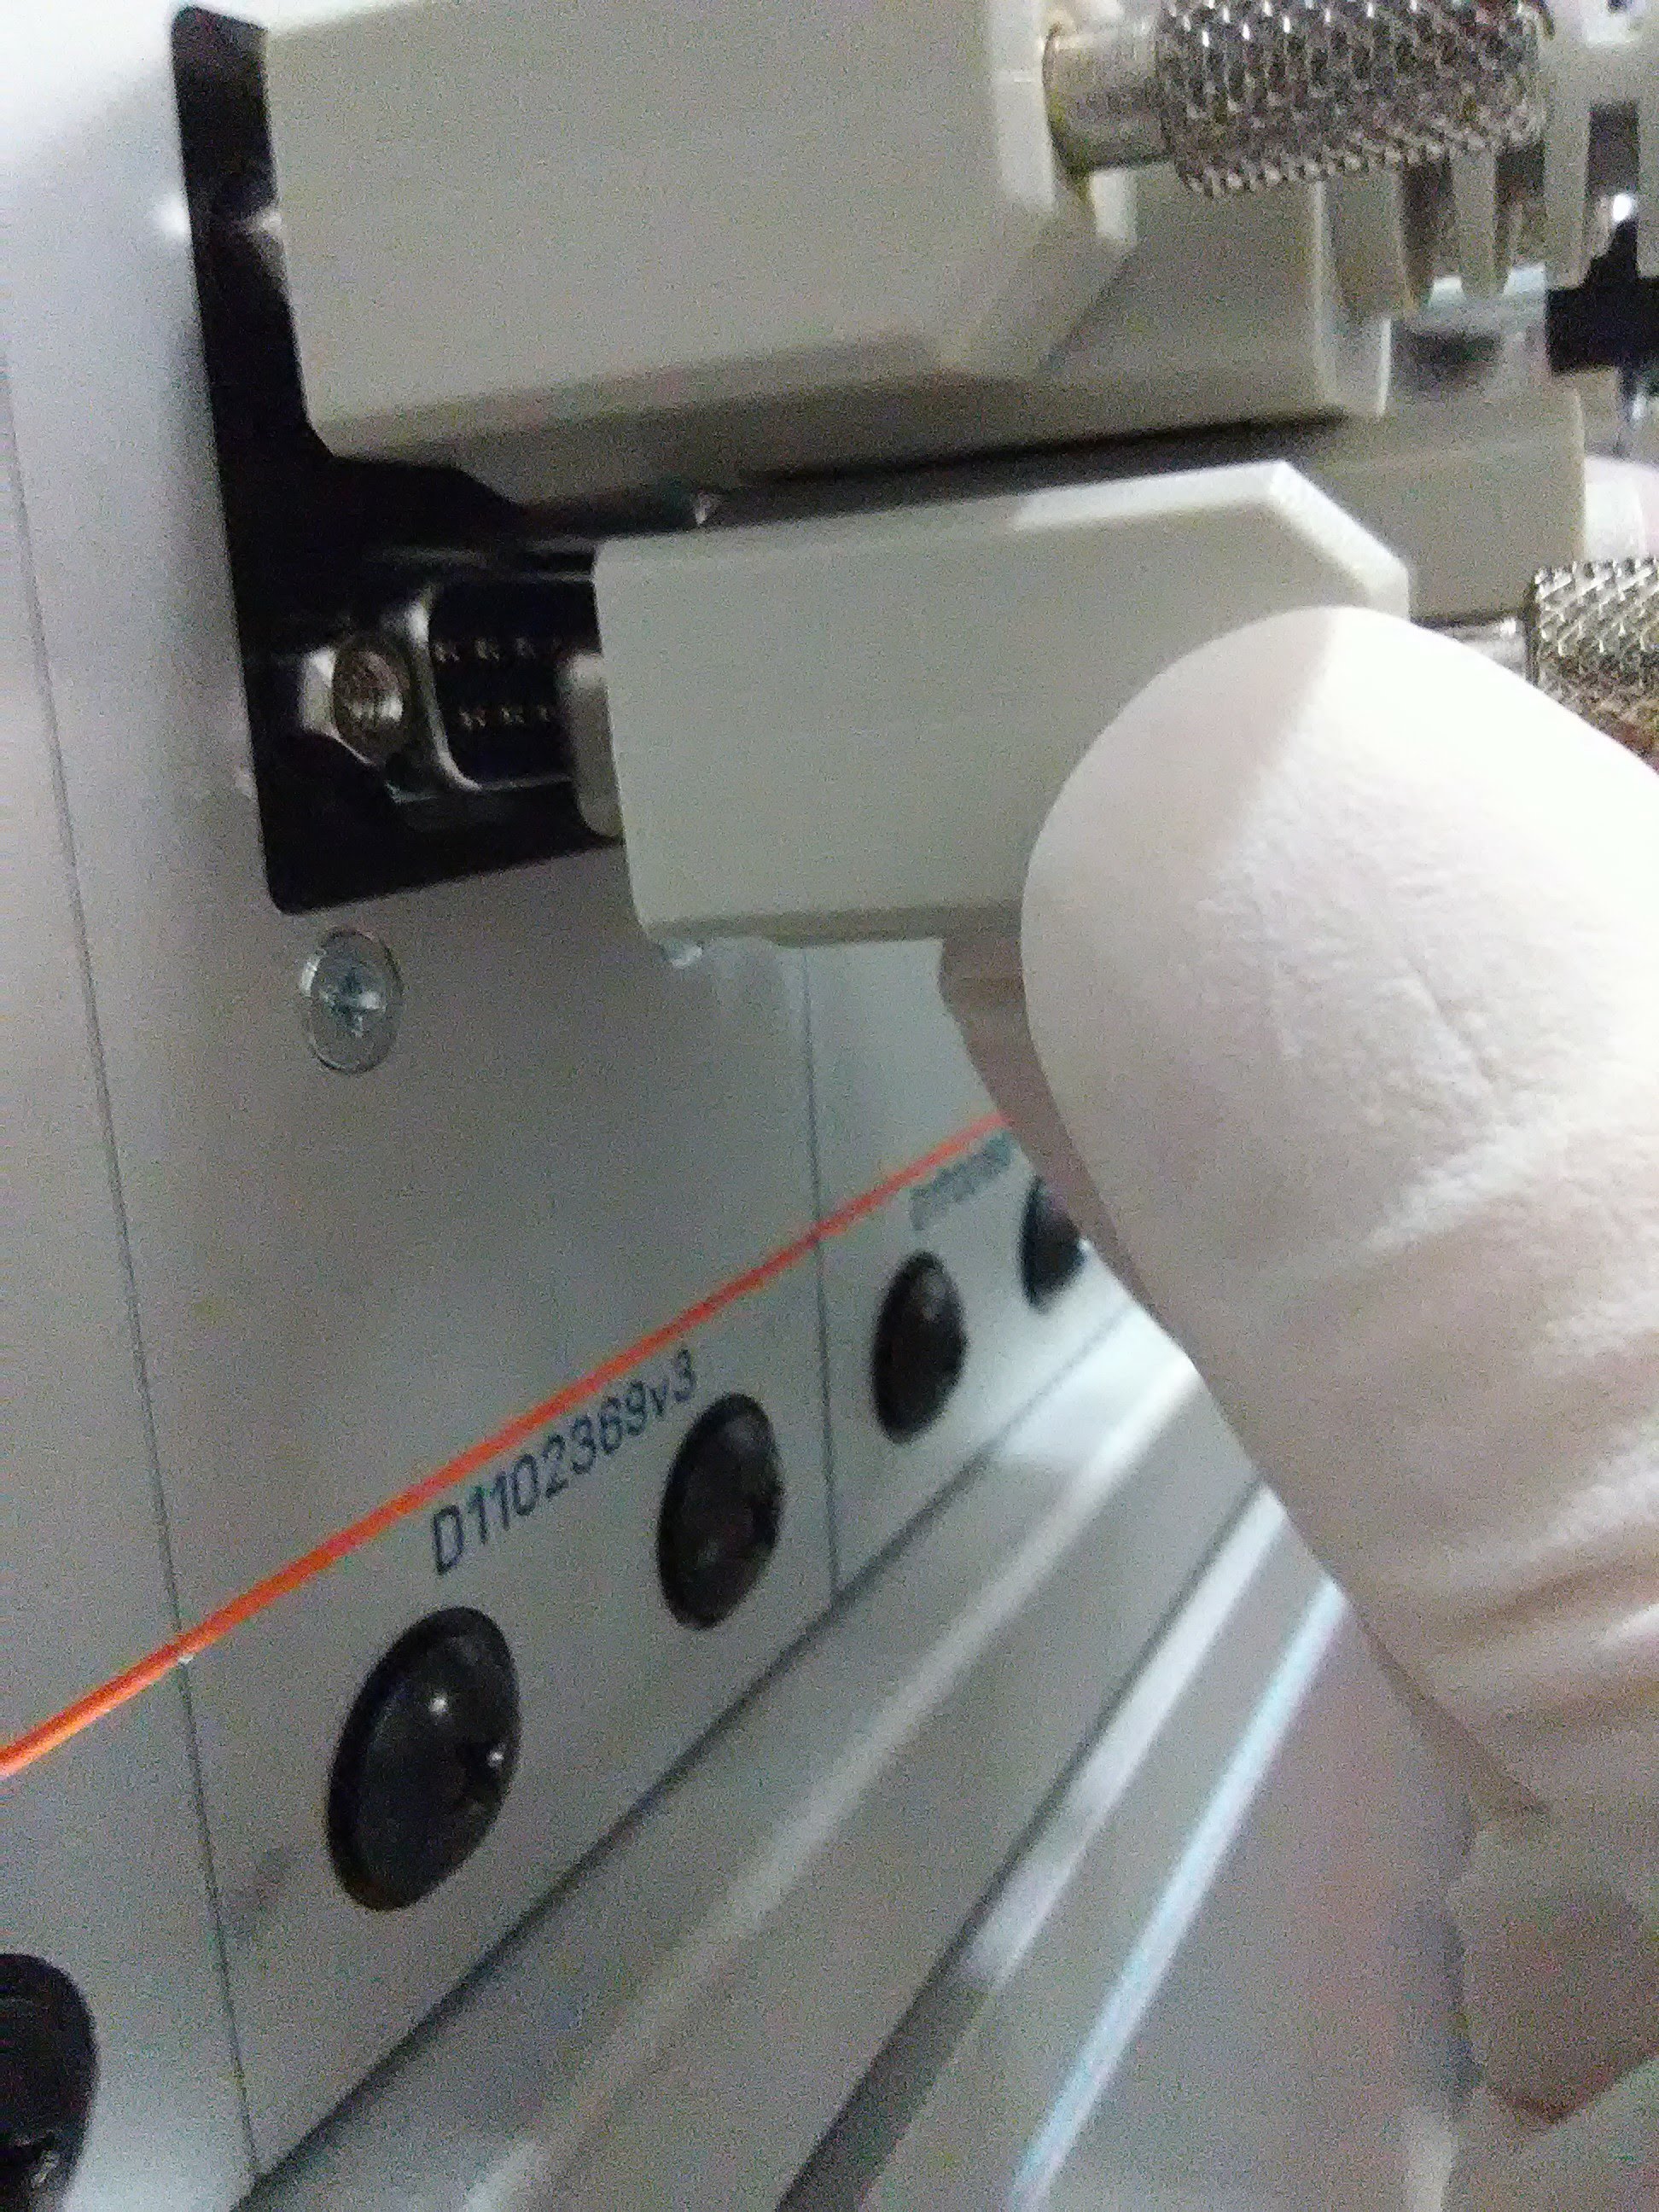
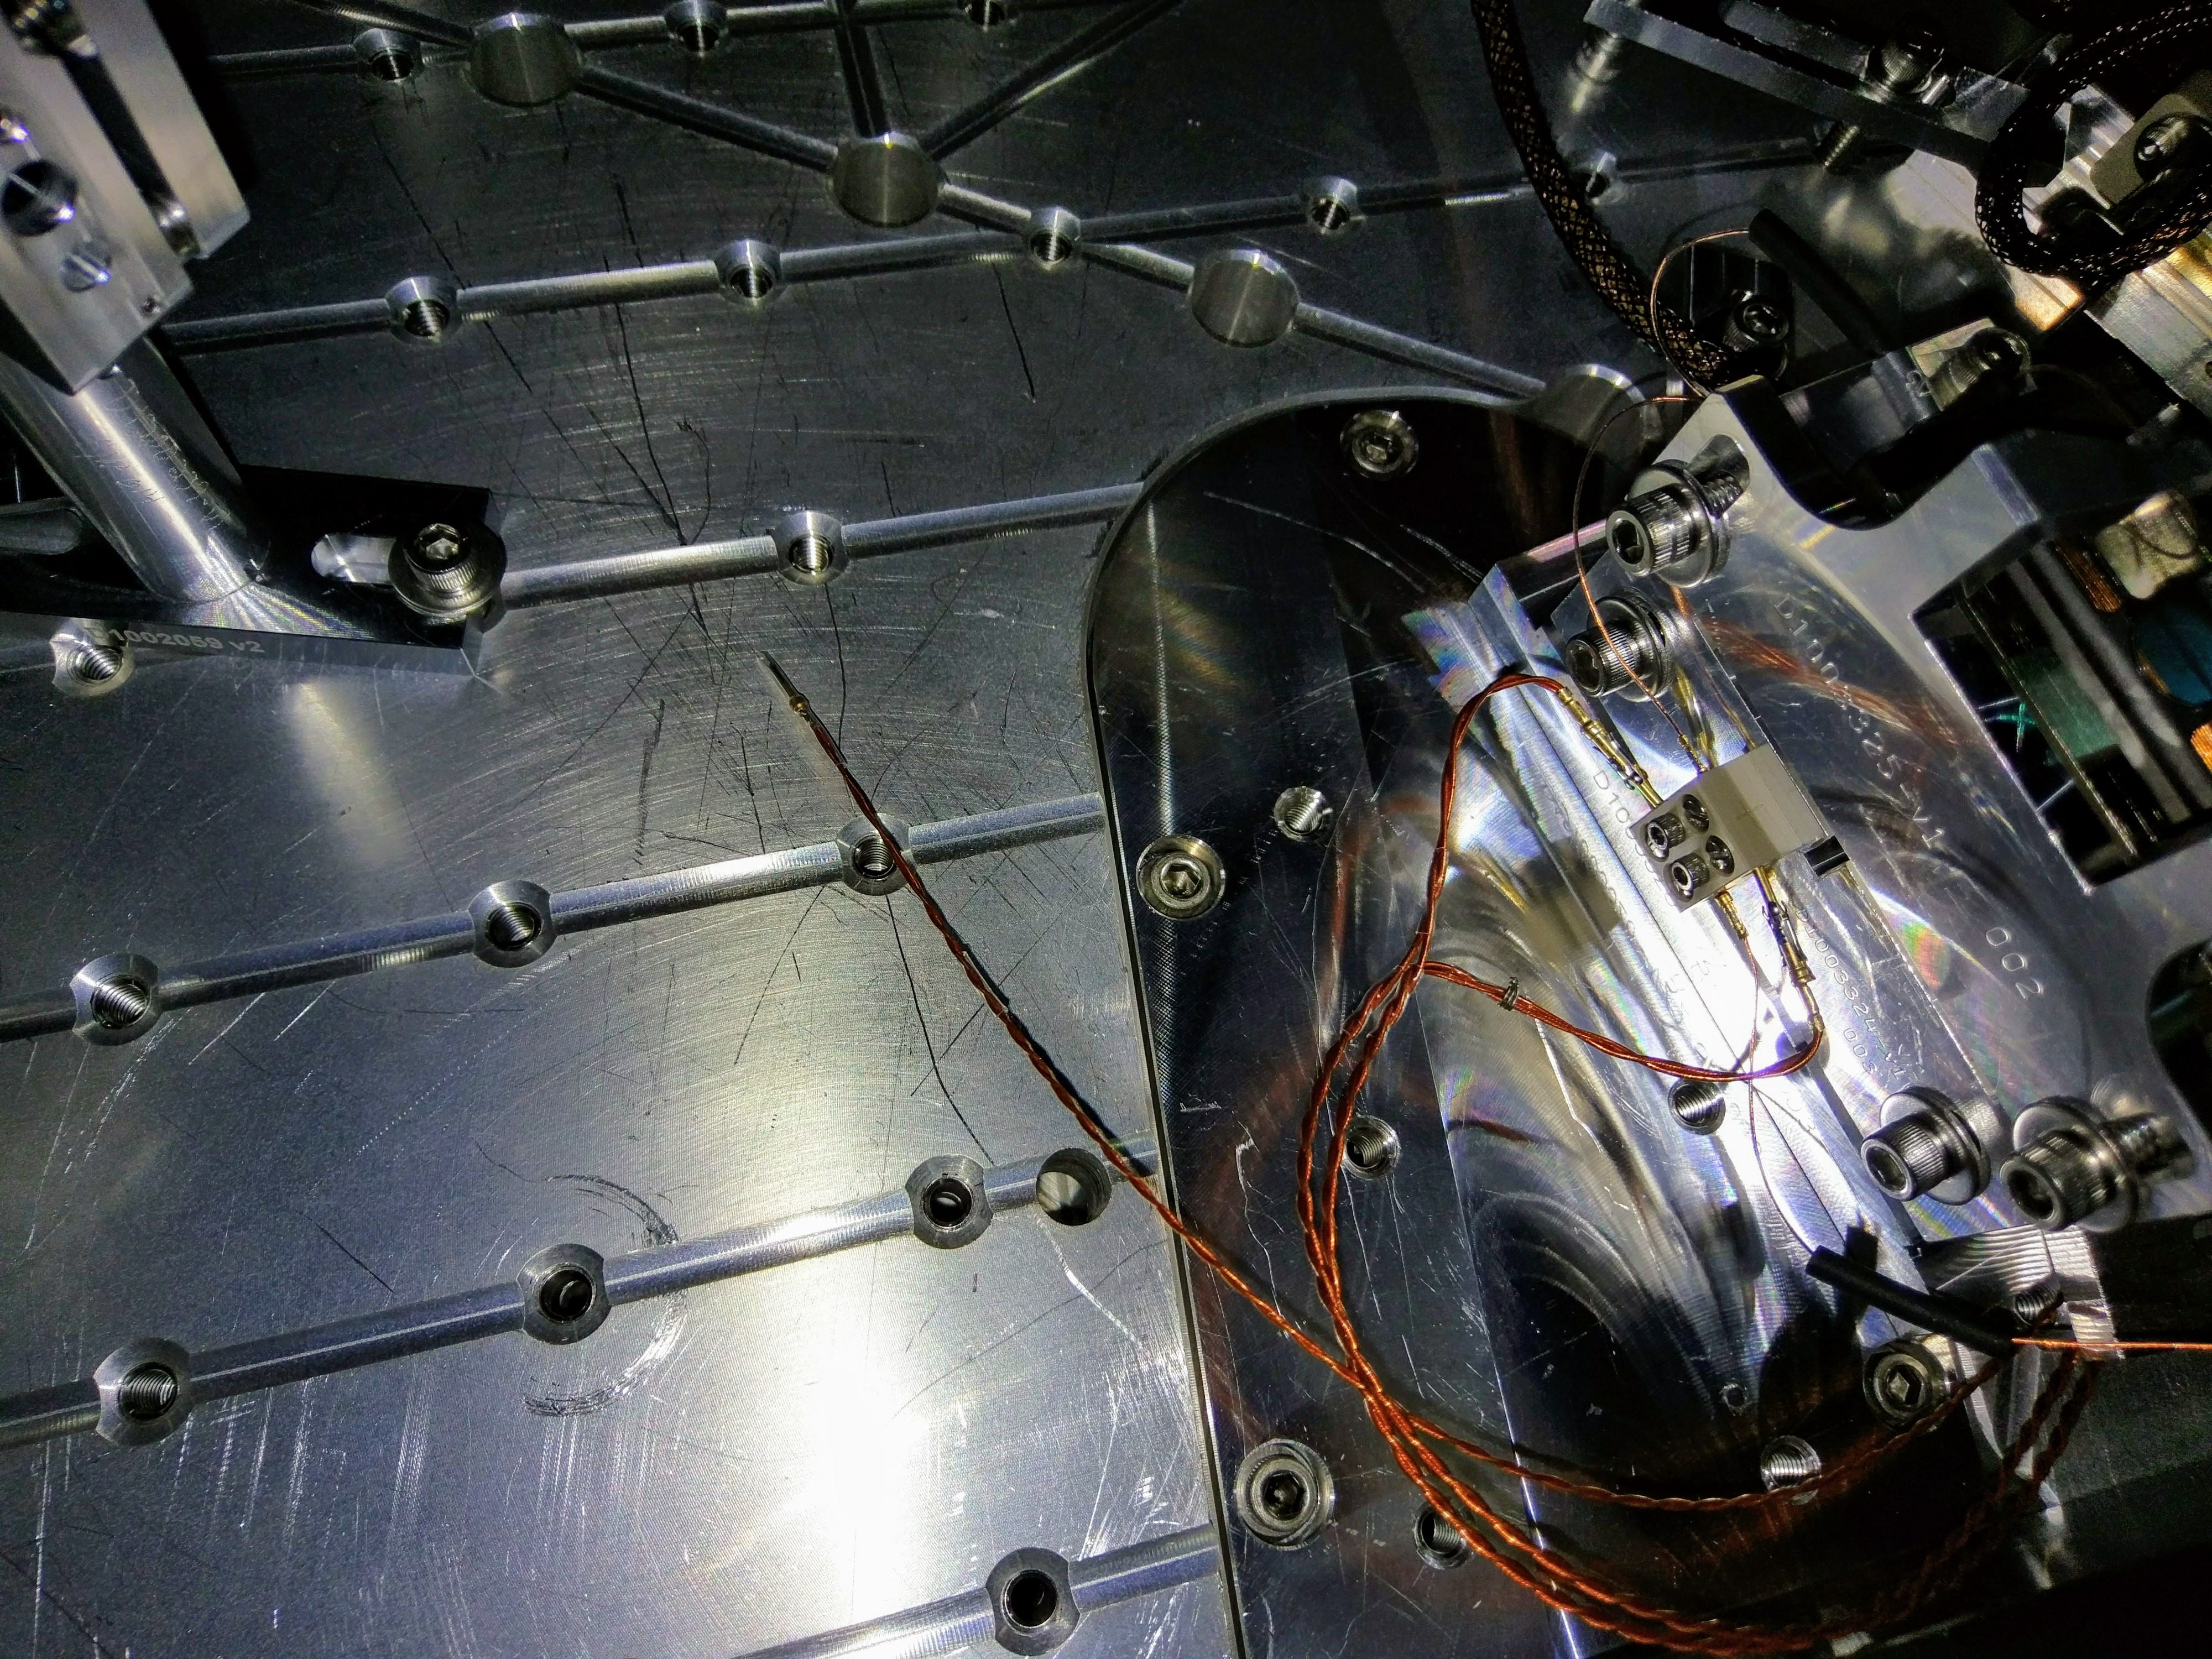
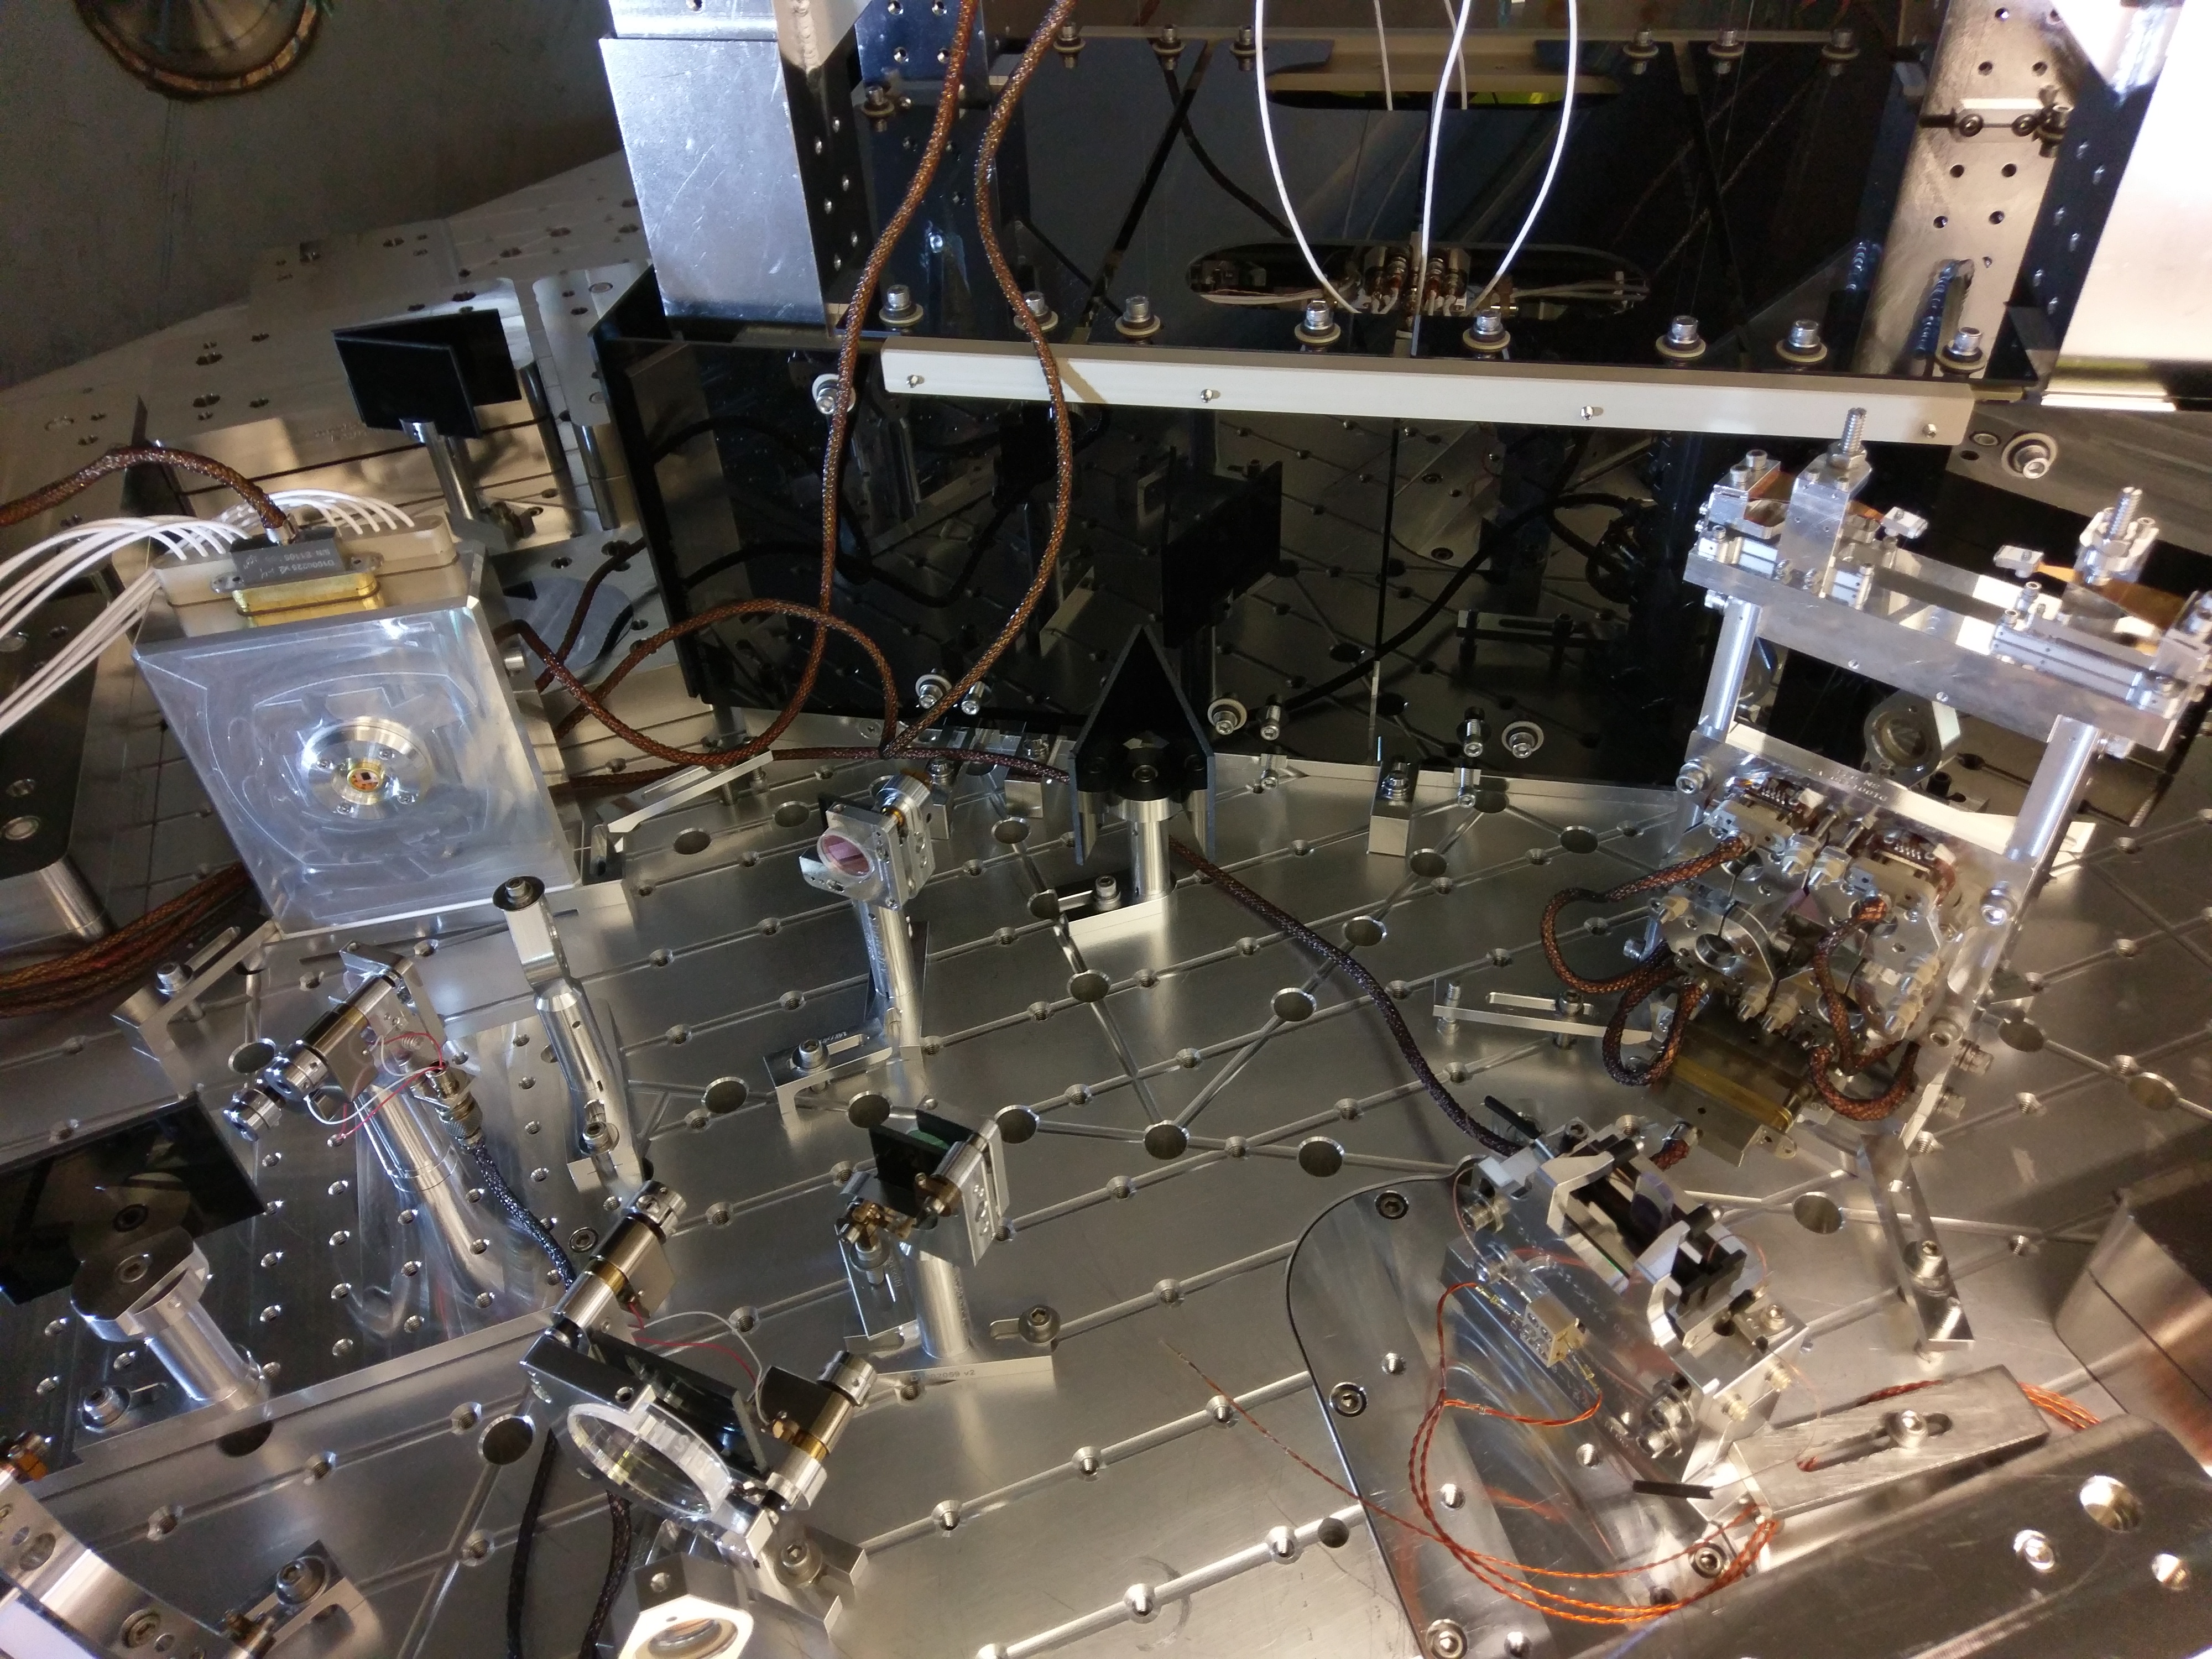
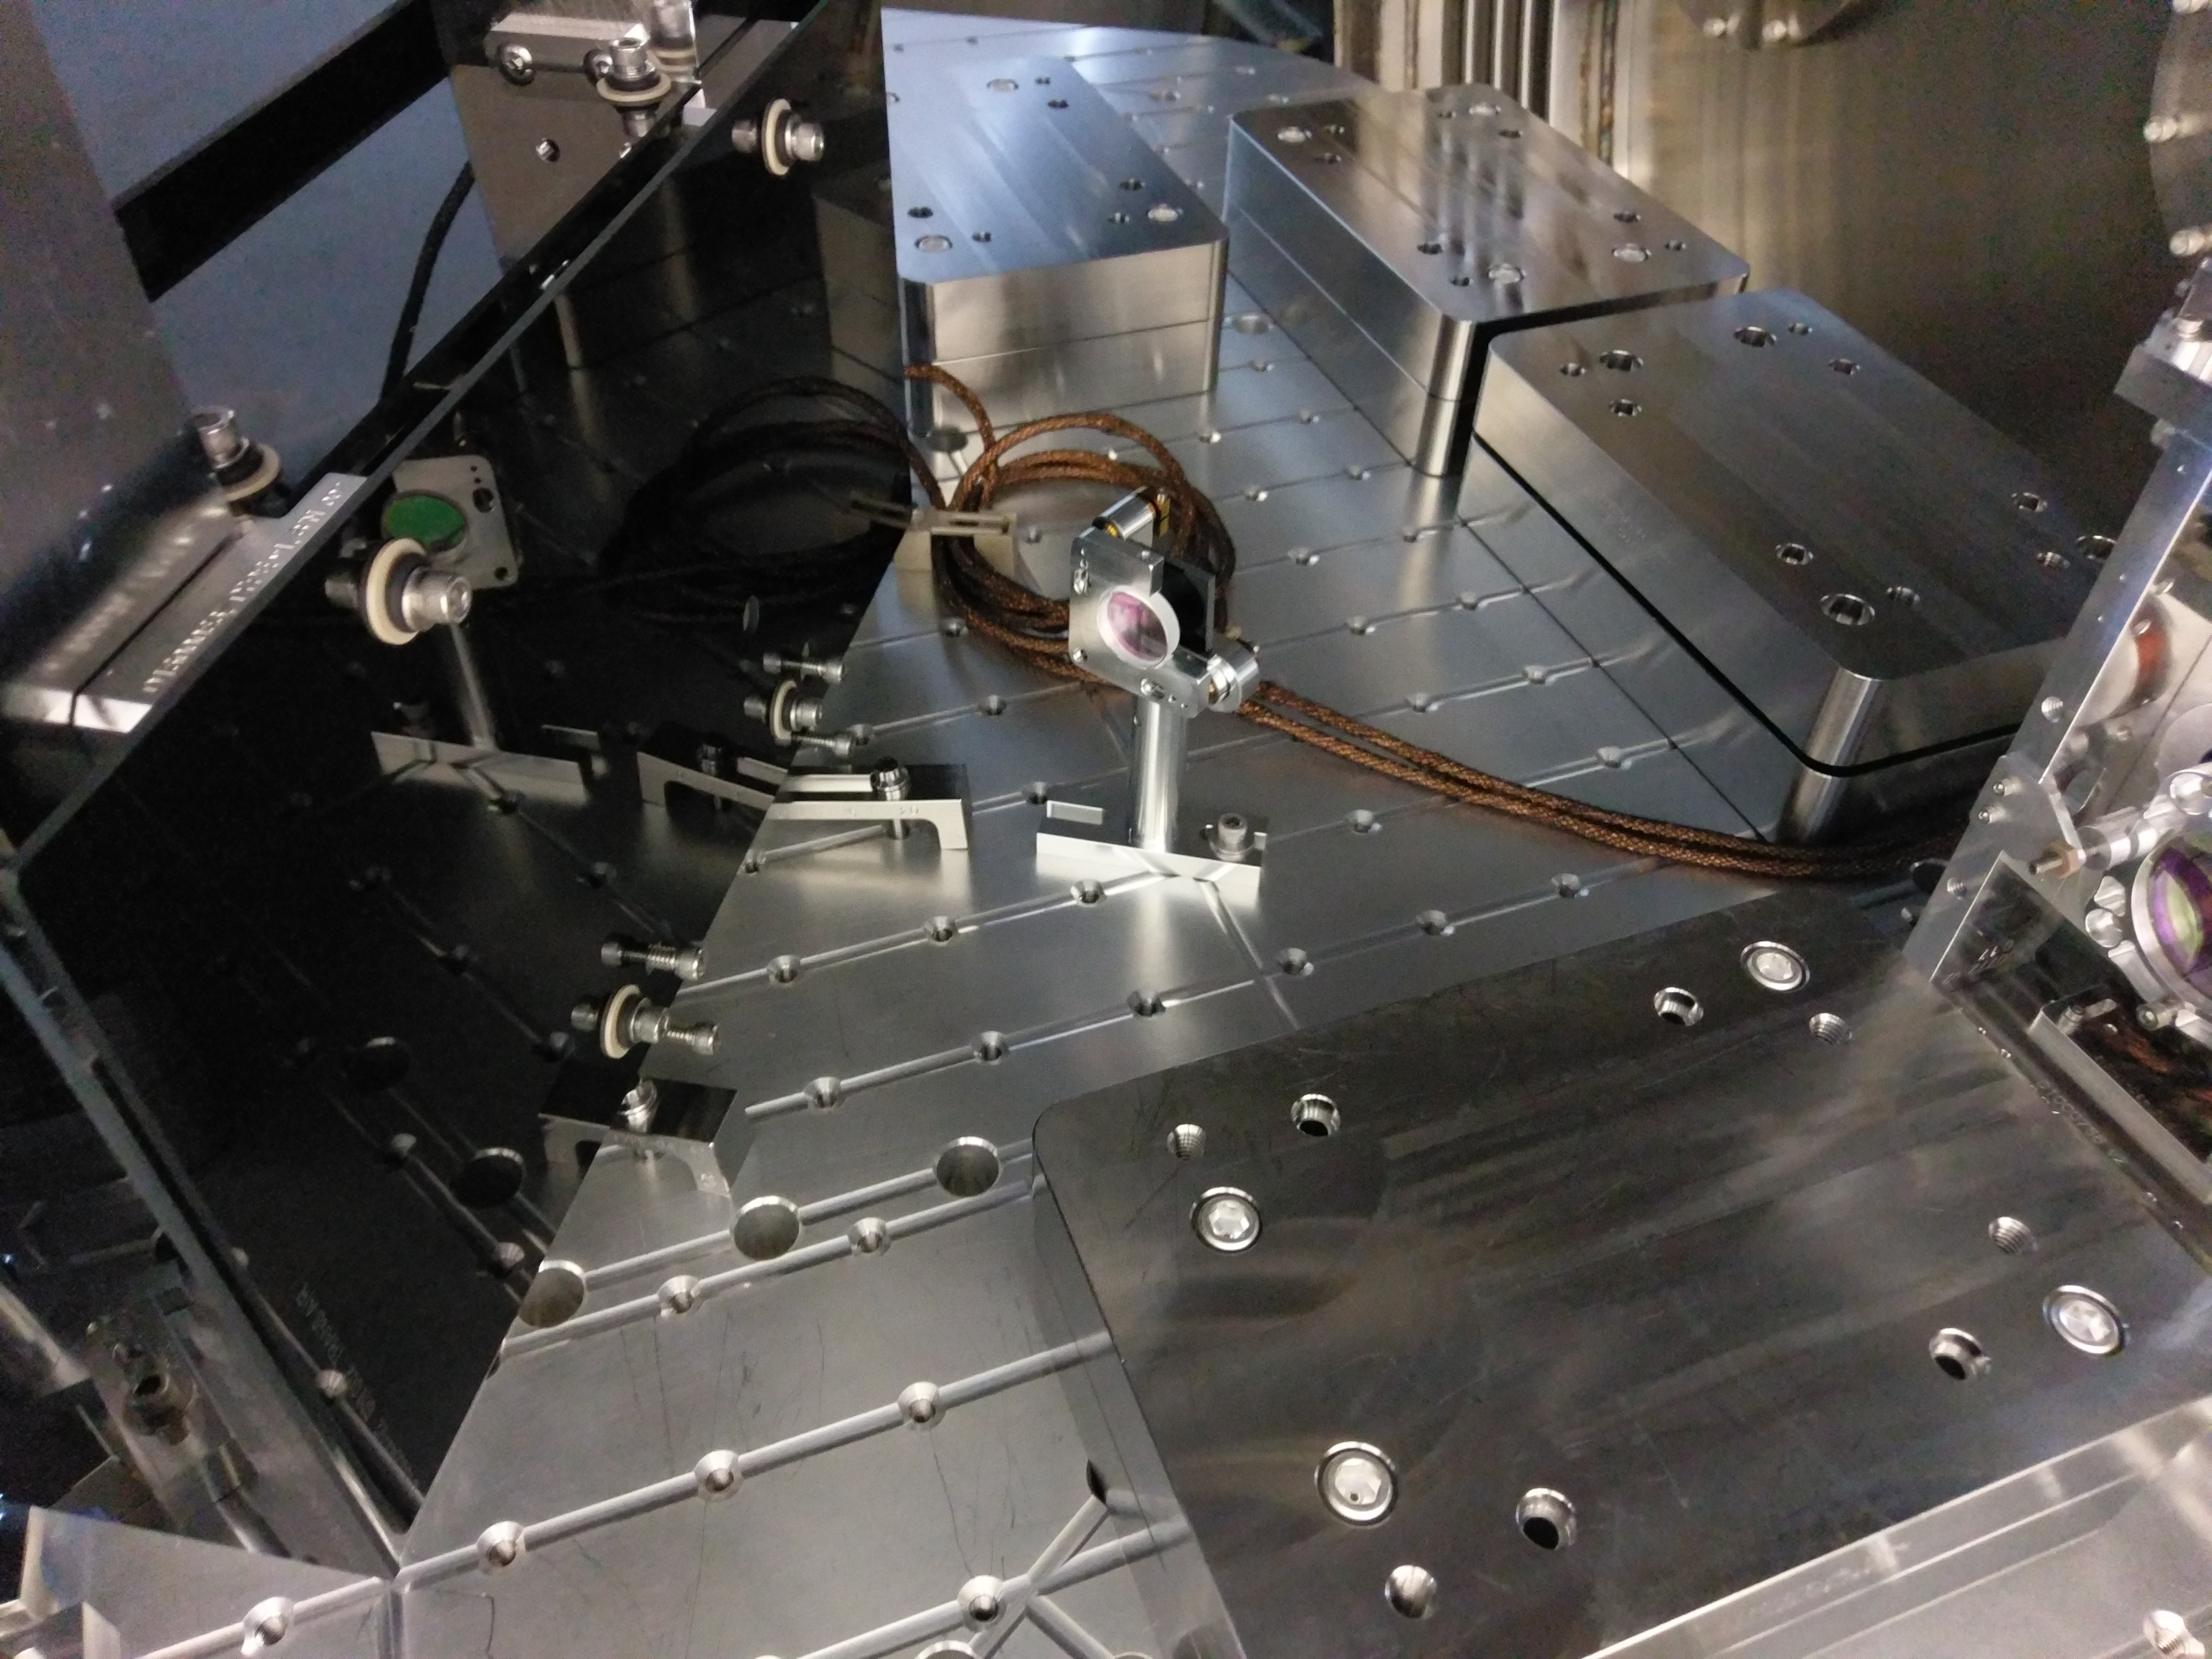
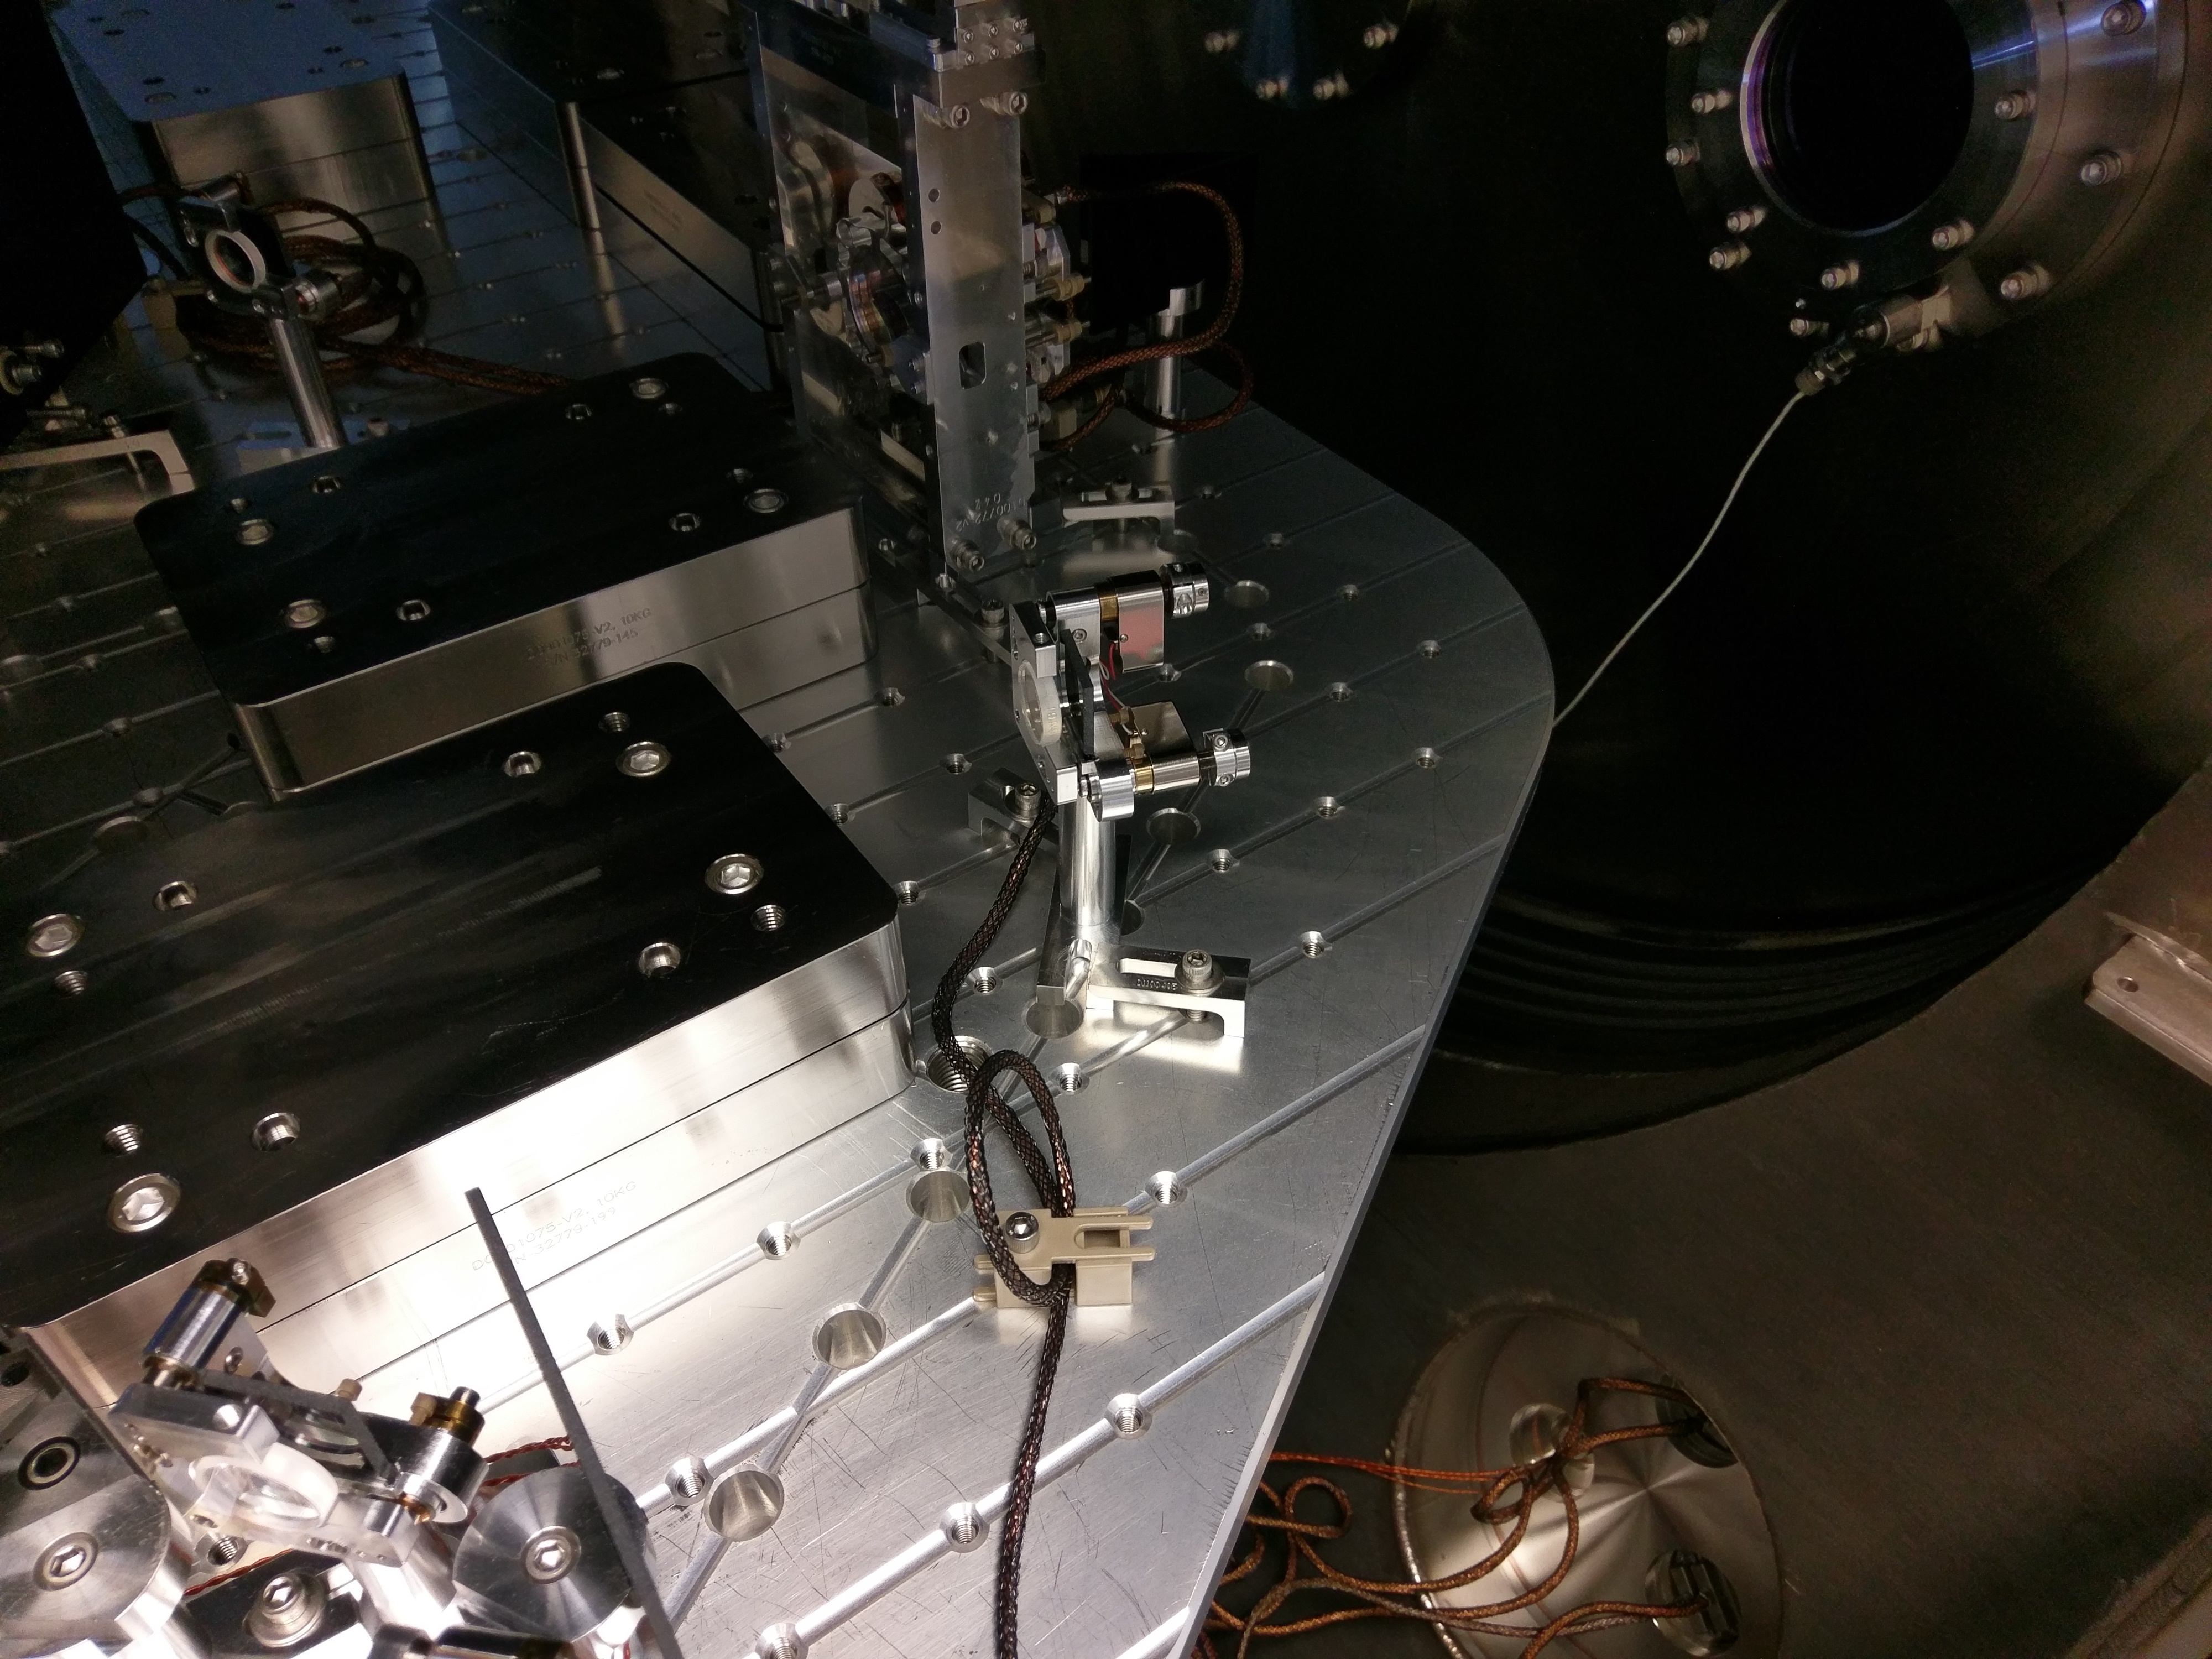
The 4 D9 cables (H1:ISC_SQ_394, H1:ISC_SQ_395, H1:ISC_SQ_396, H1:ISC_SQ_397) from the patch panel to the picomotor four axis breakout boxes had to be replaced for low profile versions as the ends of the custom D9 cables were too fat to fit to the patch panel (see attachment).
Note some of the connections from the breakout boxes to the picomotors are currently inconsistent with with the schematic D1700384. The working arrangement is listed below.
H1:ISC_SQ_394 PSL fibre pol 1/2 1X, PSL fibre pol 1/4 1Y, PSL power 1/2 2X (ok)
H1:ISC_SQ_395 CLF 1/2 2X, CLF 1/4 2Y, Green fibre pol 1/2 1X, Green fibre pol 1/4 1Y (different to schematic)
H1:ISC_SQ_396 CLF power 1Y, Green Power 1/2 1X (different to schematic)
Also the software for the Step rotator on SQZT6 is currently inoperative.
DAQ changes are shown in attached text files.
there was a problem in h1ascimc.mdl with the bus-selector for the ADC inputs to the top-named ASC part. This was fixed and the h1ascimc model was restarted at 13:08PST