IO and TCS/HWS Tables are back in place and being aligned.
VAC
CS pump down is around 10-6Torr. ITM TMDS is waiting till we are confident that we will not have to vent again. Vac crew wants to pop off the HAM6 S door to place a stopper so the HAM5 doors can be tested. Monday morning hard closing MY gate valves. Hoping to vent EY early next week. North door will be coming off and the clean room is set up. Will need to isolate Y-beam manifold to leak check, perhaps a few weeks out. Short one ion pump in the CS until it is repaired. Kyle will want to commissioning the neg pumps this month, which will be climbing on chambers and running pumps.
SQZ
Cabling is continuing, what is here is installed but more to come. VIP is still waiting for the OPO and a few other parts before further progress can continue. The slow controls testing in the SQZr Bay for the table can start. Siskyou mounts being built in the Opt Lab.
COMM
IMC locking this week. OM alignment, DRMI, and peak down the arm coming up in the next week or two.
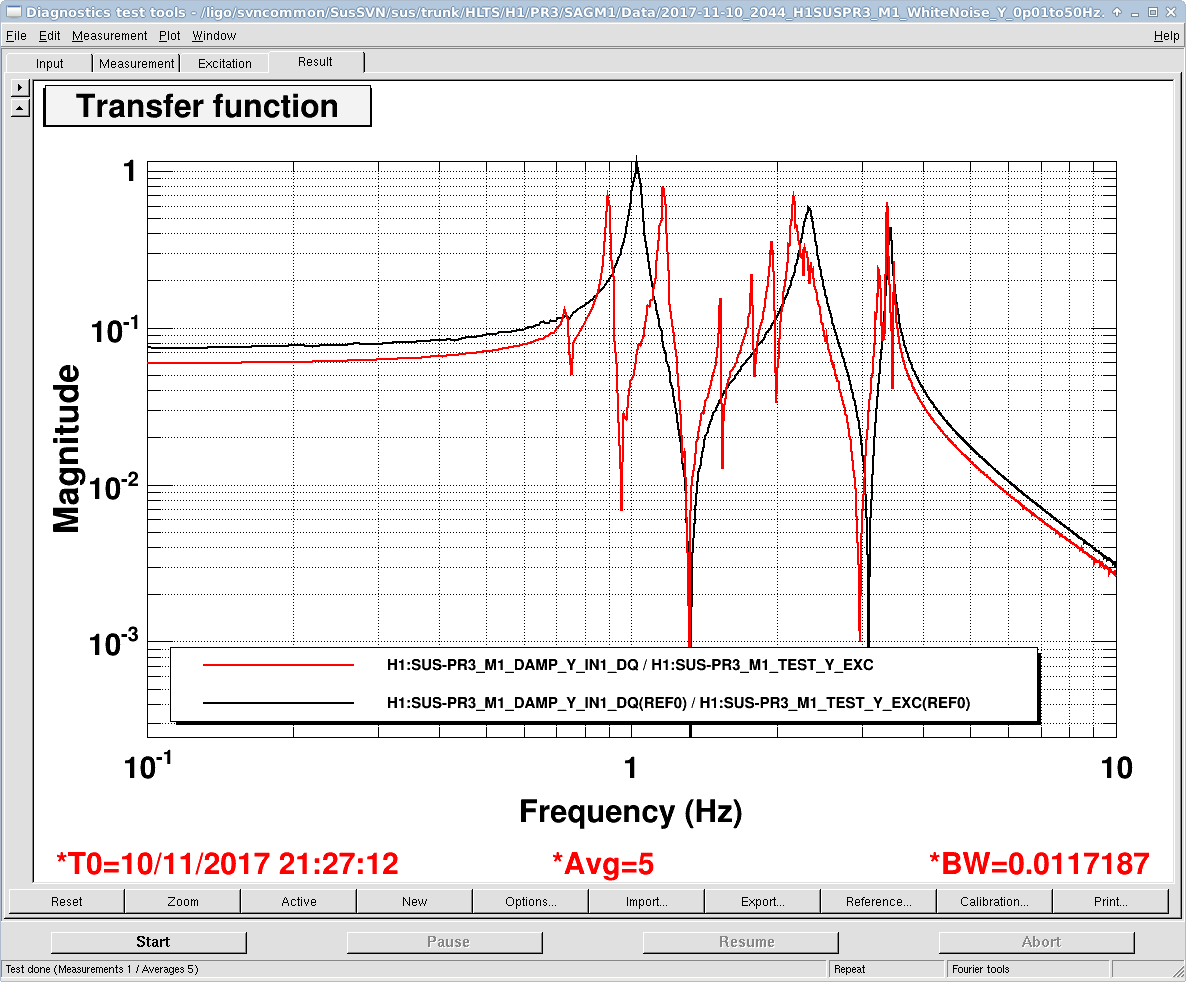
SUS
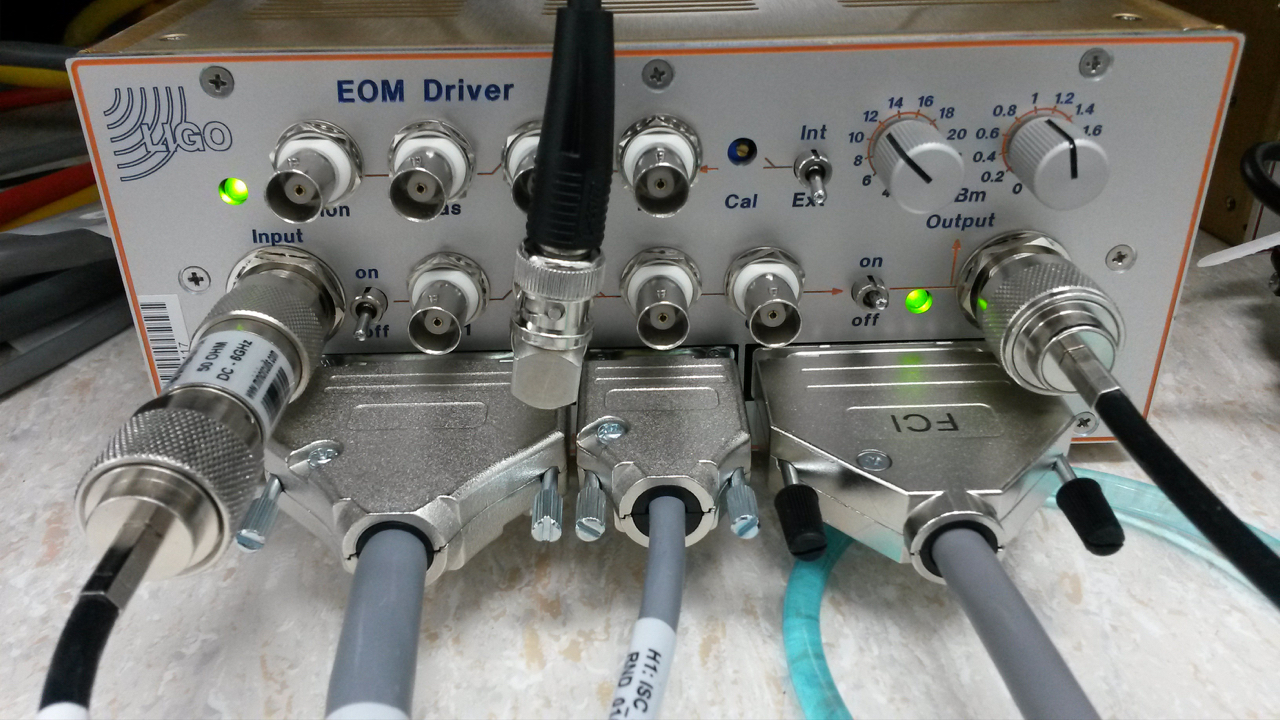
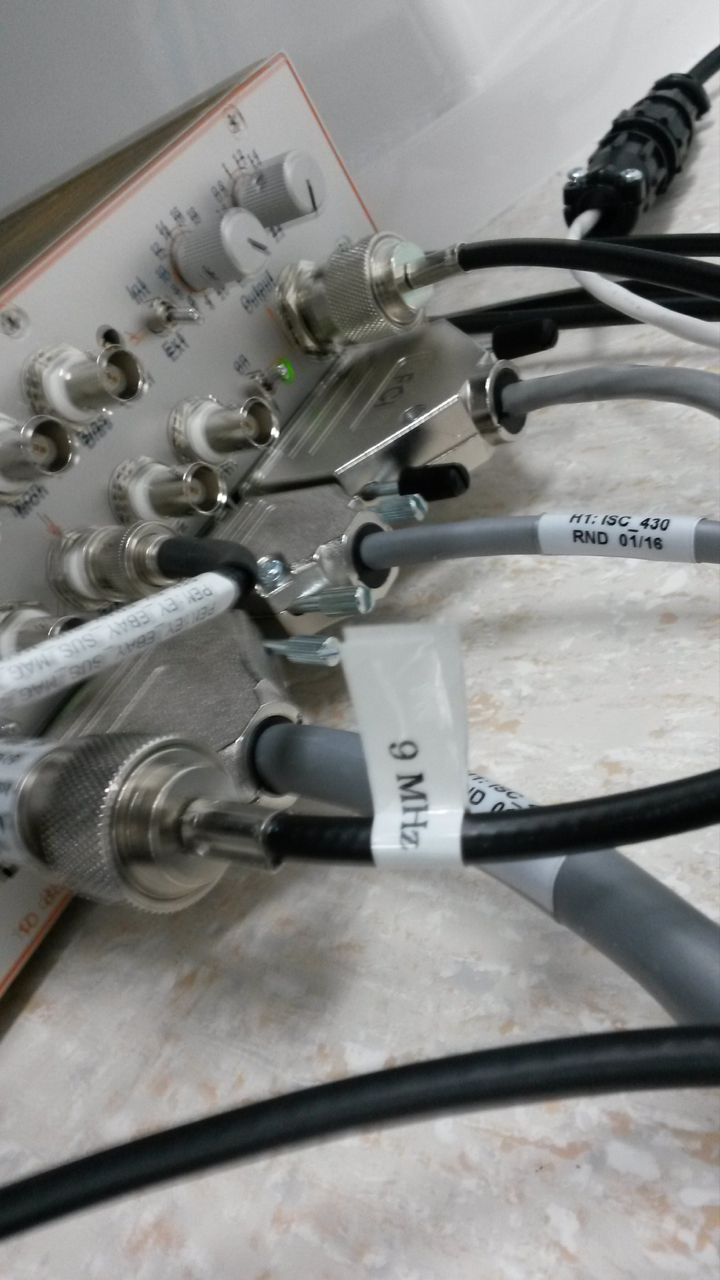
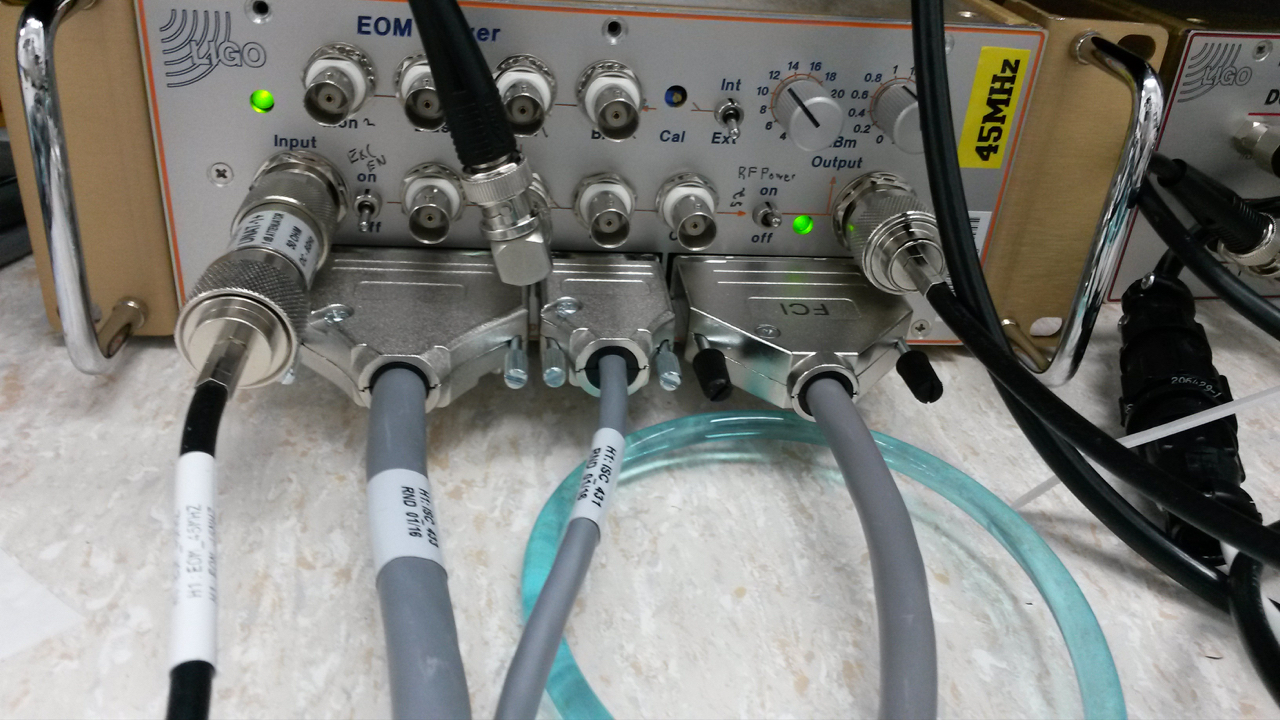
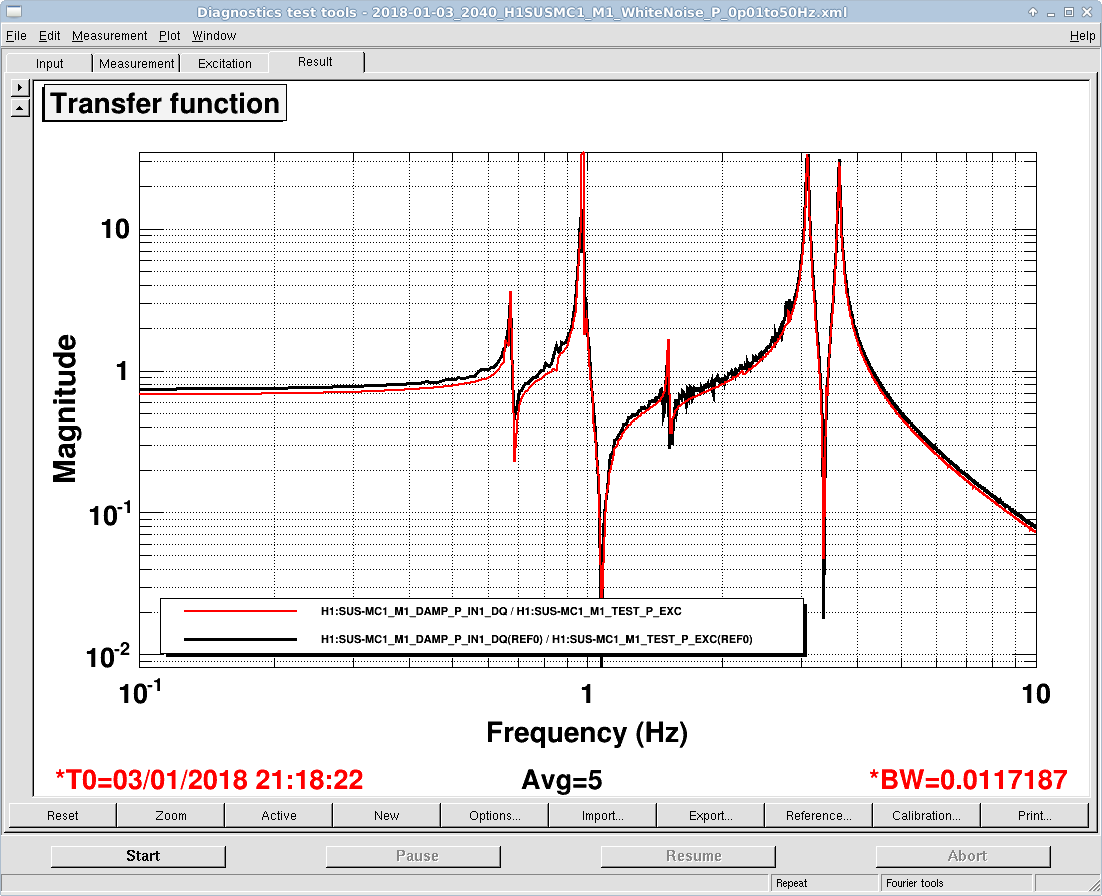
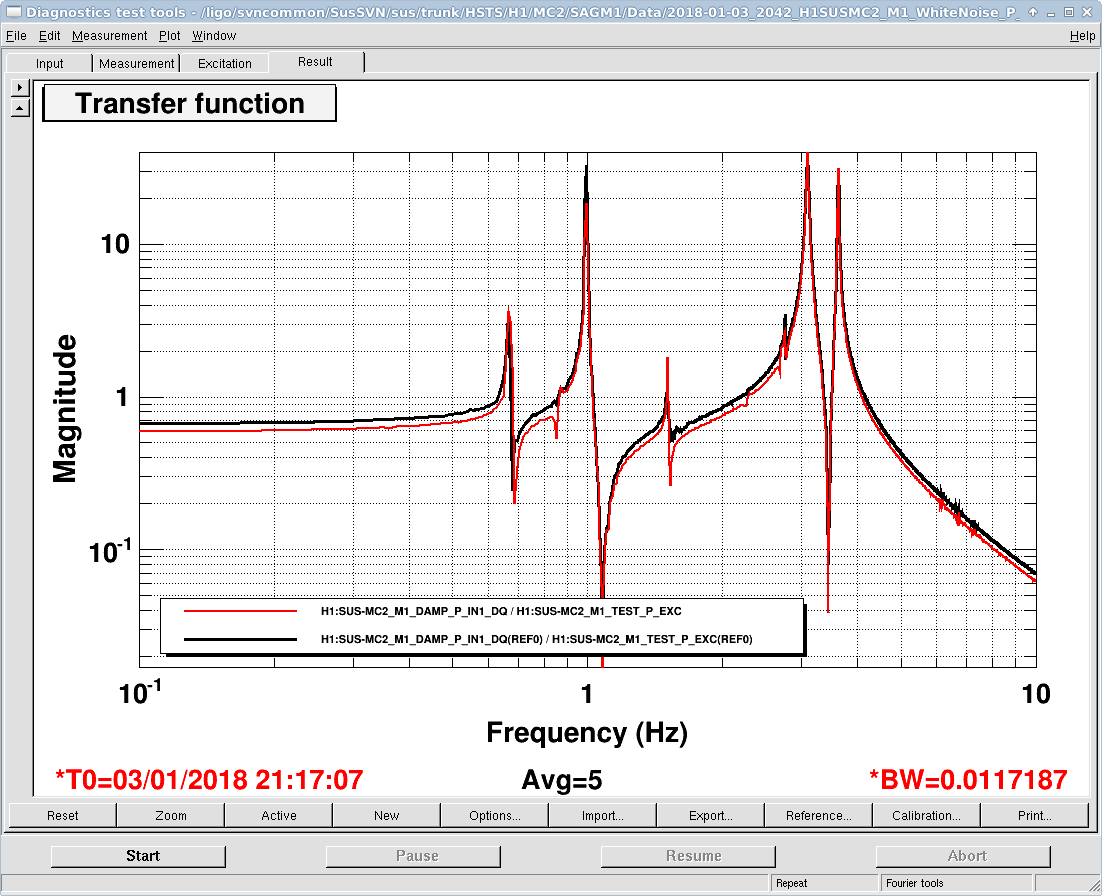
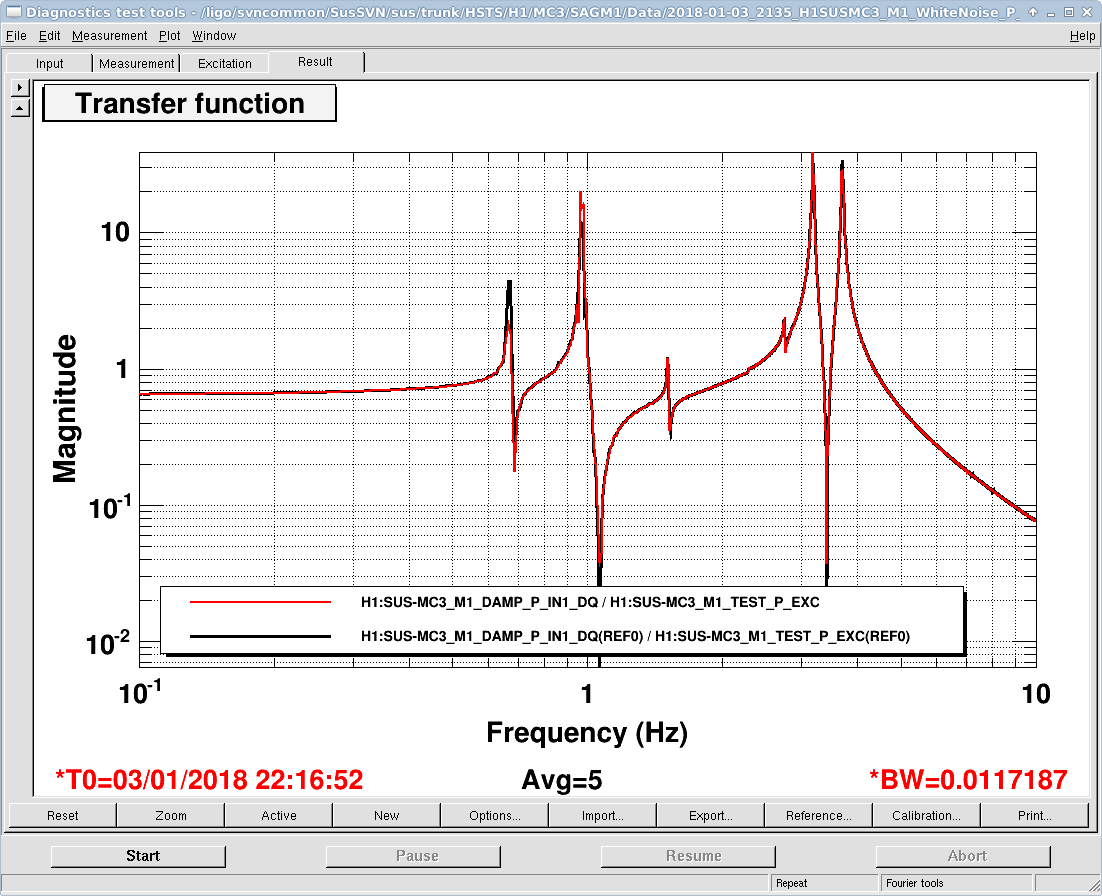
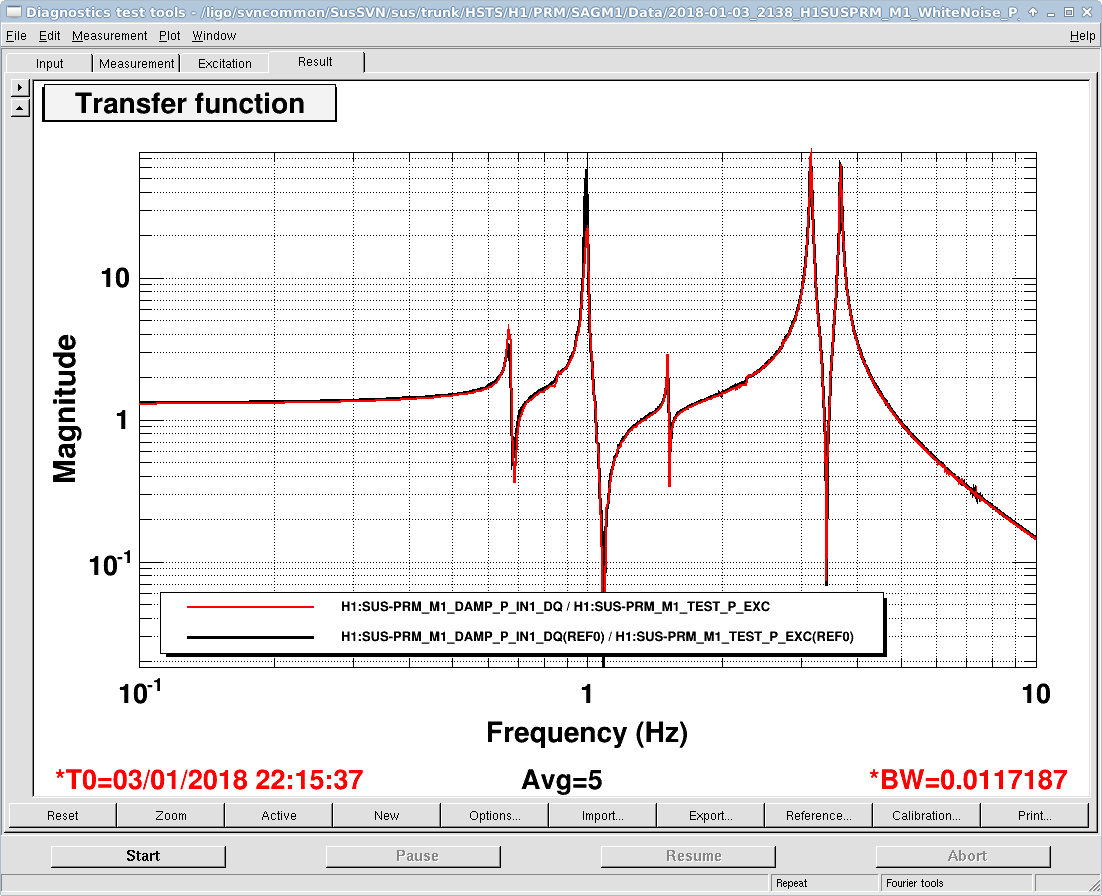
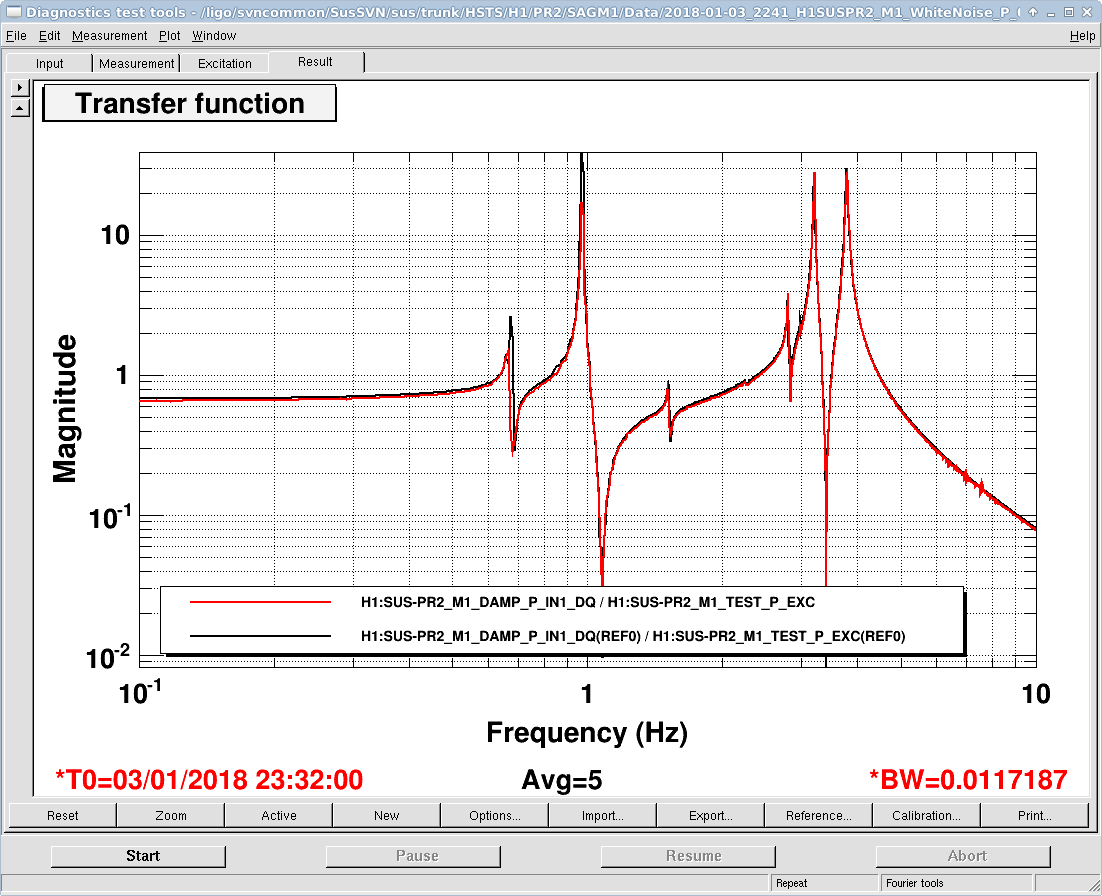
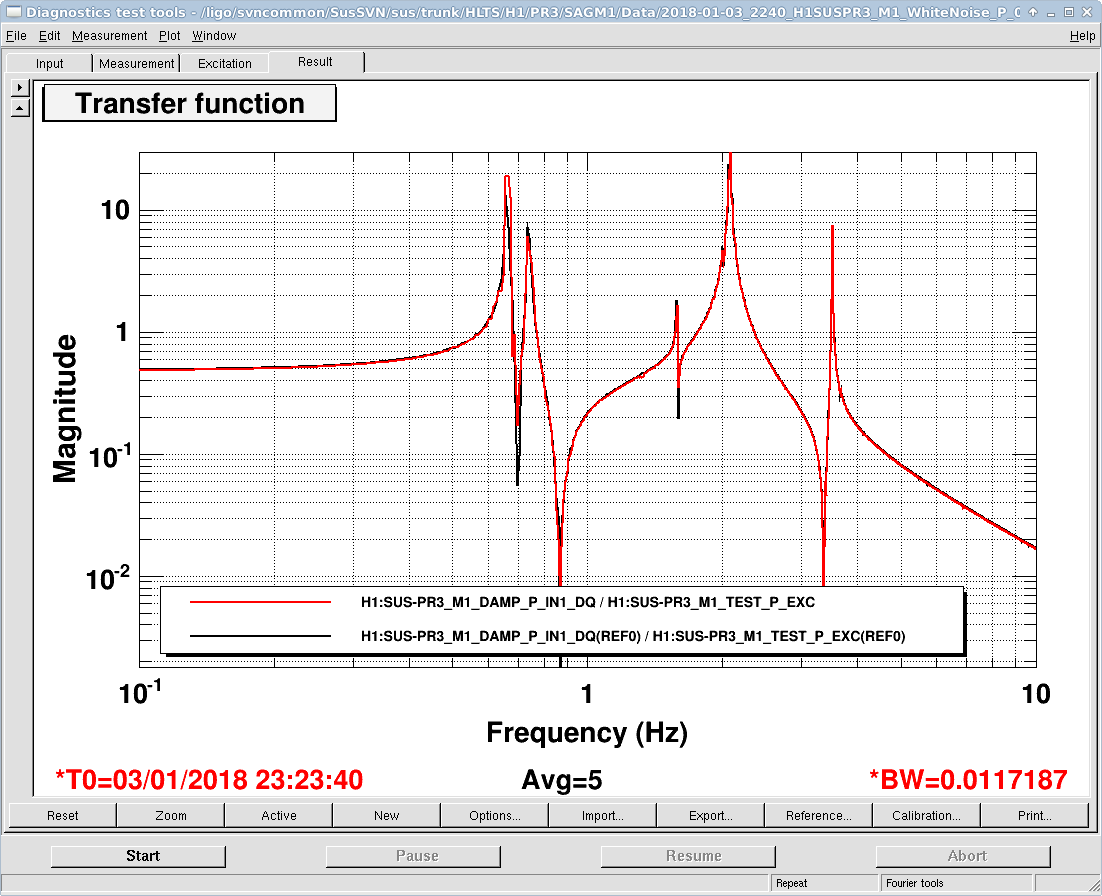
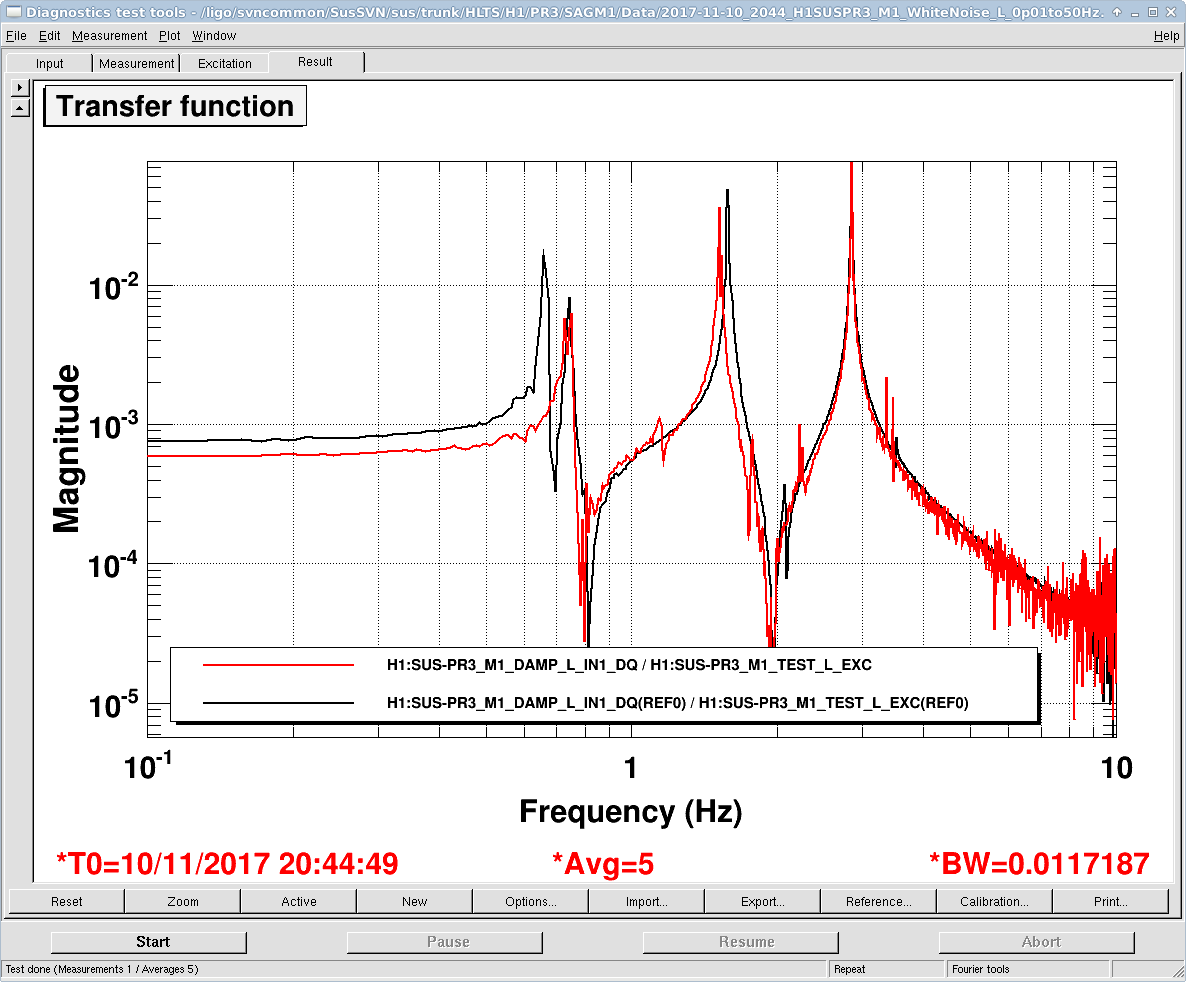
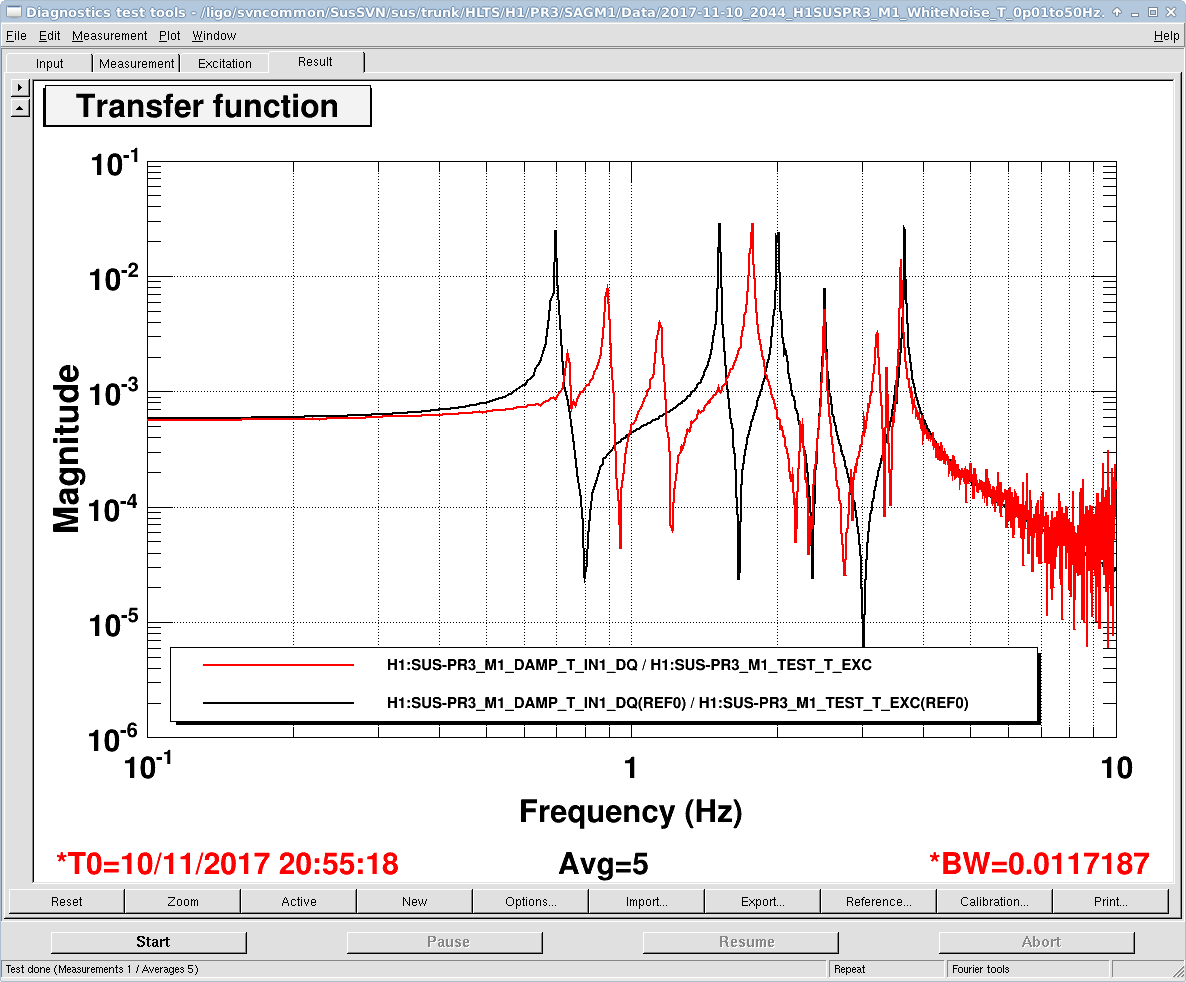
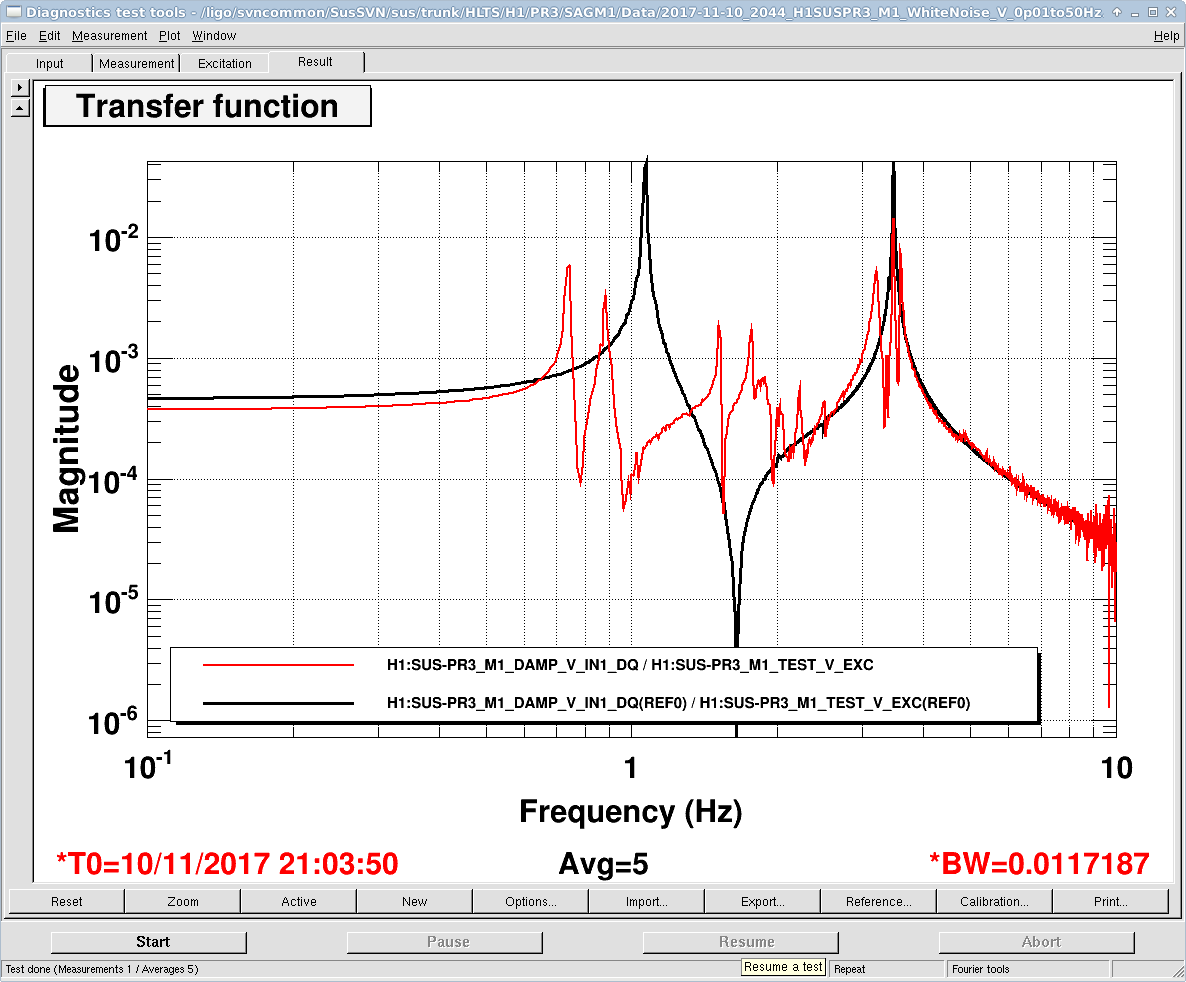
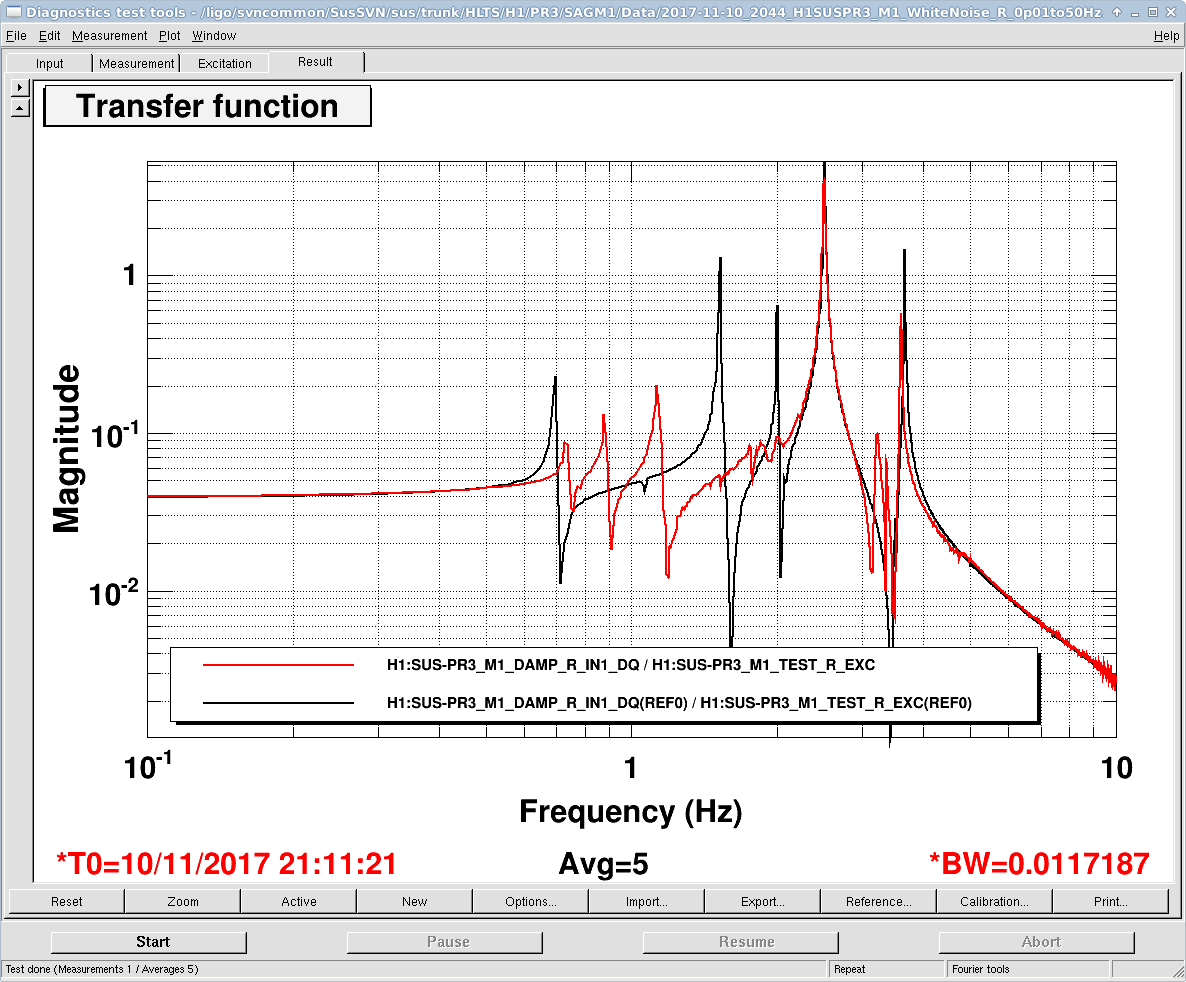
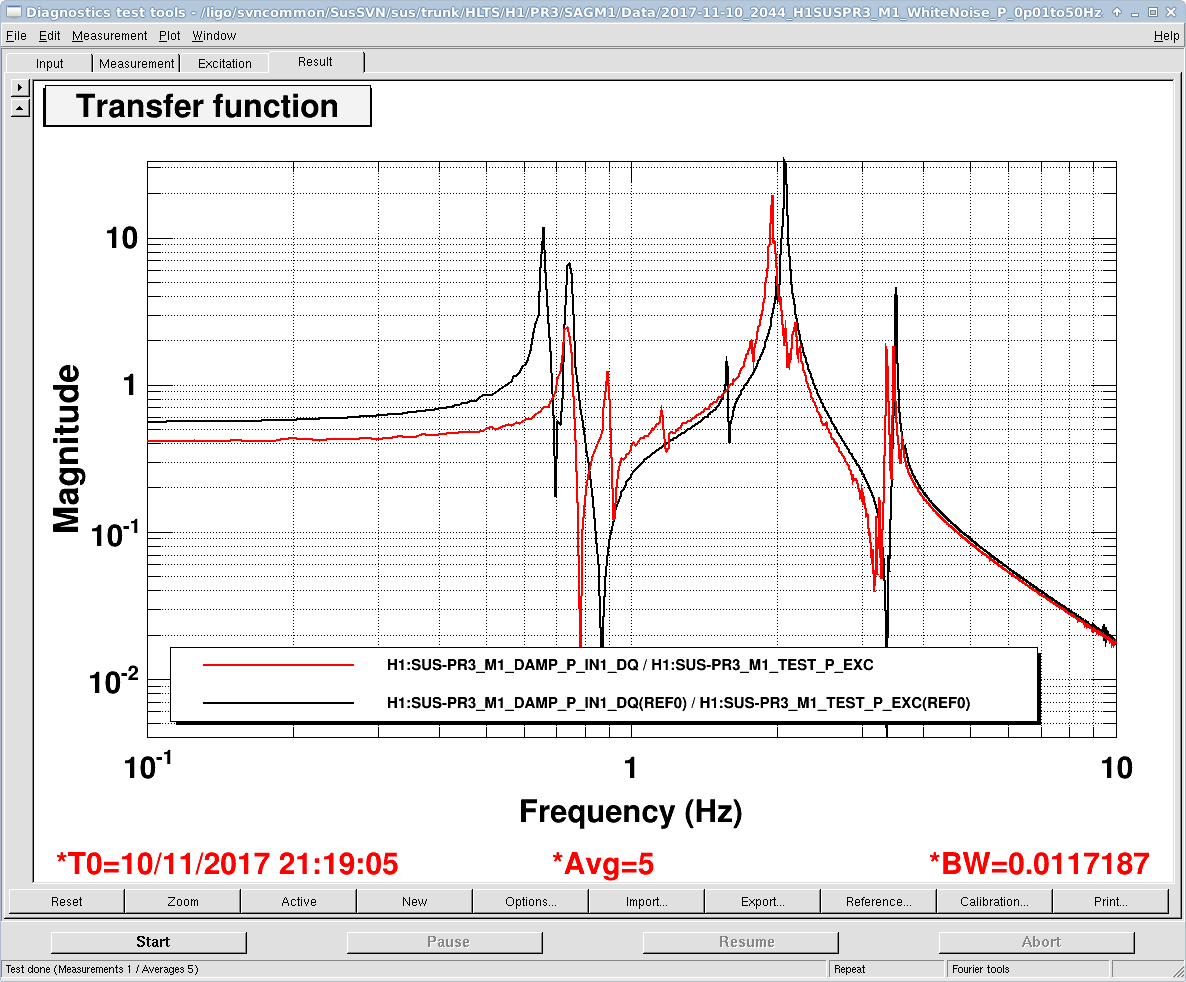
Jeff K has been running transfer functions on the vented sus and checking for rubbing and other issues.
CDS
Security patch needed, this will mean that all control room work stations and many of the CDS machines will need reboots. Tuesday all of the "big" machines will be rebooted, this will take some time, expect much of the day. H1IOPLSC has been glitching lately, could be caused by work around the machine but CDS will be looking into it. Restarting the models has solved the issue in the past, but still under investigation.
SEI
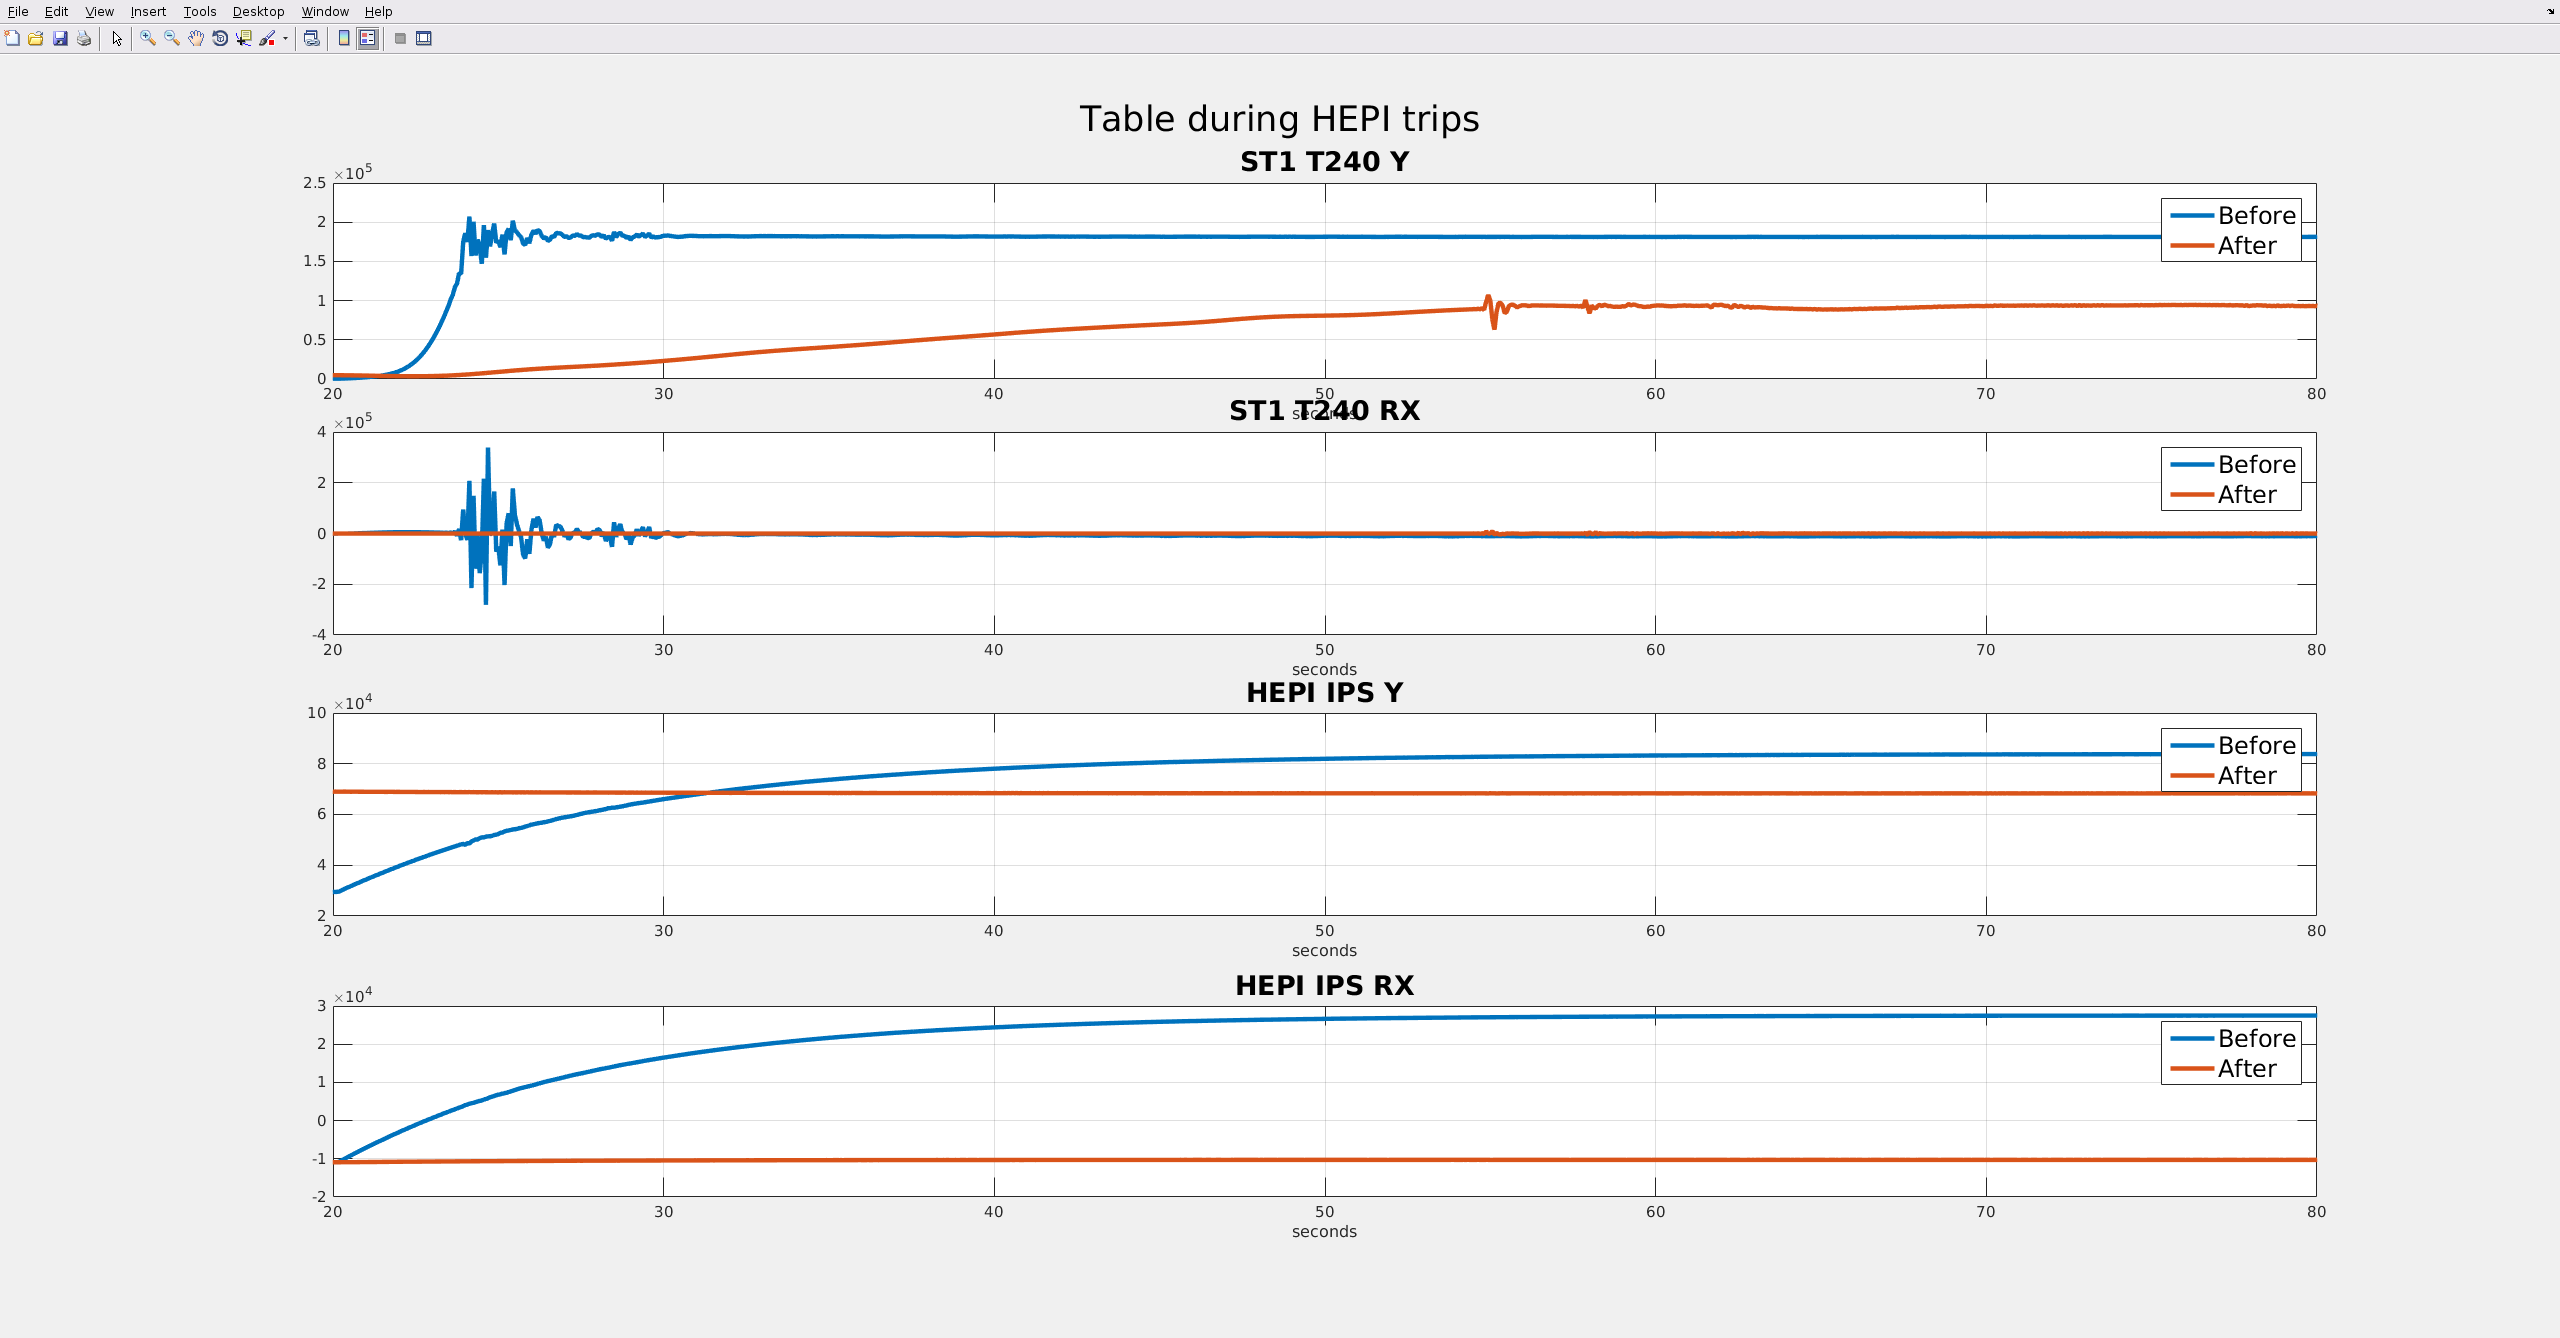
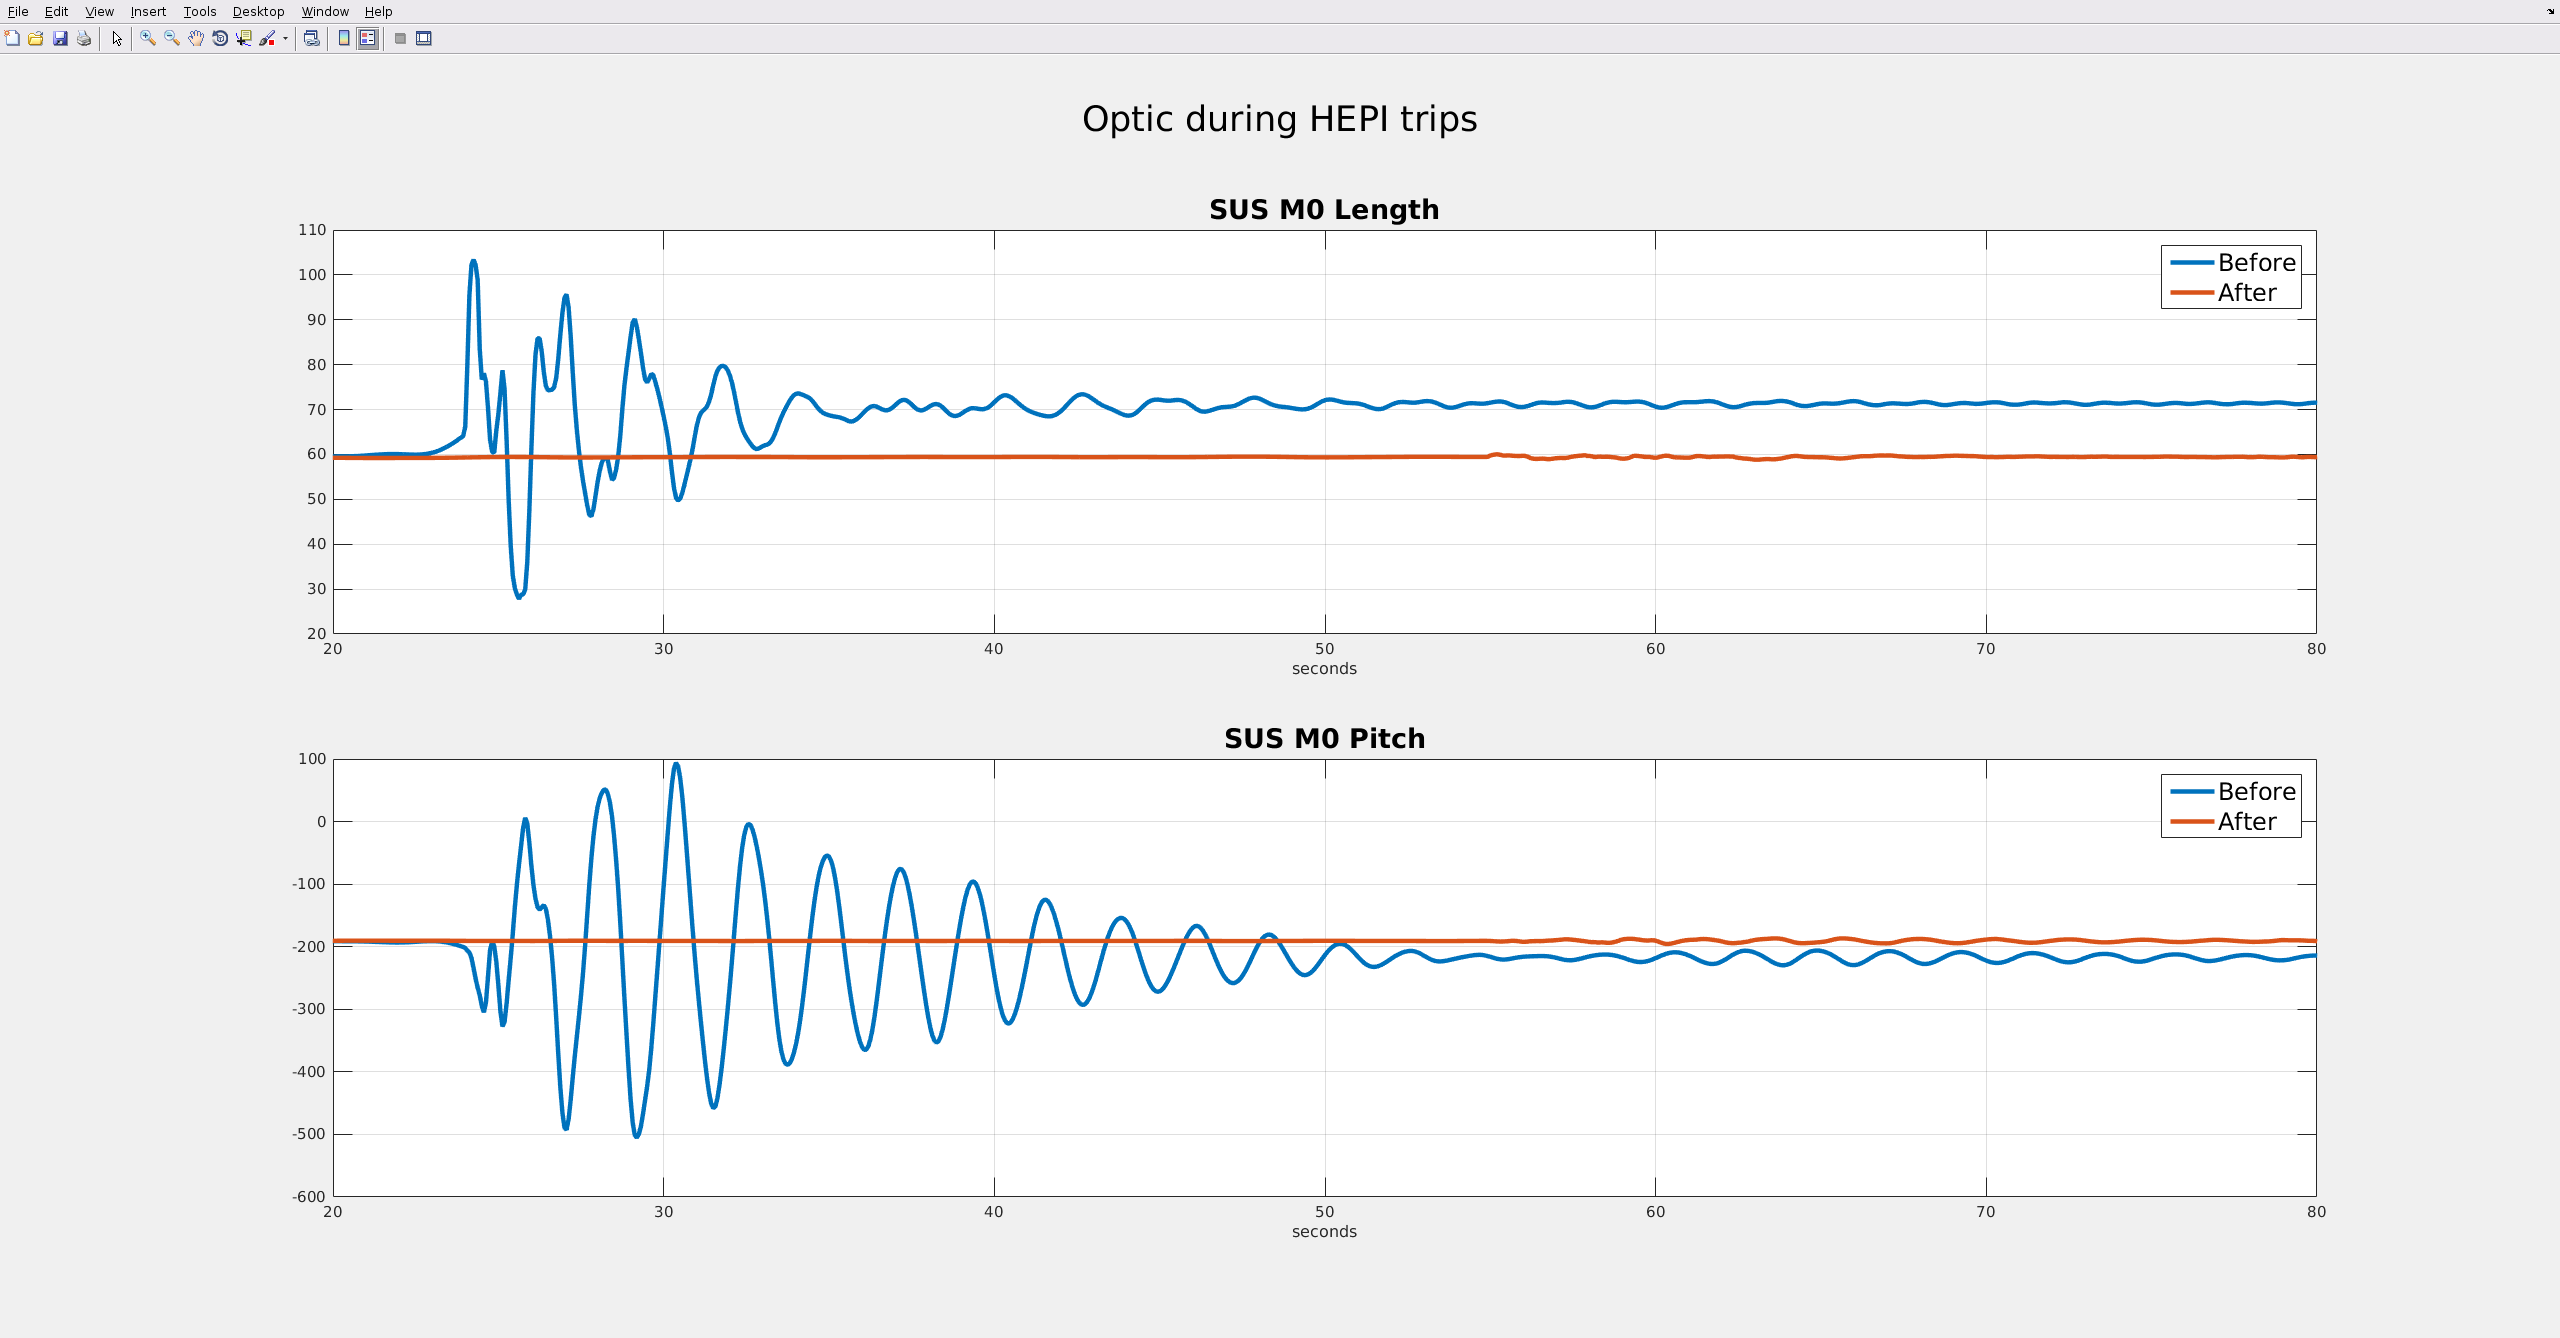
EY HEPI locked up. EX HEPI is still operational and there will be some testing and filter maintenance. Been relieving HEPI biases, this will relieve harsh trips and hopefully have fewer trips.
TCS
Seal on one of the TCS Y chiller pumps failed, spare is being hooked up. This was the same one that we have been having leaking issues with previously, could have been the issue (or part of). More TCS maintenance will happen during PSL upgrade.
Please take some time to go through the LVEA and put stuff away. It's nobody's stuff, which means it's everybody's stuff


BTW: the network filter connection tracking problem seen on h1lsc0 today was also seen on h1oaf0 in November 2016.
alog: Link
The EDCU is configured to read two EPICS channels from the h1ioplsc0 model via channel access (H1:FEC-7_STATE_WORD and H1:IOP-LSC0_ADC_DT_OUTMON). Of the two, the latter should be constantly changing and would show if it froze to a single value. Trending this channel shows that the EDCU did not lose its connection to h1ioplsc0 this morning, but the hourly autoburt could not connect at 10:10 PST. The autoburt could however connect to the user models on h1lsc0 at this time (only the IOP model was disconnected).