peter.king@LIGO.ORG - posted 10:23, Monday 18 December 2017 (39792)
LVEA transitioned to LASER HAZARD
The LVEA has transitioned to LASER HAZARD.
The LVEA has transitioned to LASER HAZARD.
Closing out the CS chambers this week.
Modified IO team will work out the bypass and a stable beam for the ISS alignment.
VP emulator will be installed on HAM2.
Transfer functions will be running over night.
Vacuum team ready to pump down end of this week or next week.
Apollo crew will be here next week.
Be cautious of unlocked HEPIs.
Prep for end station work is beginning. Clean rooms are not on yet. EY is first on schedule.
TMDS equipment will be brought back to CS.
PSL will go off at the end of the day Thursday and remain off for the duration of the holiday break.
See whiteboard for entire plan and WORK SAFELY
All plots look normal
TITLE: 12/18 Day Shift: 16:00-00:00 UTC (08:00-16:00 PST), all times posted in UTC
STATE of H1: Planned Engineering
OUTGOING OPERATOR: None
CURRENT ENVIRONMENT:
Wind: 20mph Gusts, 11mph 5min avg
Primary useism: 0.05 μm/s
Secondary useism: 0.30 μm/s
QUICK SUMMARY: There is some alarm in the MSR, Richard investigated and it seems to be the tape drive not initializing. We will inform CDS when they arrive. Other than that cleaning crew is making their rounds.
The LVEA has transitioned to LASER SAFE
Both Chandra R. and myself had independently observed that the %open value for CP7's LLCV seemed unusually low.  After reviewing the recent values/history, the only thing that is unusual is that the storage tank (dewar) is abnormally full-having received a delivery recently.

No worries.
Kyle R., Rakesh K.

Last week Rakesh K. and I bolted together the NEG pump assemblies that get mounted atop the OMC tube prior to pumping down the Verex+YBM+XBM.  "Others" have shown (confidential study) that these NEG pumps can be a significant source of particulates in the size range that is of concern us if not first subjected to a few cycles of 1) heat soak at 250C (condition step), 2) heat soak at 550C (activation step), 3)cool down, 4) vent using UHP N2 followed by 5) a sustained viscous cross-flow of UHP N2 (60 psi source).  After a few of these cycles, the measured particulate falls off to acceptable levels (near zero counts per cf).

We were able to complete the assembly of (3) ea. of these pump assemblies.  I had hoped to complete (3) of these conditioning cycles in the lab for each pump assembly prior to installation but have had to succumb to the schedule.  As such, each NEG pump will need to complete the remaining cycle(s) after installation on to the OMC tube.  This will be done before exposing the Vertex vacuum to these pumps.  Note that the blank flange, opposite that used to introduce the viscous UHP N2 flow, gets removed for this process so as to allow liberated particulate to exhaust from the pump housing.
Misc. checks and some NEG pump prep. work in Room 169 for tomorrow.
1810 hrs. local -> Kyle leaving site now.
HAM2-3 work today (Cheryl, Ed, Sheila, Betsy)
Since Sheila and I finished after the rest of the crew I'll post this log, but hope that Cheryl (or other 2) feel free to add.
After some whiteboard work this morning to interpret the misalignments that Cheryl reported at IM1 yesterday, we proceeded with walking the beam through the IMs, adjusting mechanical yaw and pitch along the way. Although only mostly sure, we think the misalignment of IMs reported yesterday were due to the gamut of mechanical adjustments made to them over the last few weeks (a few bolt tightening exercises, B&K knocking, realignments within the cage, slight misalignments left over from previous alignments, you name it...). So we decided that it was not crazy to think that twisting the tower to correct such things in order to buy back maxed AOSEM ranges was prudent. In the end, the twist of IM1 to IM2 was achieved by loosening dog clamps and barely applying some finger pressure to the tower to 'feel' a sub-millimeter slide on the table". We needed even less at IM3 and IM4 in yaw, and nothing at IM2. Only IM4 needed additional Pitch mechanical bias relief, for this Cheryl needed to remove the structure baffle and switch the pitch adjusting locking collar to the back side for ease of use. At COB just now, we have reasonable bias on all IMs (~50% DAC range used here and there), and the beam well centered on all, plus the input of the FI, the output of the FI, the PRM iris, the PR2 iris, and the PRM refl beam going back to HAM1 (with exisiting bias from previous alignment).
For the record, to do this we:
Translated IM1 to center beam on closes wave plate and baffle,
Yaw/Pitch IM1 to center beam on IM2 and fine align to FI input,
Yaw/Pitch IM2 to center output of FI and check alignment ot IM3 is also good,
Yaw/Pitch IM3 to PRM iris,
Yaw/Pitch IM4 to PR2 iris,
Bias relief mechanically as needed,
Took quick TFs along the way to make sure IMs were healthy as we went since we were adjusting things on them,
Centered IM3 LR and UR AOSEMs since 1 had become near 0 and the other was also slightly out and was super easy to fix.
I also fixed that PRM front dummy flag that Cheryl reported as getting knocked during cleaning the other day. All AOSEM signals look good on that guy.
MONDAY - Install bypass mirror and align ISS.
TITLE: 12/16 Day Shift: 16:00-00:00 UTC (08:00-16:00 PST), all times posted in UTC
STATE of H1: Planned Engineering
LOG:

15:20 UTC Mark and Tyler to LVEA to install NEG pump on output tube
15:32 UTC Bubba to LVEA to join Mark and Tyler
16:16 UTC Chris to LVEA to talk to Bubba
16:31 UTC Bubba back
16:36 UTC Chris back, will open LVEA high bay outer rollup door
16:36 UTC Richard out of LVEA
17:01 UTC Mark and Tyler back
17:26 UTC Richard to LVEA to retrieve tools from bier garten
17:34 UTC Richard back
17:51 UTC Richard and Filiberto to LVEA to test ESTOPs
17:55 UTC Peter transitioning LVEA to laser hazard
17:58 UTC Tractor delivery through gate for Bubba
Richard back
18:31 UTC Travis to bier garten to pack up equipment
18:38 UTC Filiberto back from LVEA, going to end Y to jumper EtherCAT safety block
18:46 UTC Terry to squeezer bay, squeezer bay to laser hazard
18:48 UTC Travis done
18:57 UTC Nutsinee to squeezer bay
19:06 UTC Filiberto going to end X to jumper EtherCAT safety block
20:43 - 20:50 UTC Elizabeth dropping off cables in CER
21:01 UTC Nutsinee back
21:11 UTC Ed and Yannick to HAM2 area to garb
21:14 UTC Travis, Mark and Tyler to LVEA to prep for moving equipment to end stations
21:23 UTC Bubba to end Y
21:23 UTC Betsy to HAM2
21:23 UTC Richard to LVEA to test Beckhoff laser safety interlock
21:32 UTC Travis, Mark and Tyler back
21:36 UTC Sheila, Betsy, Cheryl, Ed and Yannick in HAM2
21:56 UTC Bubba back
22:27 UTC Richard and Filiberto to LVEA
Richard back
23:01 UTC Filiberto back
23:09 UTC dust alarm in vacuum prep lab
23:25 UTC Travis to LVEA to take torque wrench to HAM2
23:36 UTC Travis back
23:36 UTC Terry to squeezer bay
23:47 UTC Nutsinee to squeezer bay
00:03 UTC Yannick back
The LVEA has transitioned to LASER HAZARD
The LVEA has been transitioned to LASER SAFE.
For the duration of the current post-O2 Vertex+YBM+XBM vent and up until a few days ago, the two Bayard-Alpert/parani wide-range pressure gauges located at BSC7 and BSC8 have been "railed" at their maximum pressure reading of 750 torr.  Recently, however, they are both "on-scale", i.e. reading less than 750 torr.

I assume that this is the result of the recent weather (low barometer) and not related to the recent purge air supply issues.
Please be mindful of the signs and the floating blue parts. The pump station is not running so the HEPI can not be isolated. So, the platform can not be tripped but it can be moved, so again, mind the signs and avoid the blue hardware. The ability to isolate and so be tripped will not be until all the 4-way valves are changed to the run position and fluid is lowing through the actuators. I don't want to re-pressurize the flex lines near the open chambers so waiting on doors.
When the HEPIs were locked way back mid September, it was done so with them isolated and it was attempted to lock them in the isolated position. WHAM4 was locked pretty close, see aLog 38654 for the numbers. However, since all the alignments and work was down in the locked position, the CART_BIAS SETPOINT which is the servo'd to position, was reset to the locked position. After unlocking, the large HEPI payload springs were adjusted to reduce the residual=free hang position less the setpoint, as much as possible. Did manage to get under 3um or urads. The final adjustments were single springs turned ~1/24th turn. After isolating or running TFs or ROM tests, this free hanging position will likely change, but, it is a start. At least the first time it should have no problem isolating and serving to the TARGET locations. SDF files have been updated but not committed (issues with svn I understand?)
"However, since all the alignments and work was down in the locked position,..." this phrase should have read However, since all the alignments and work was done in the locked position...
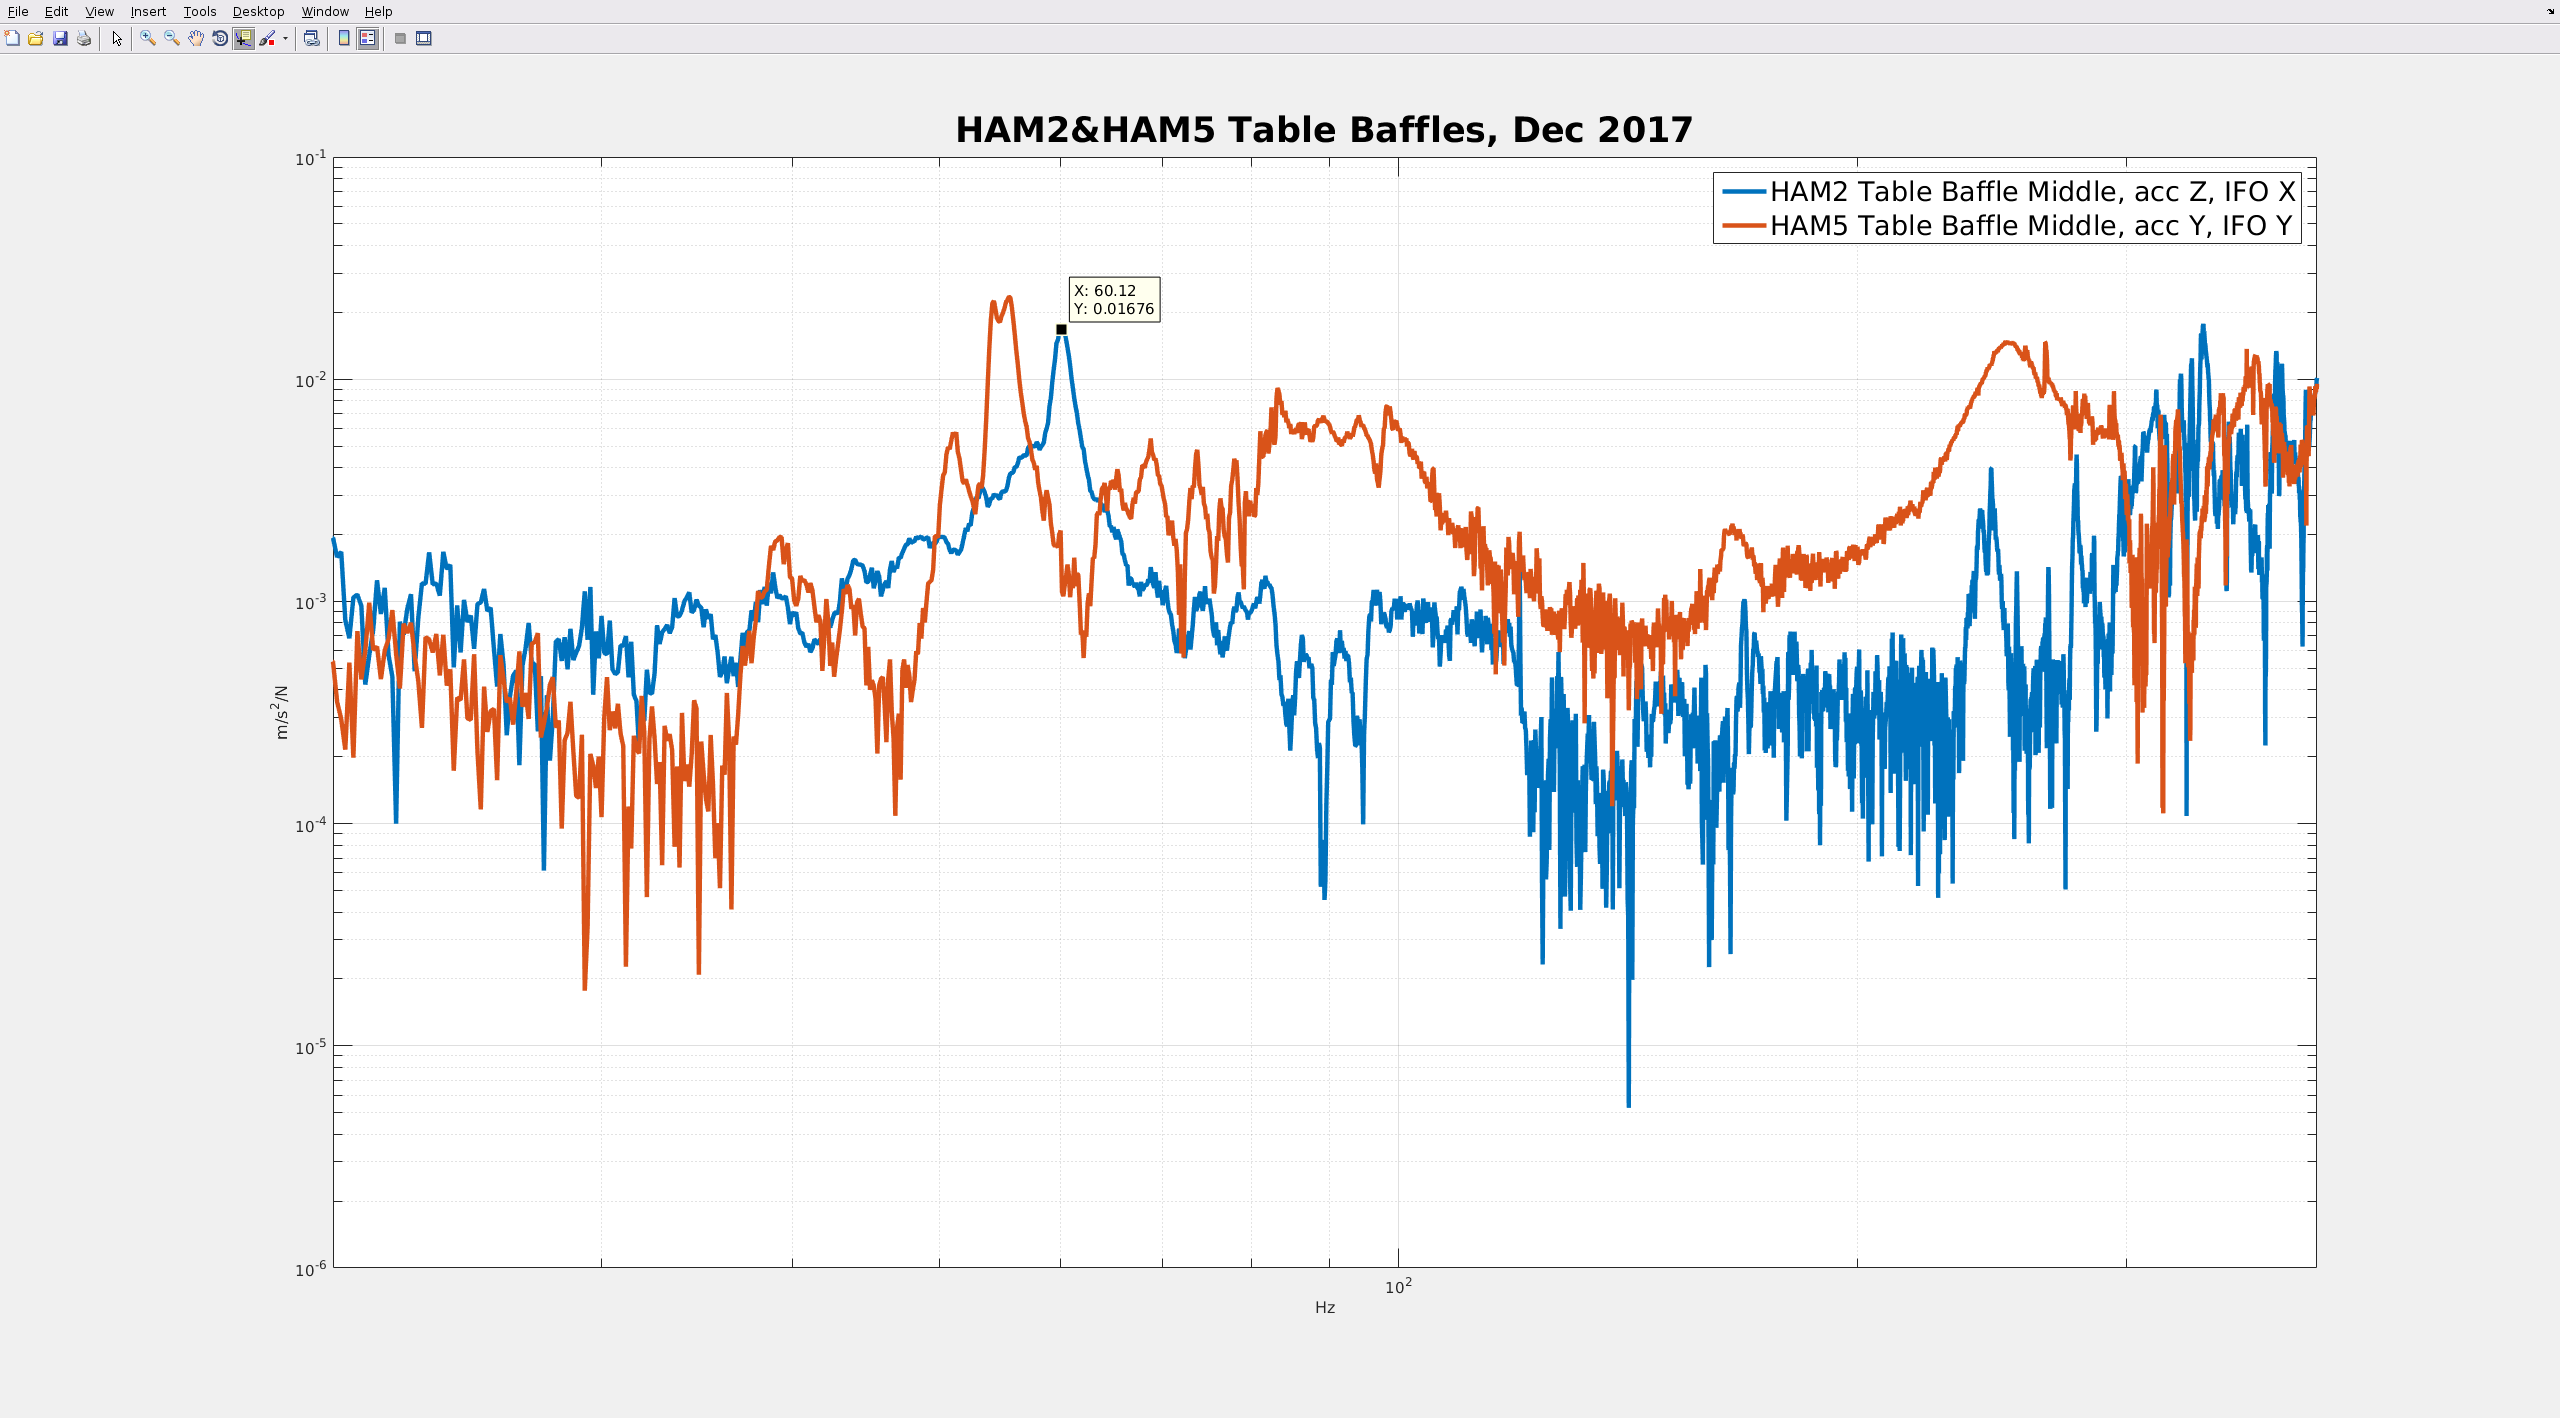
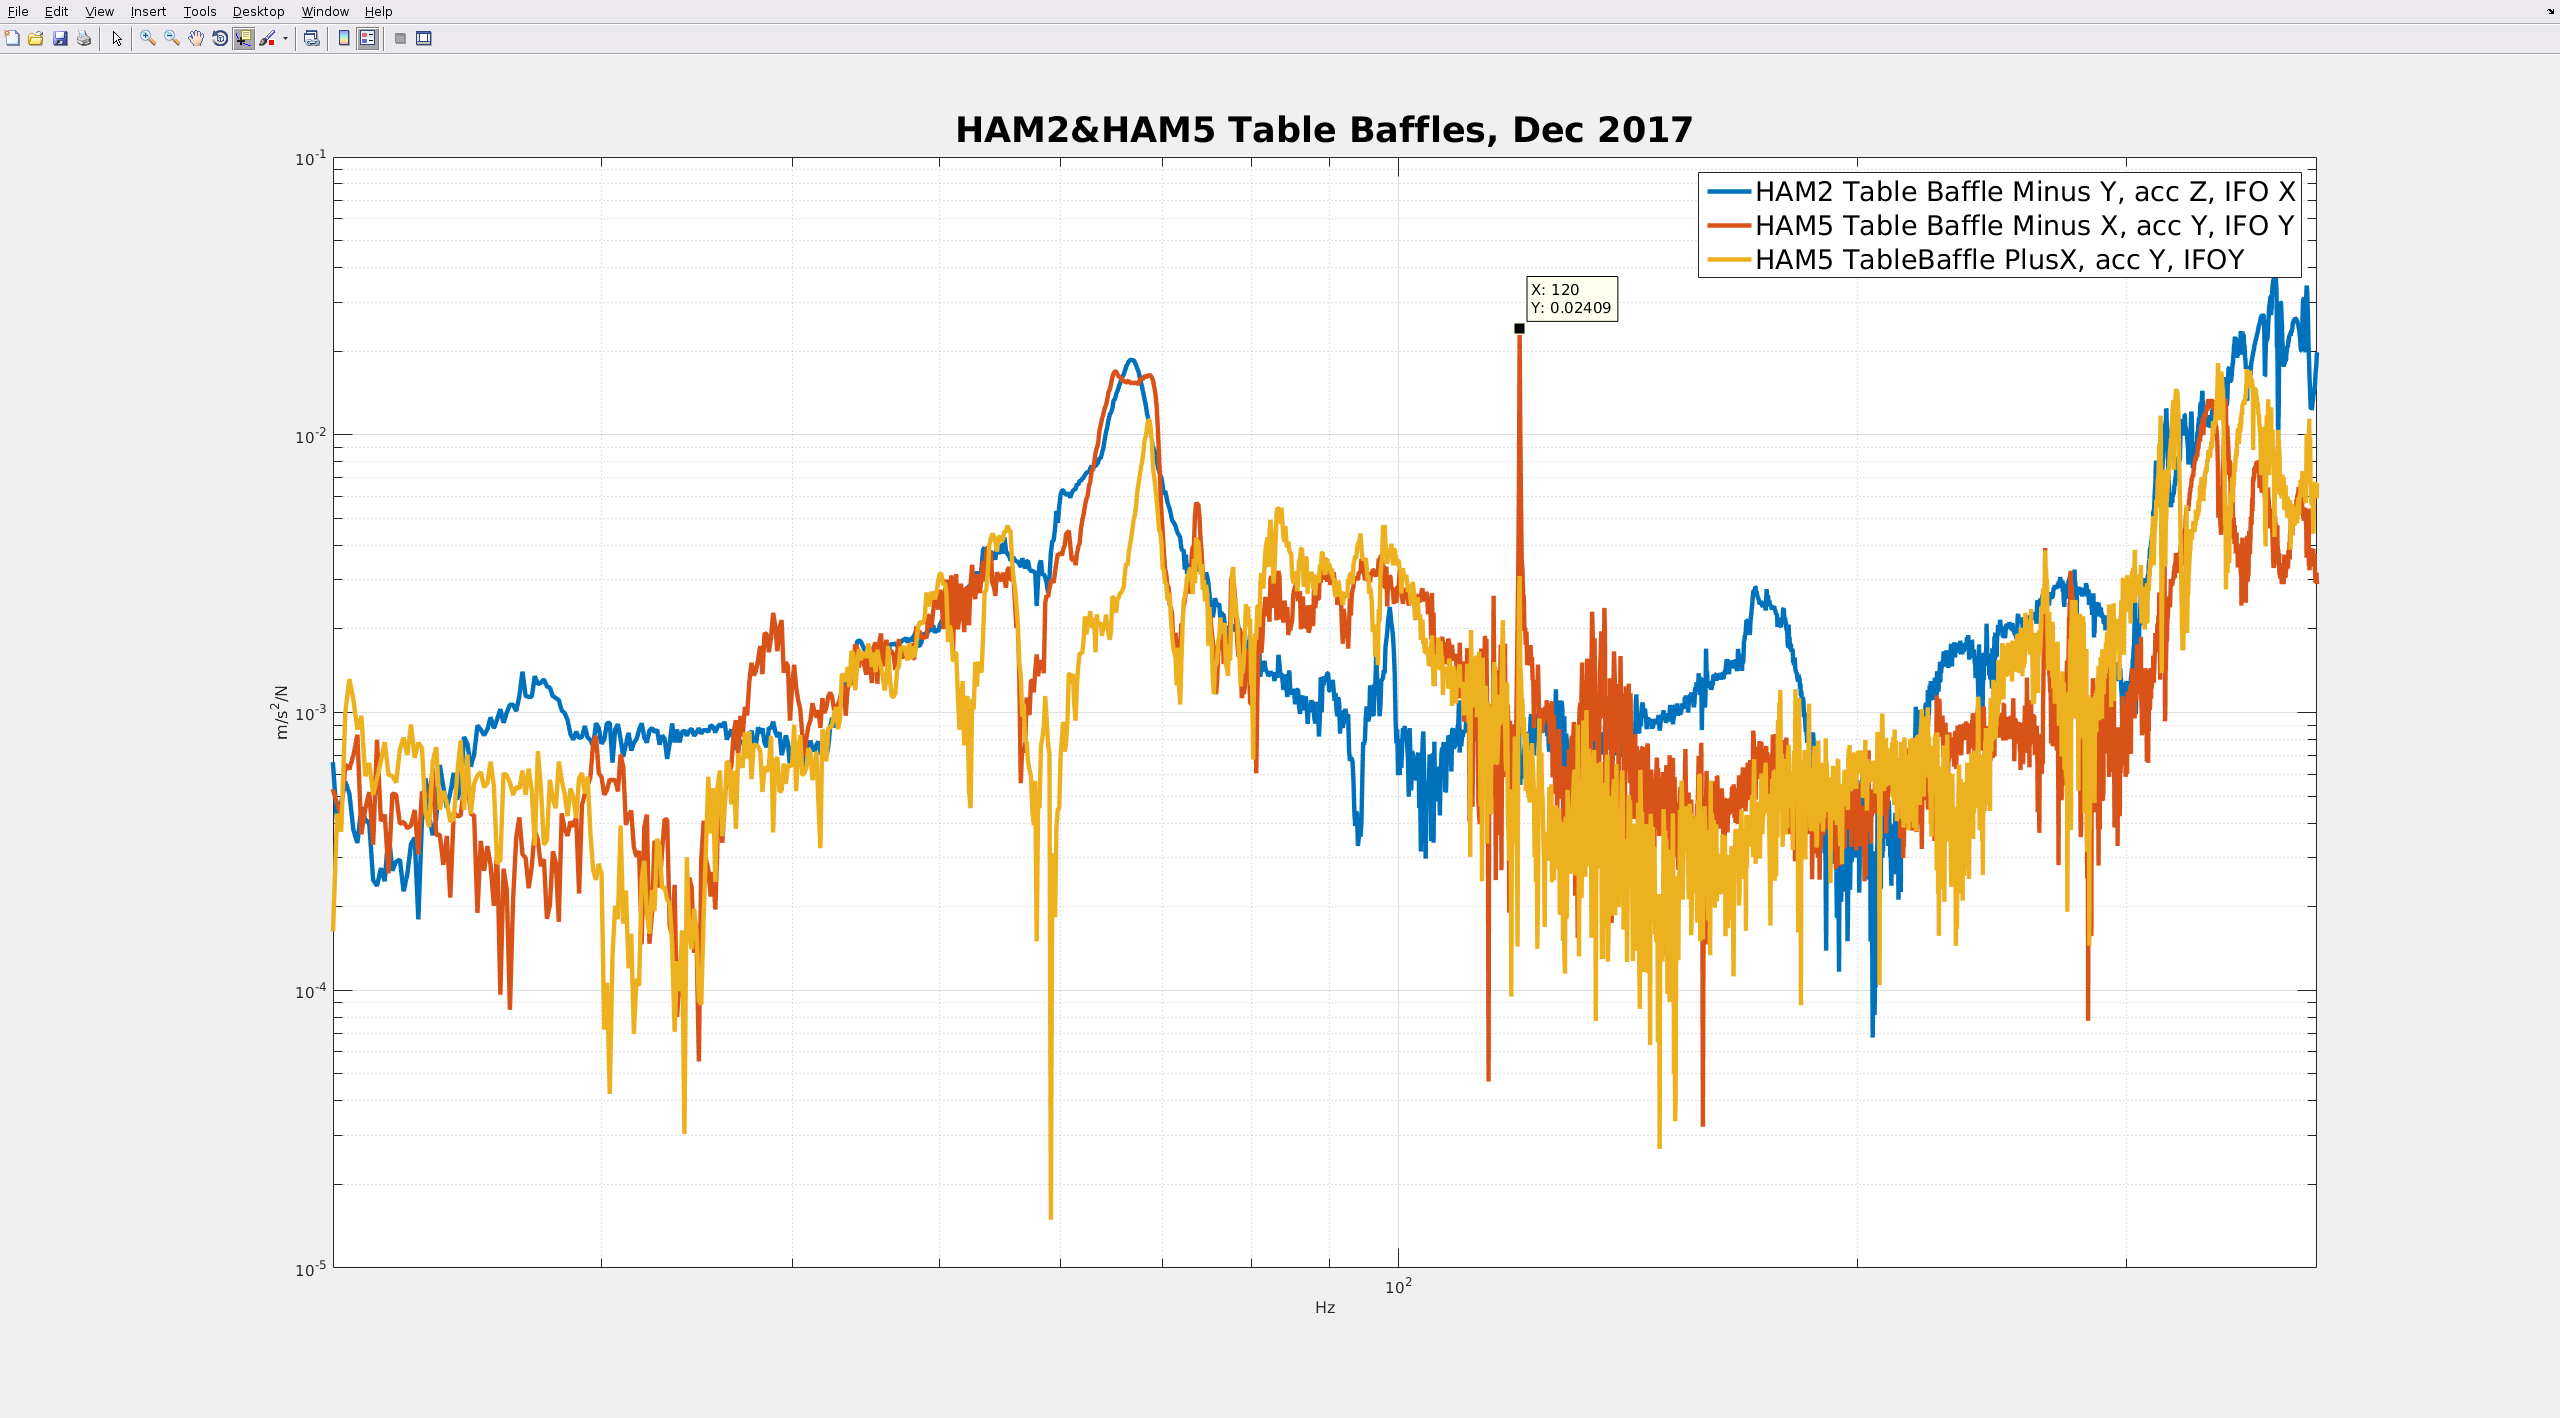
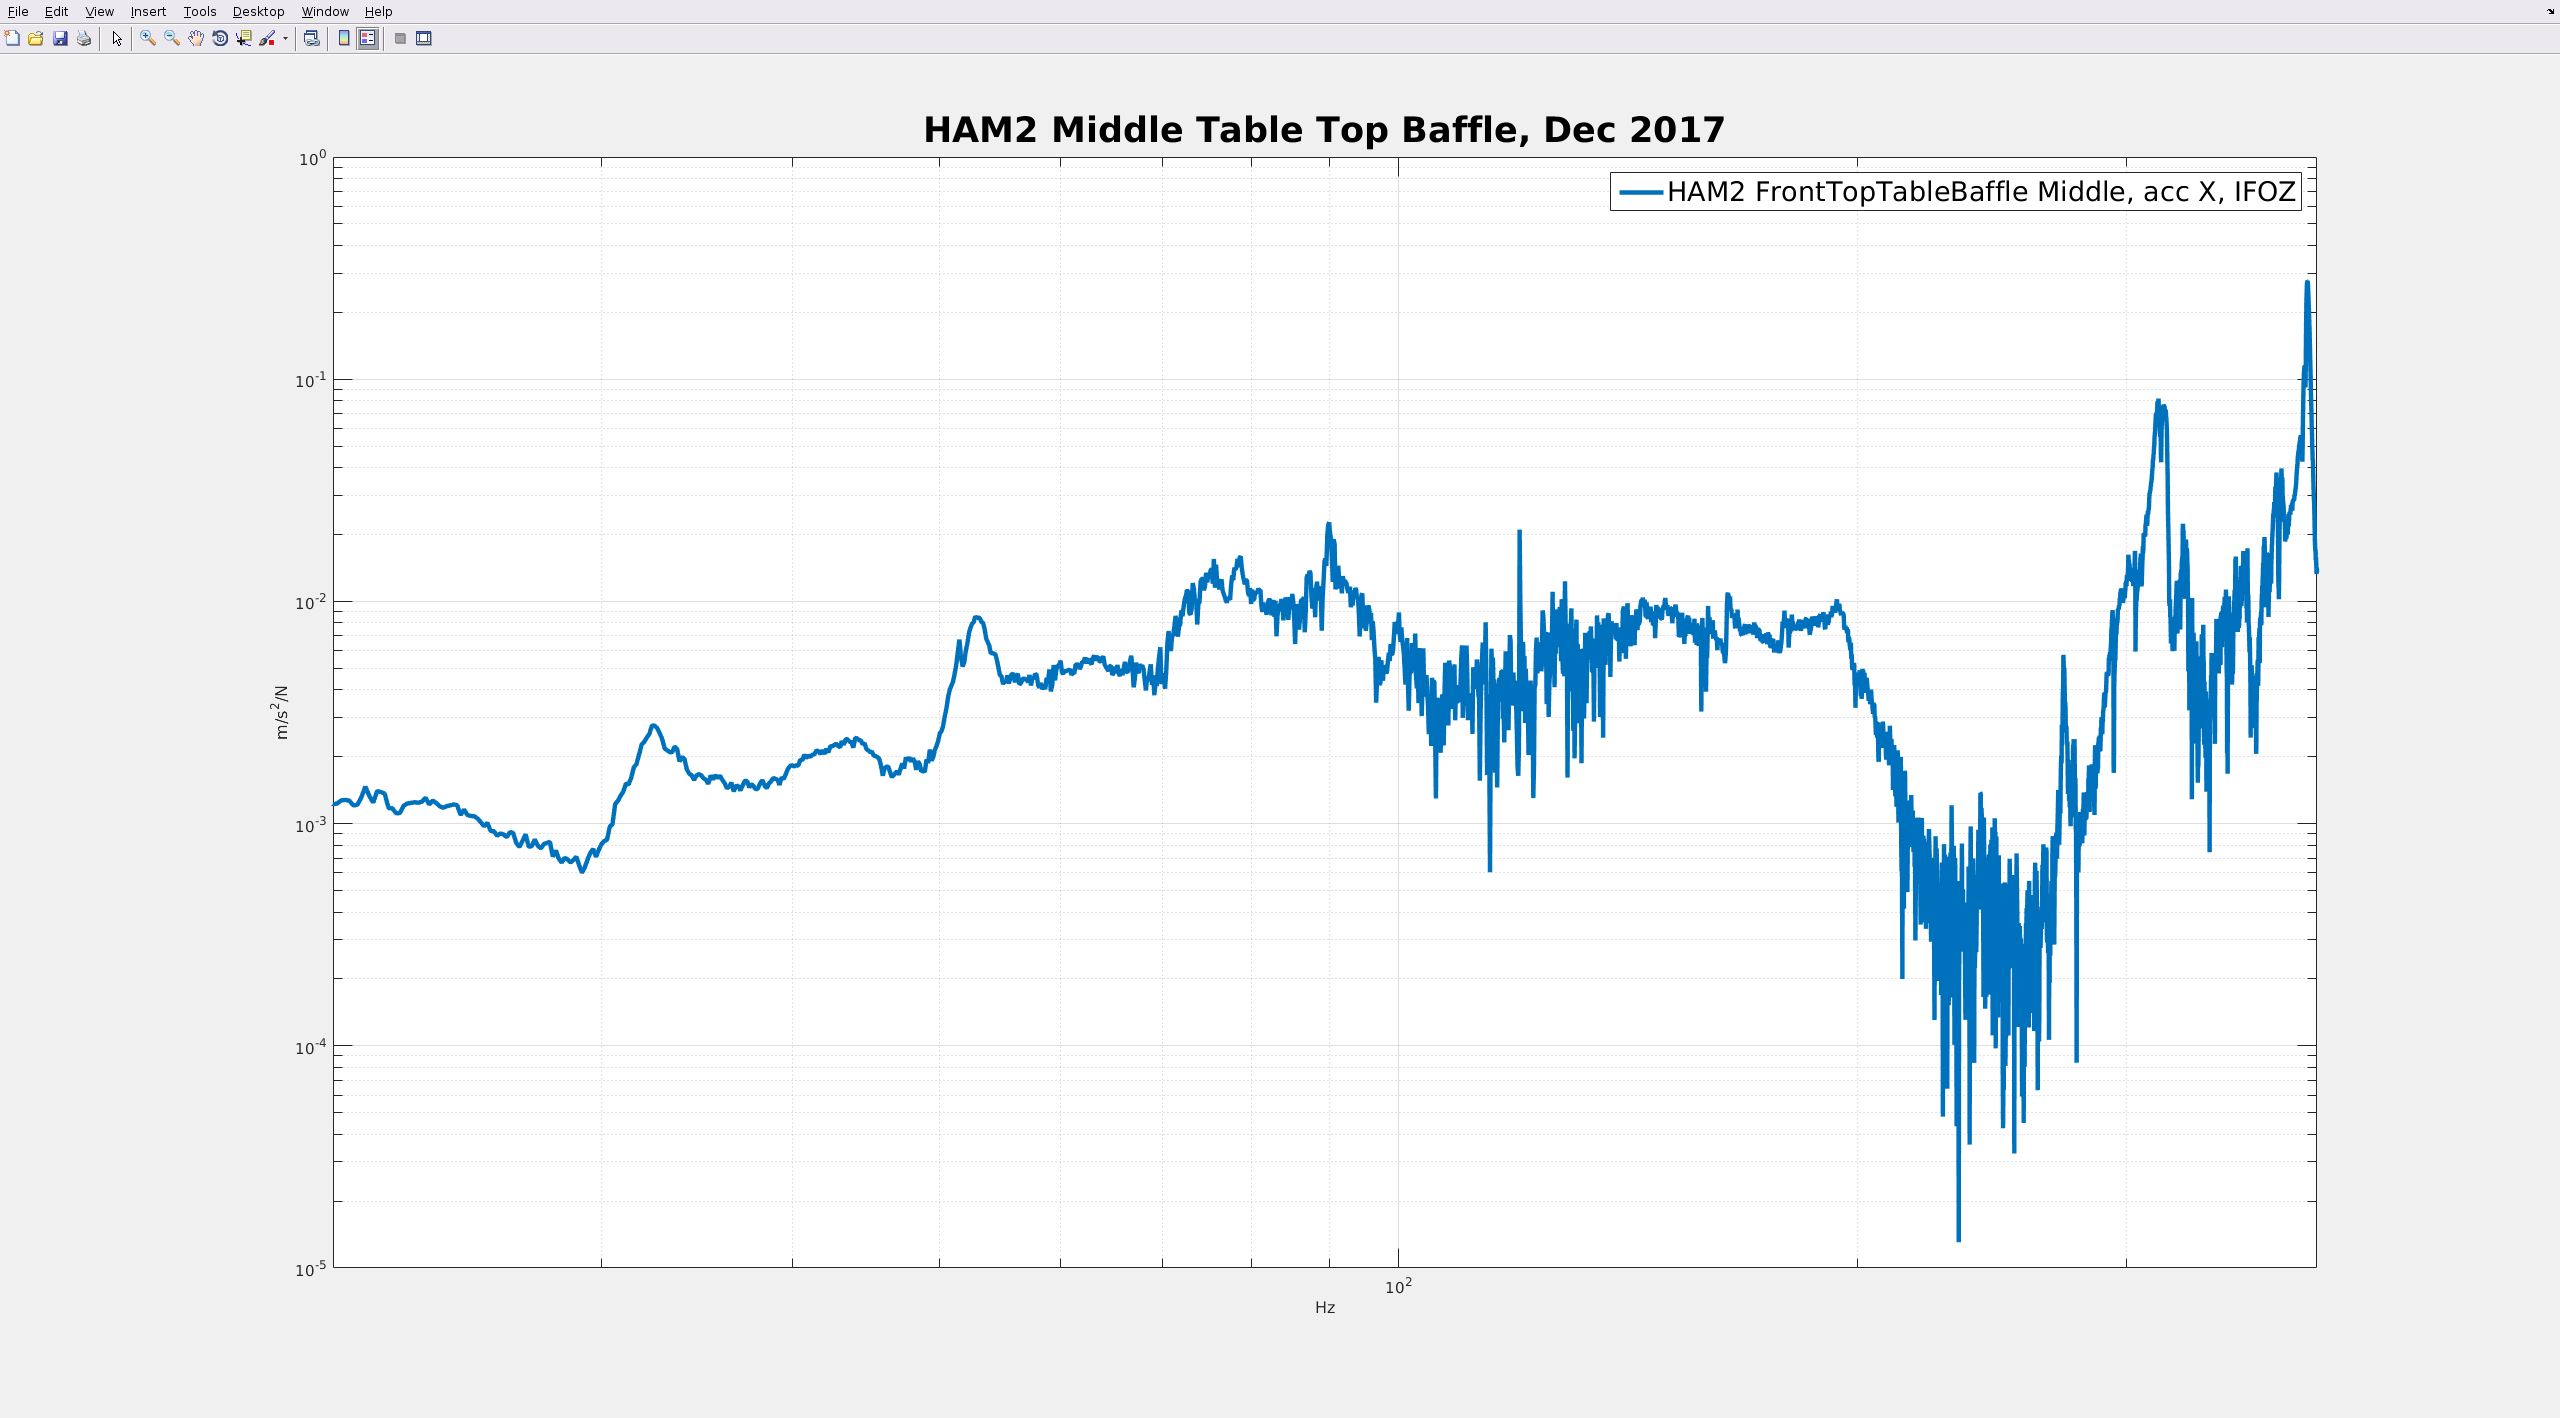
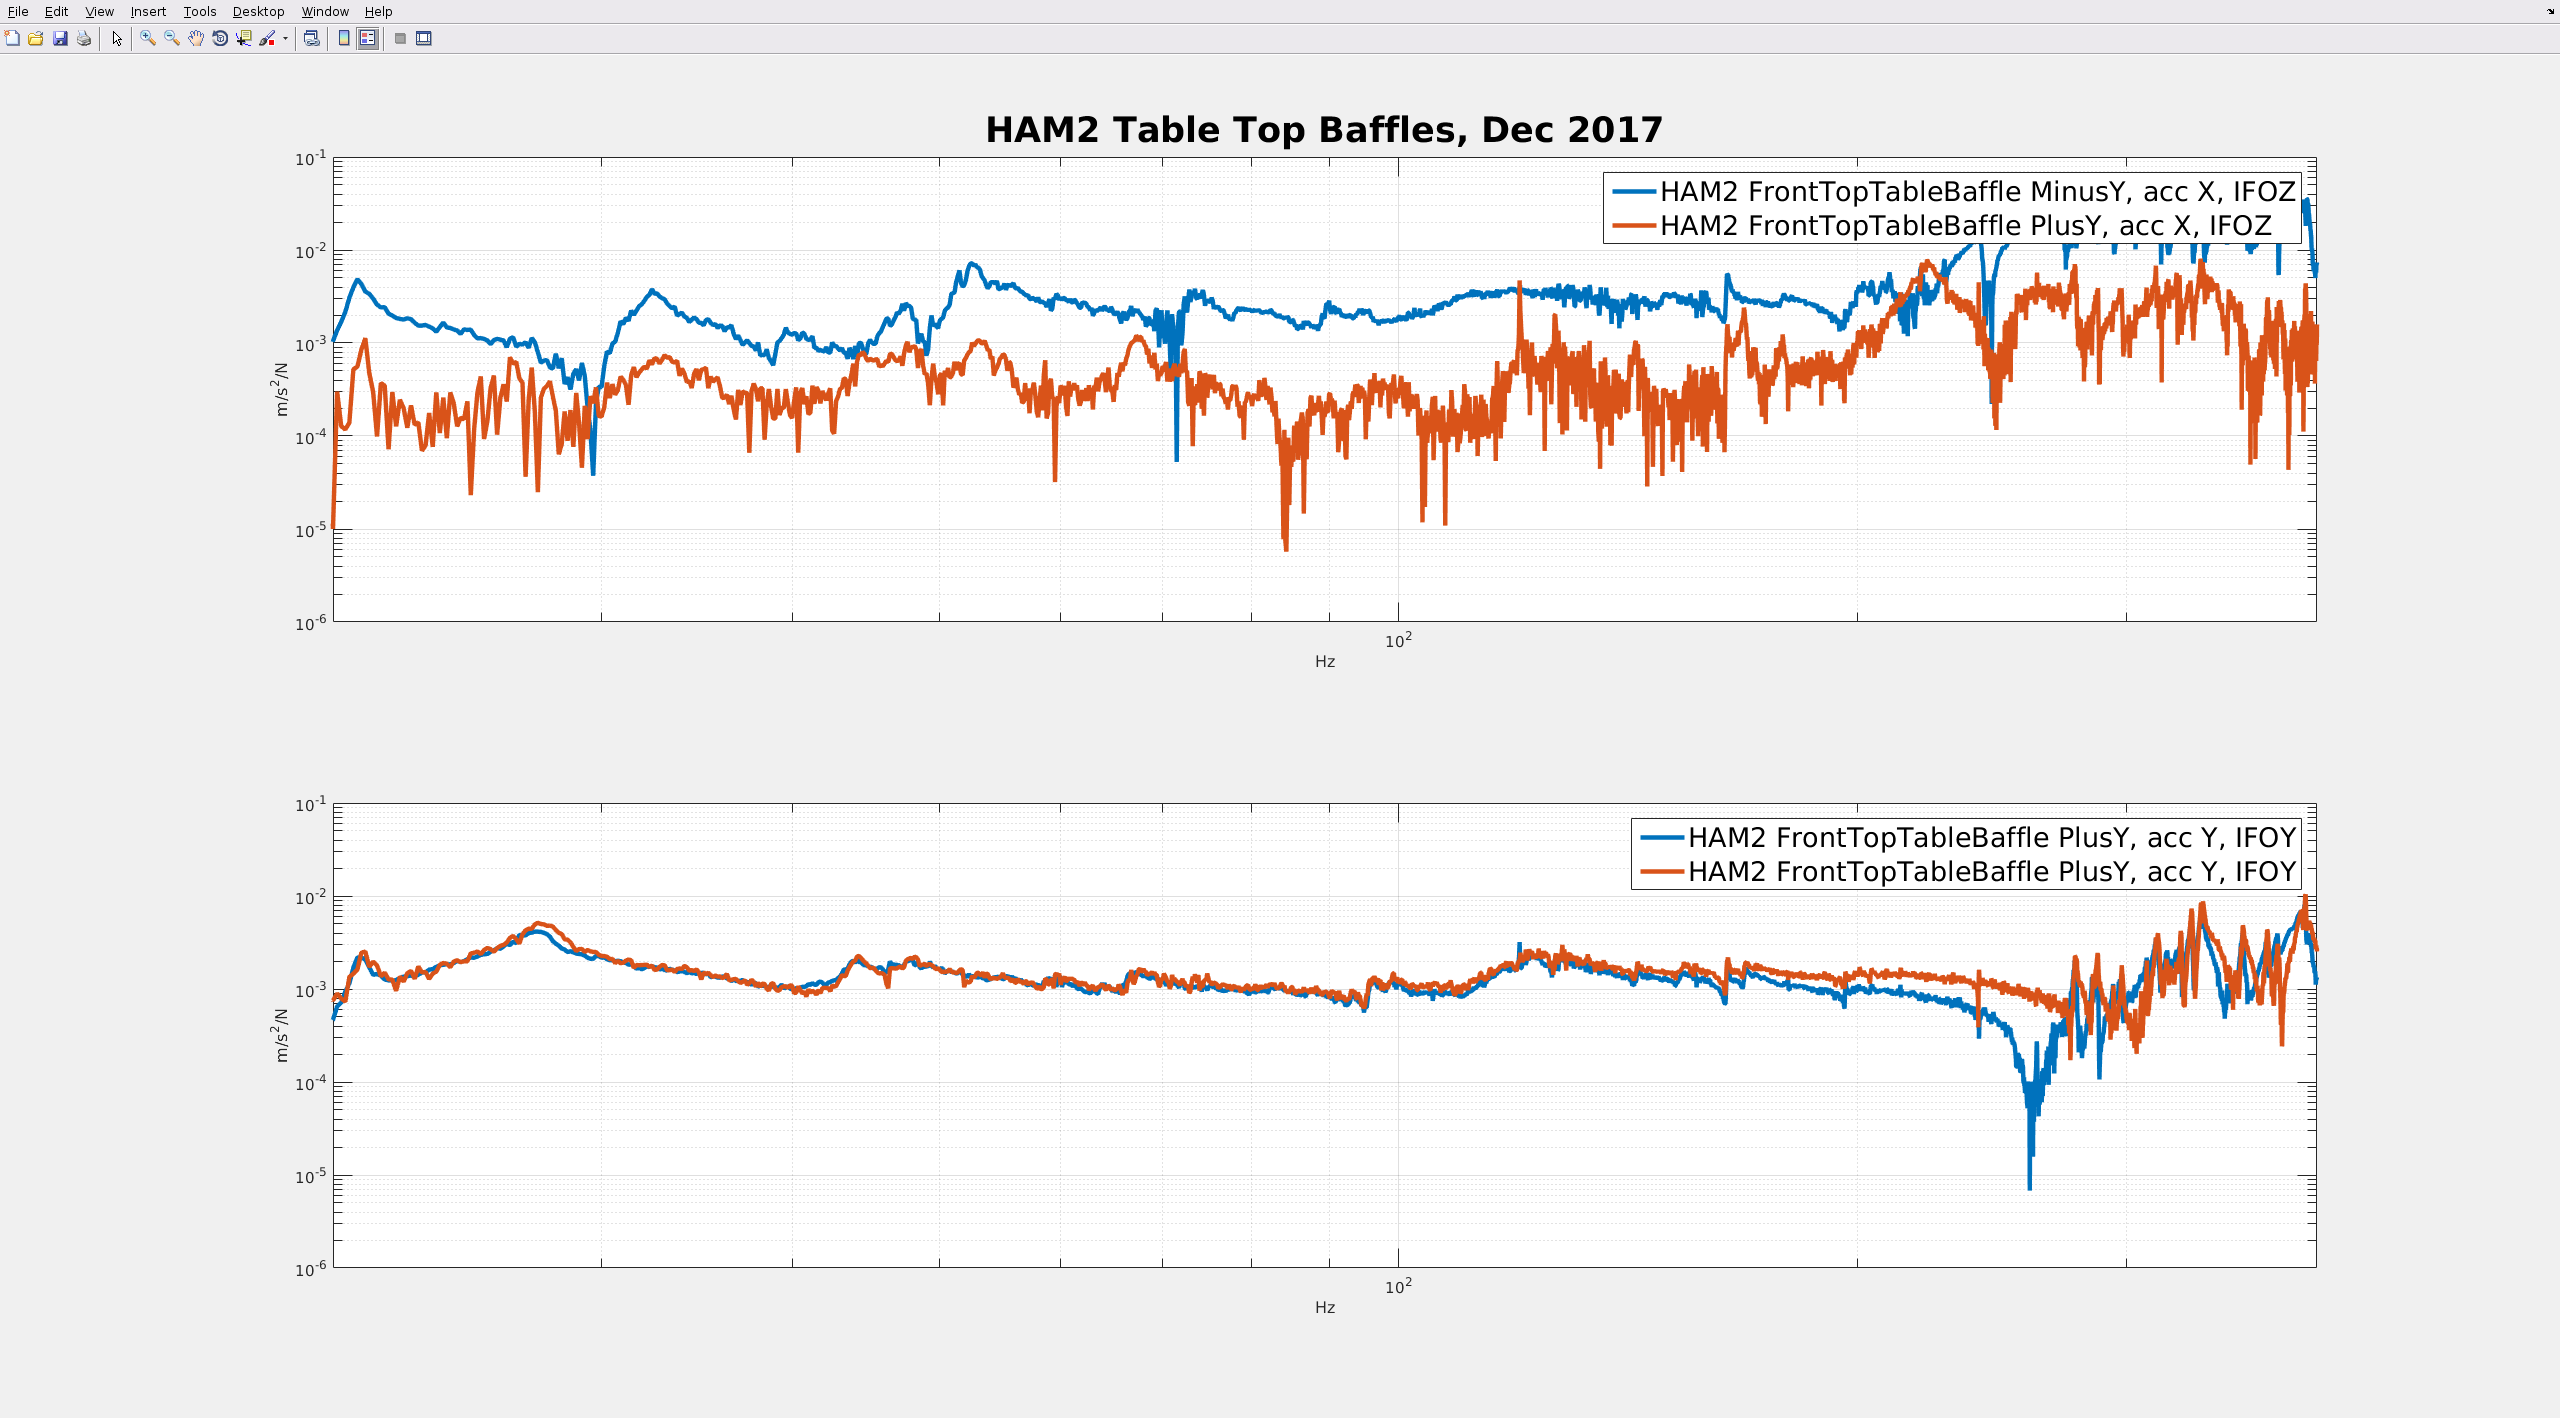
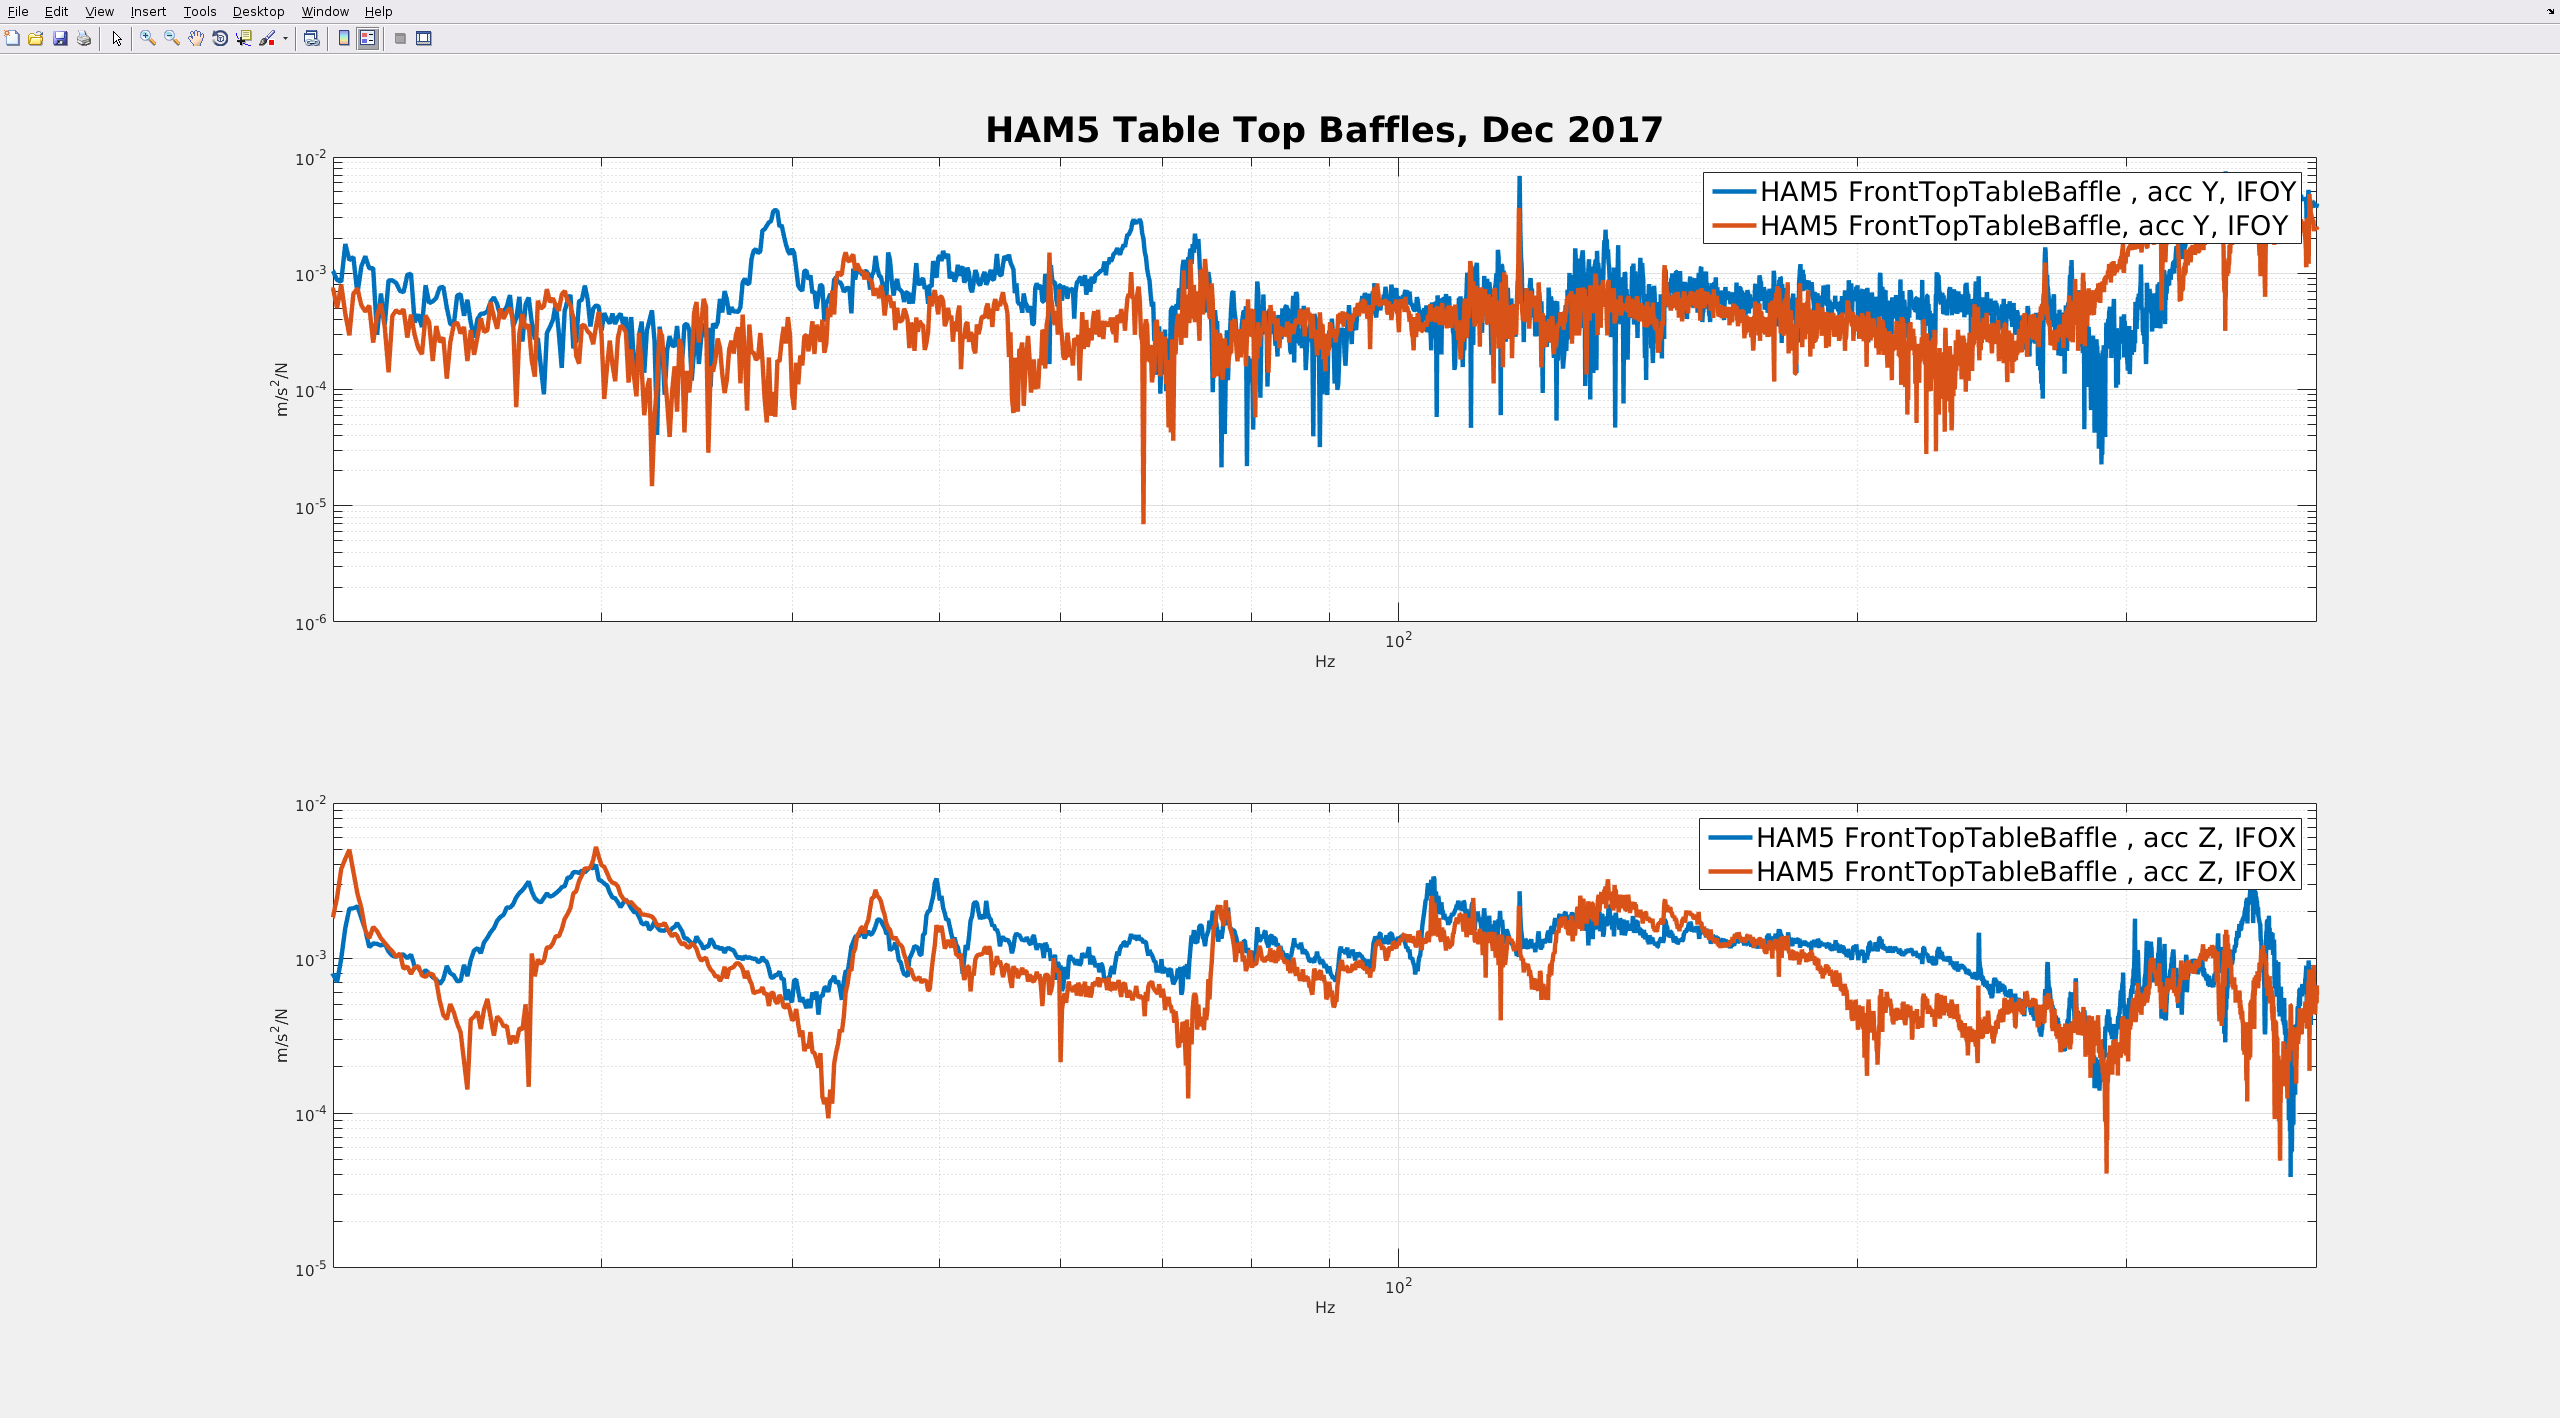
I'm posting the BnK measurements of the HAM2 & HAM5 table baffles. I've split the plots up into similar structures (Plus/Minus X/Y beard baffles, Middle beard Baffles, HAM2 table top baffles, HAM5 table top baffles) and equivalent excitations/accelerometer orientation relative to "beamline" (X for HAM2, Y for HAM5). I'm using Jeff's names for the baffles, so Table baffles are the beard baffles. Table Top baffles are the table baffles that typically lie flat on the ISI optics table in front of the suspensions. It looks like I grabbed the wrong data for the MC1 Table Top baffle, so I need to look into that some more.
Most of the well resolved stuff seems to be well damped, I don't think I saw any of the low frequency (50-60 hz stuff) on the first plot in the HAM5 or HAM2 ISI tfs. The sharp 120 hz feature on the HAM5 MinusX table baffle is worrying, but there was probably a lot of loose mass on the table at the time. The HAM5 measurements are from Dec 6, before Hugh and Brijesh balanced that table.
I've put the txt BnK exports in the Seismic SVN at:
/ligo/svncommon/SeiSVN/seismic/HAM-ISI/H1/Common/Data/HAMBnK_measurements/HAM2/
/ligo/svncommon/SeiSVN/seismic/HAM-ISI/H1/Common/Data/HAMBnK_measurements/HAM2/
The script I made the plots with is at:
/ligo/svncommon/SeiSVN/seismic/HAM-ISI/H1/Common/Data/HAMBnK_measurements/HAM2_table_baffles.m
As far as the HAM5 table goes--I cleaned up the table and bolted down and viton'd the table top masses on Dec1. However, on Dec7, GM found the new ZM2 mirror and the Septum Beam dump needing torquing.
After another marathon day in chambers, Fil, Richard, Travis, and I finally finished connecting the newly fabricated ITM ESD feedthru connections in-chamber and their subsequent testing (FRS Ticket 5033). The testing, of course, was not straight forward and we walked around troubleshoot a few things here and there. We struggled with the ITMX BIAS intermittently failing the HIPOT testing and continuity checks (see issues with this reported last year 27562). We tracked down the issue to the pin at the other end of the cable we reterminated (and have not touched during this vent) which led to me disassembling the connector a bit and looking for shorting mechanisms. I didn't find any, but upon reassembling the connector, things seemed to test fine. Sigh.
Fil will likely post the full numbers above or below this alog for both ITMX and ITMY testing (which included HIPOT).
Meanwhile, the ground checks of the SUS cables that were checked on ITMX, ITMY, and the BS which failed a few days ago were fixed via a variety of reseating the connection fasteners at the feedthru end of the cable, remedying pinch points of cables in-vacuum, or resolving to have EE fix it somewhere on the outside. Most of the cables had not been touched during this vent, with the exception of the ITMX PUM one which had migrated out of it's viton pad seat during the ITMX rebuild last month.
So, really, really we could do the BSC 1, 2, 3 closeout tomorrow.
Sorry, forgot the shout out to Gerardo and Kyle who swapped the actual feedthru at the chamber port.
After new feedthru was installed:
1. In-vacuum cable was connected
2. New 5-way connector pigtail was connected to feedthru (air-side).
3. All pins were tested with HI-POT tester to 1KV, except ITMX bias which was only tested to 500V. This included new pigtail air-side cable.
4. After HI-POT testing, grounding shorts were addressed for cables SUS-42 and SUS-57. See alog 39744. Found one of the cables had its air-side backshell shorted to cable shield. This was fixed. Other issue was fixed in chamber, see above entry from Betsy.
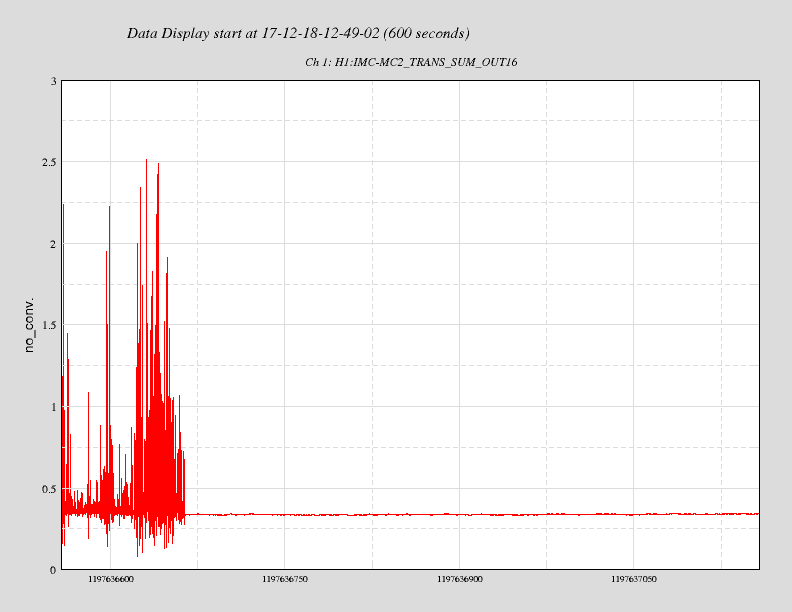
Over the last week we have noticed an anomalous peak in the amplitude spectrum of various sensors on ETMX-ISI, reminiscent of the 0.6Hz peak on HAM 2(?) back when
Looking more closely it seems to be mostly showing up on a few of the CPS channels, St1-H1, ST2-H2 and H3, see the attached screen shot. This data is with the loops on
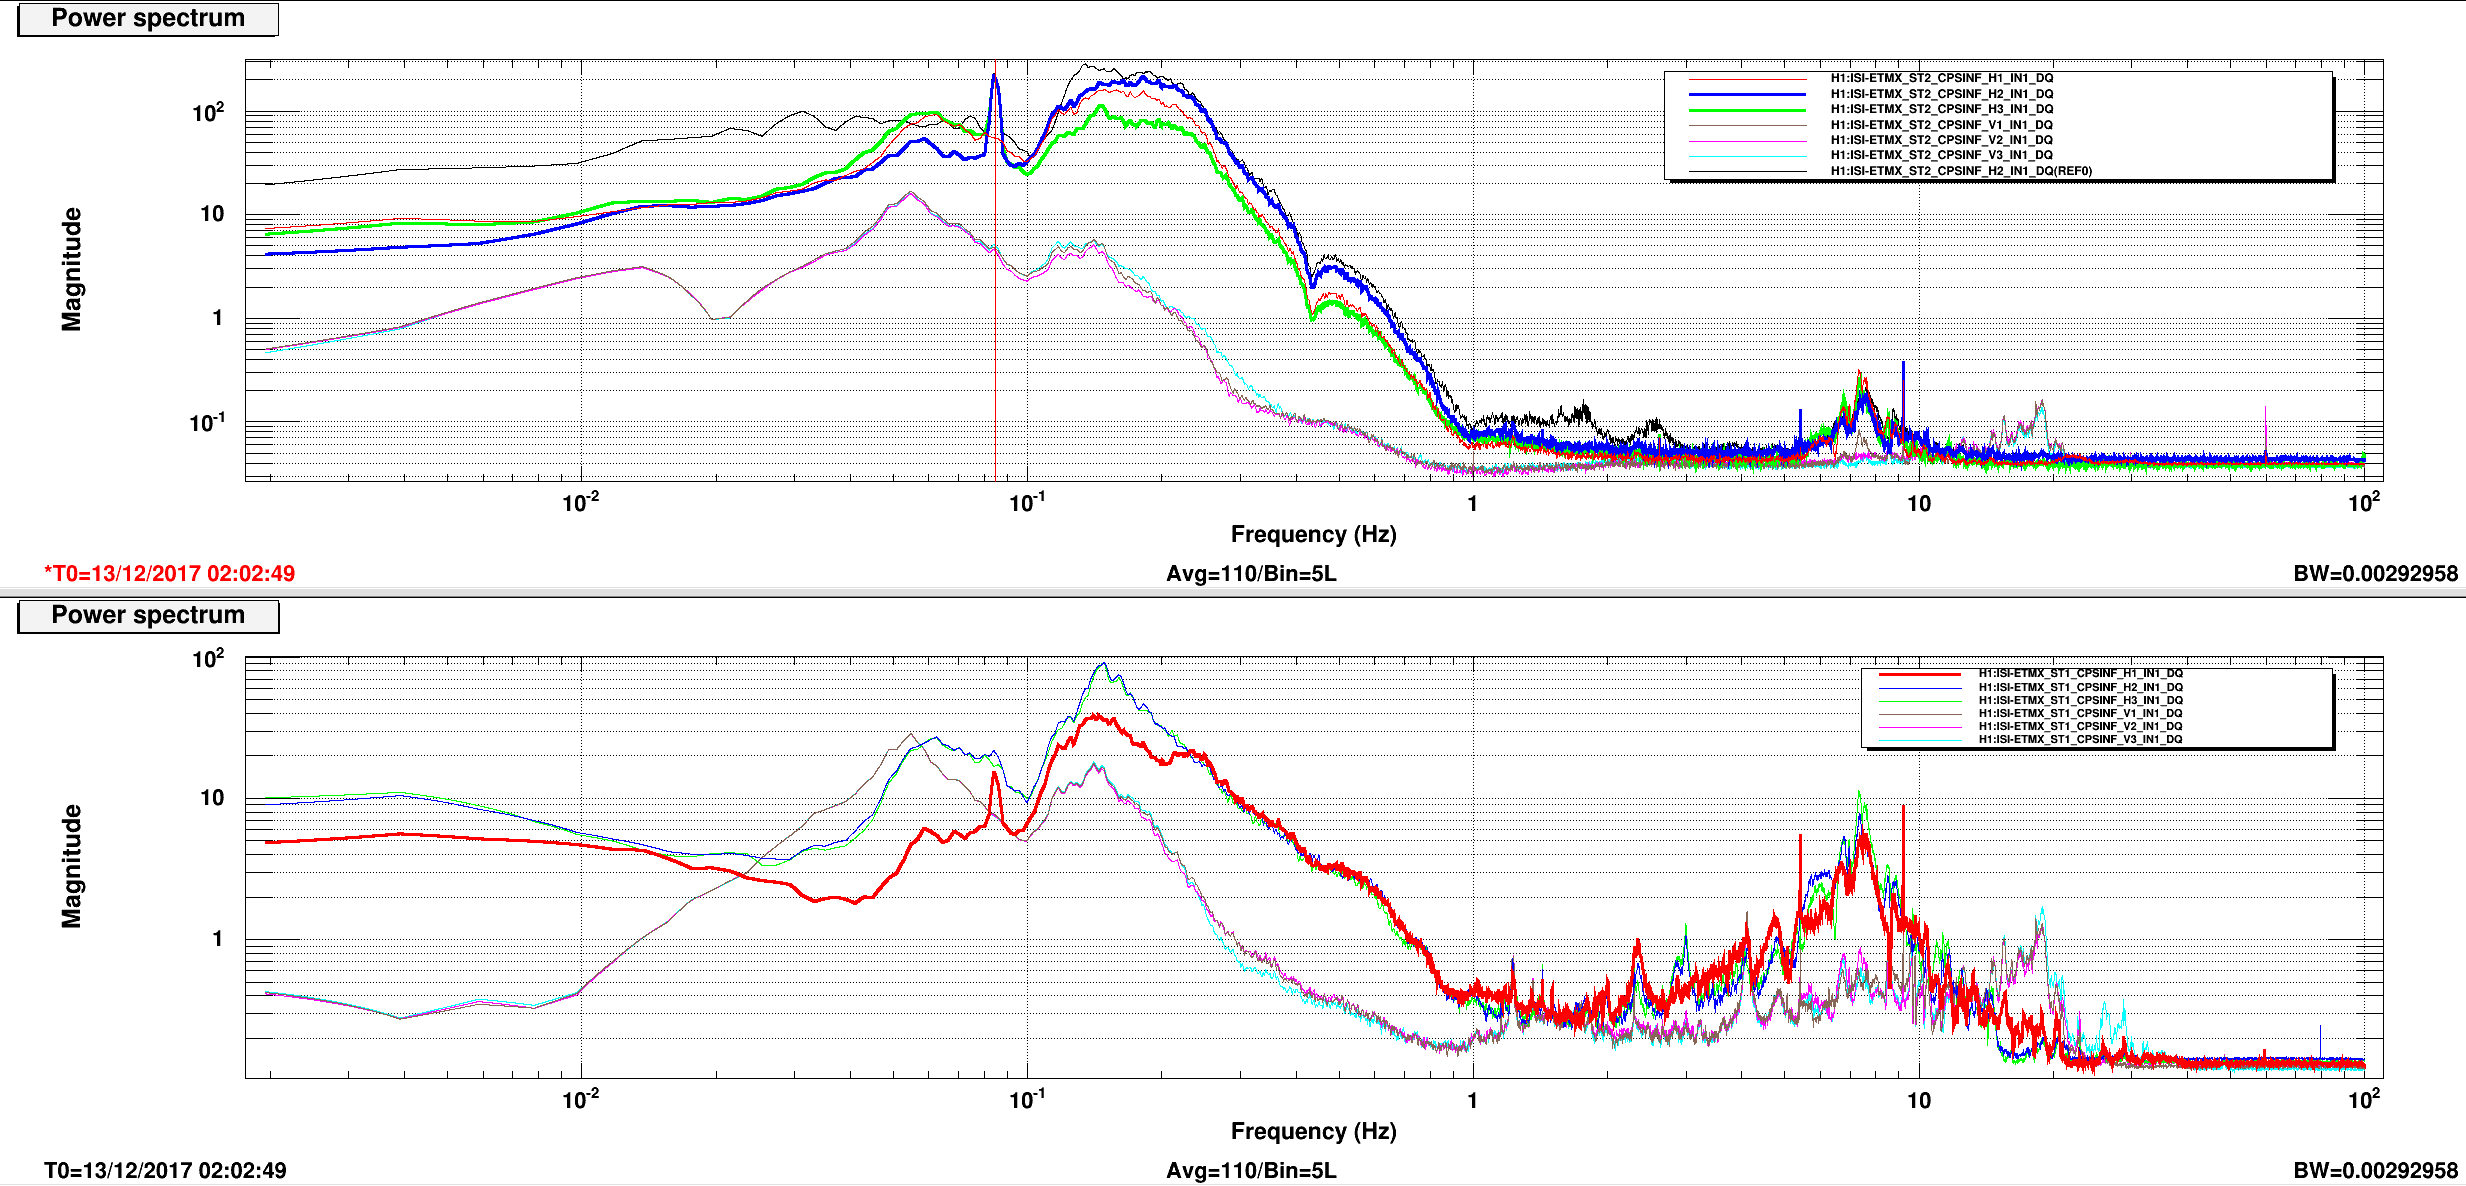
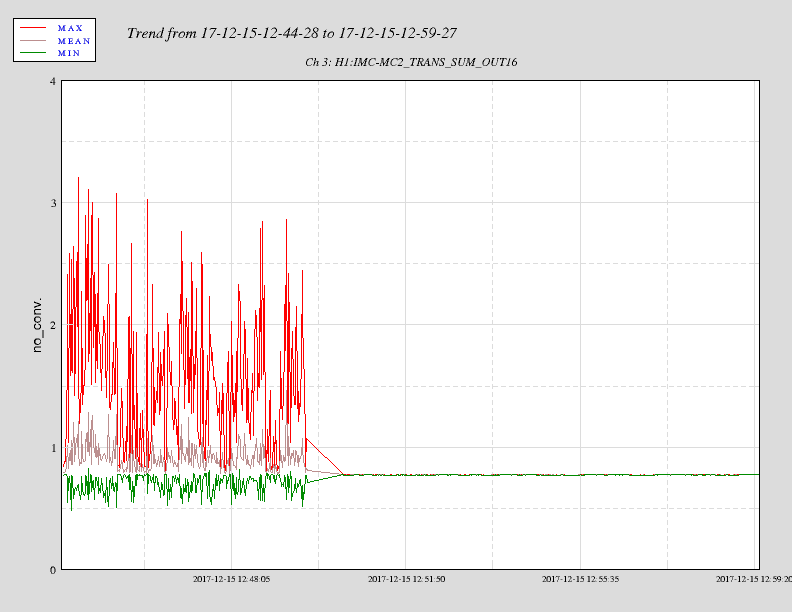
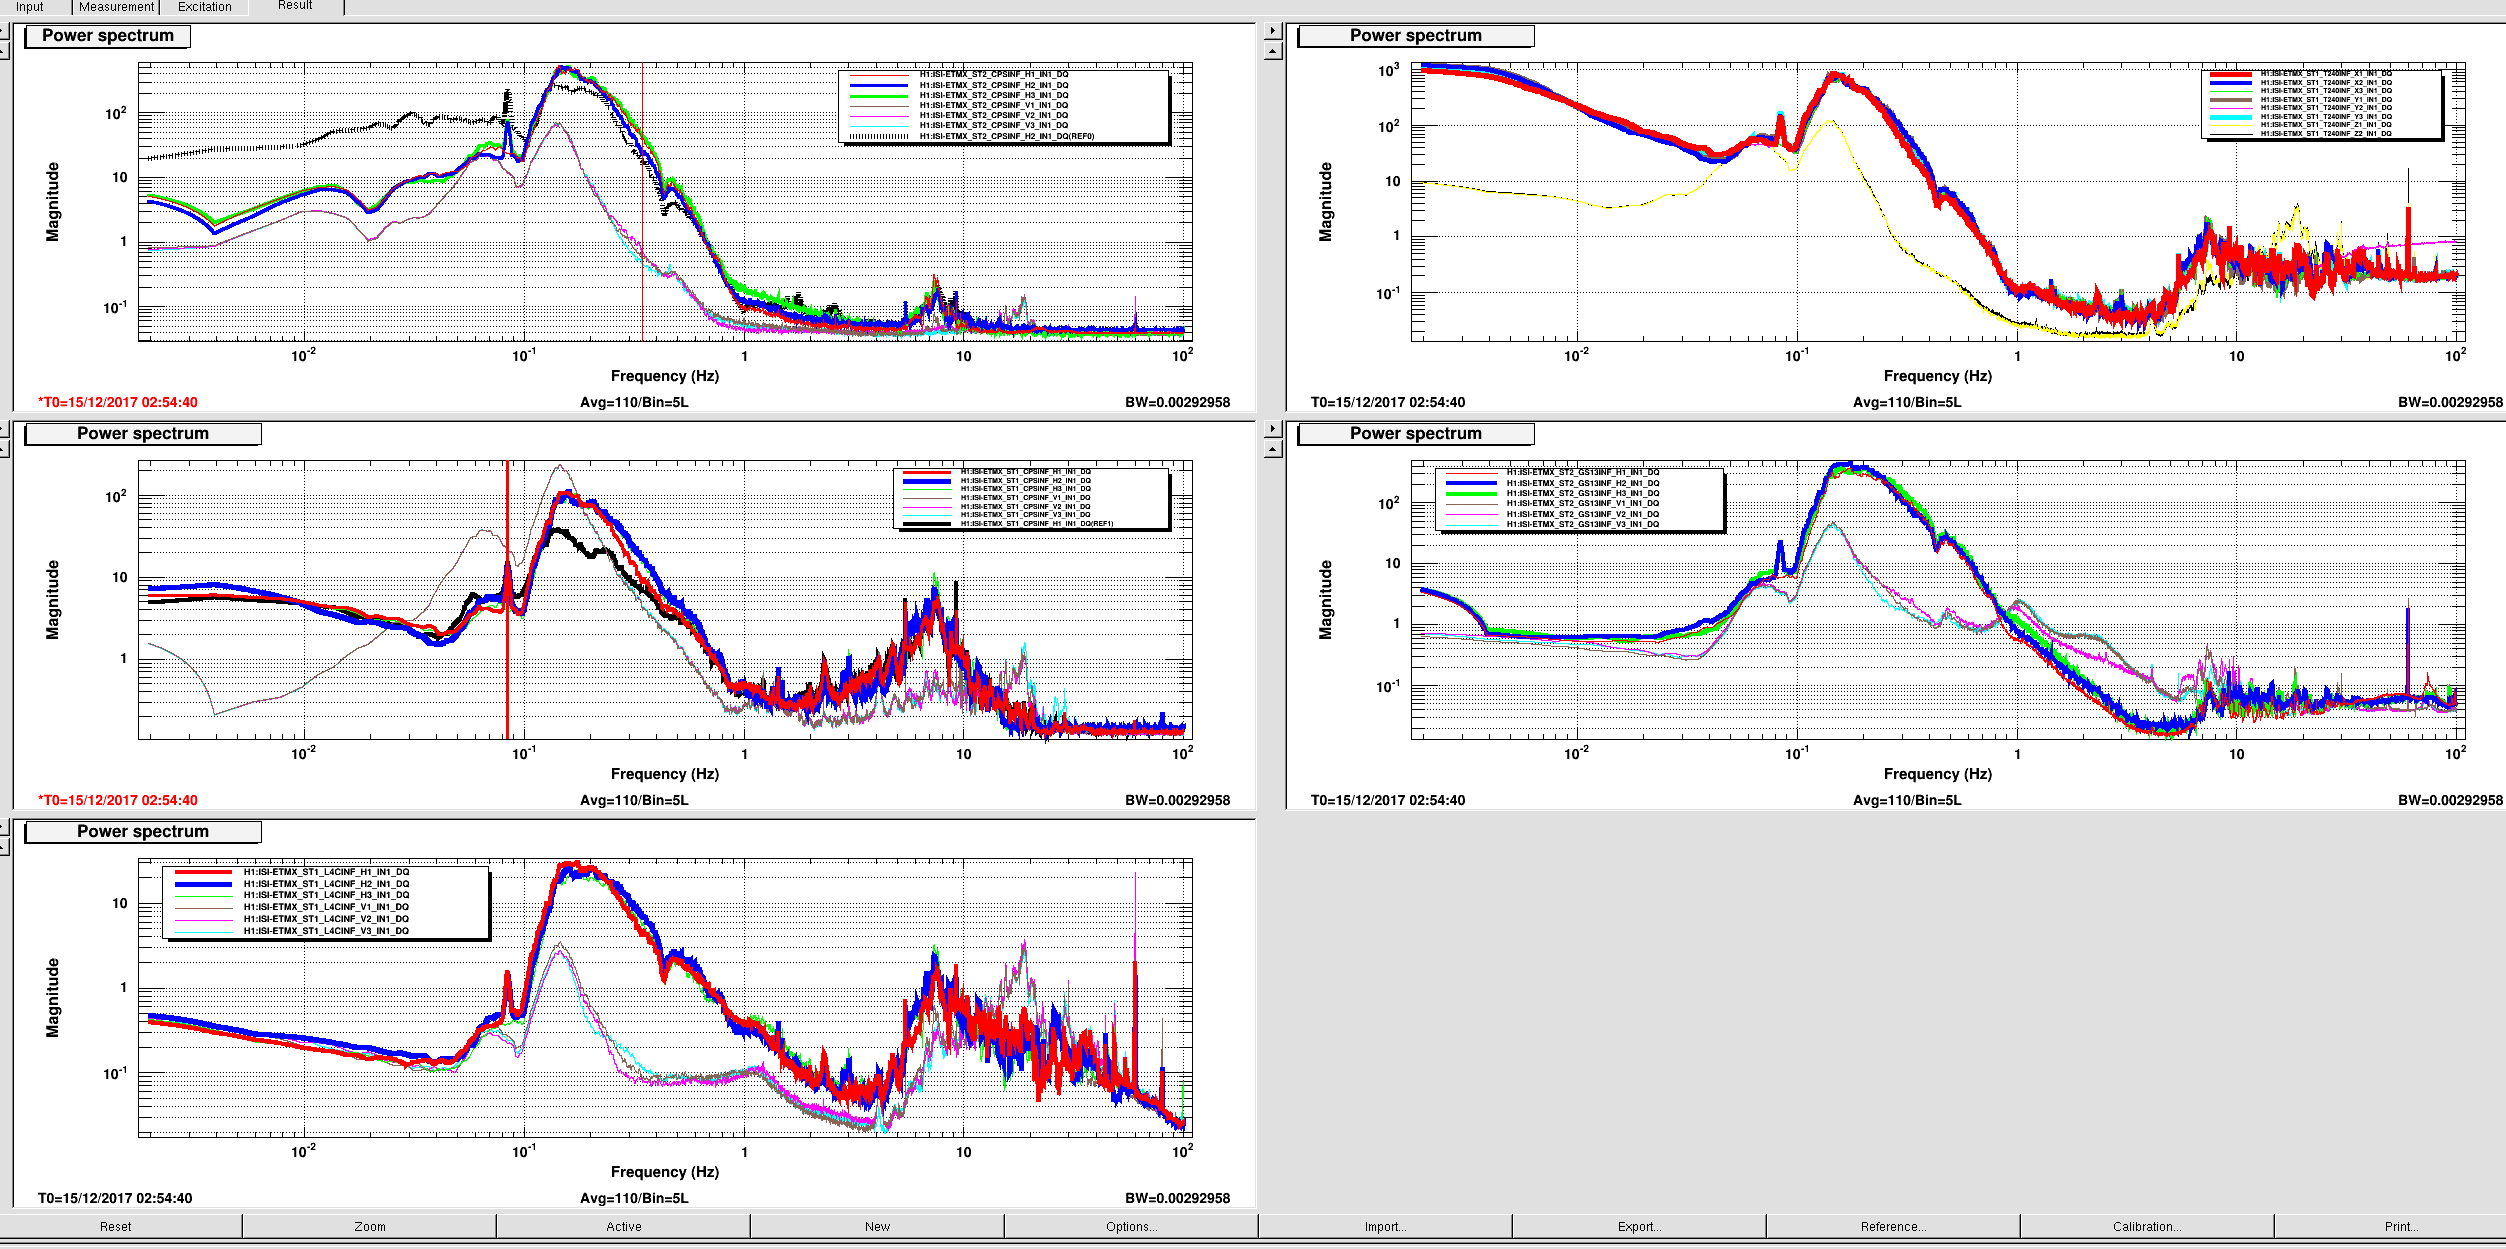
A little documentation, first(only?) plot shows all five sets of ISI sensors and which channels show the 0.085Hz peaks (a close comparison show that they some channels behave differently from the previous plot)
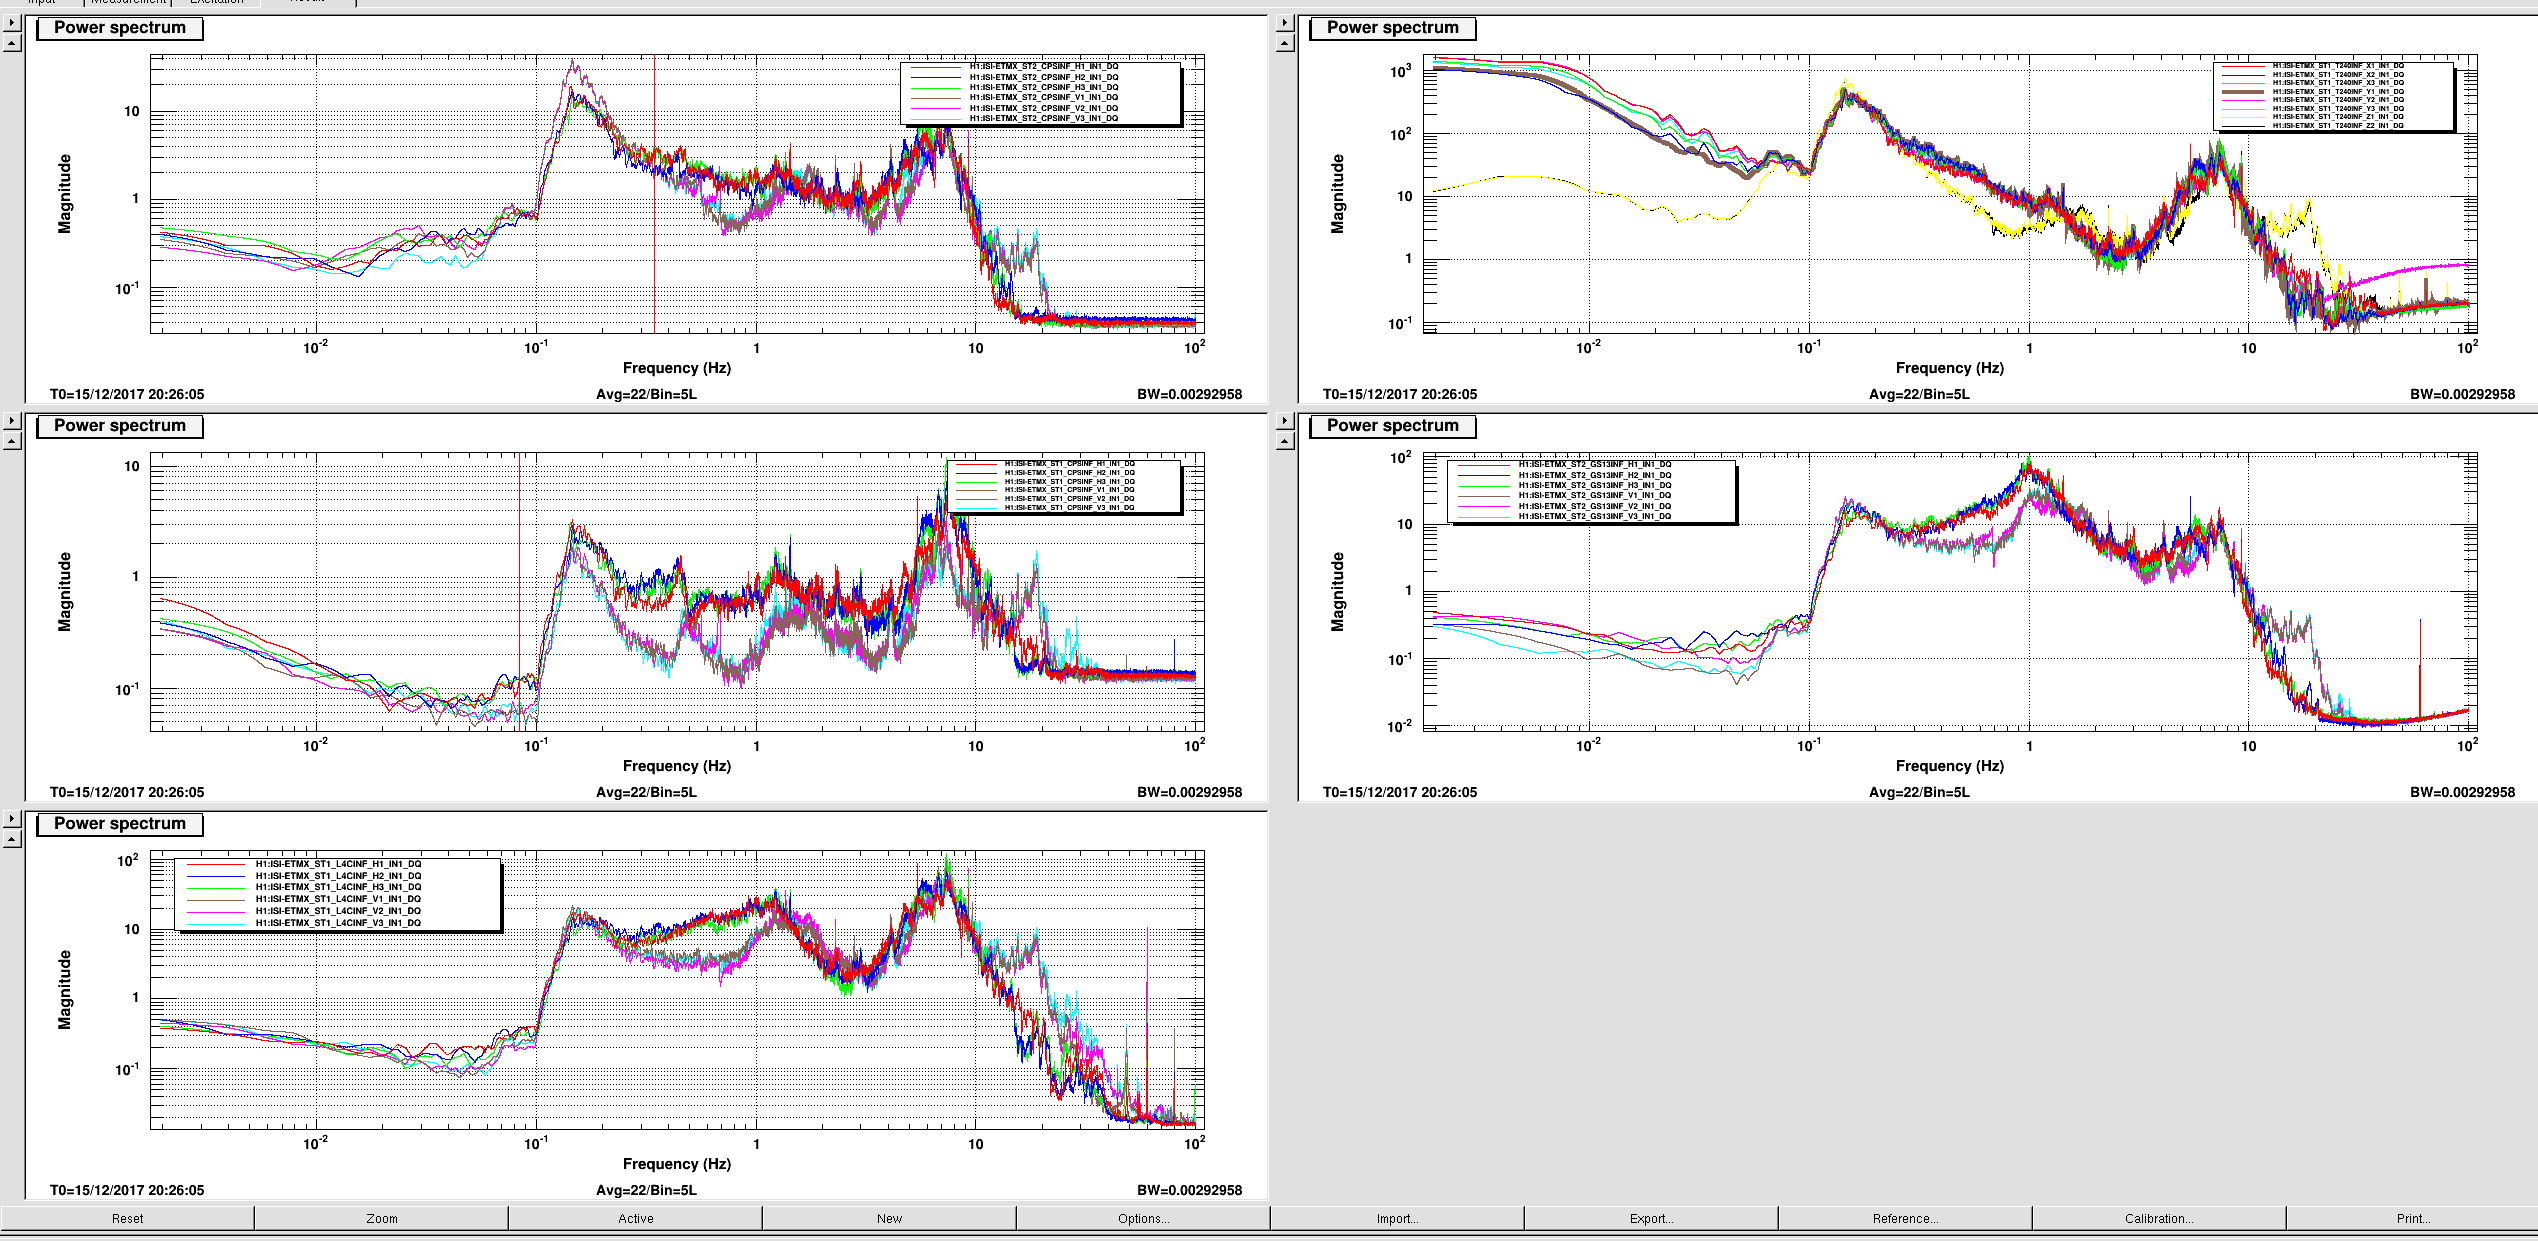
The second plot is with the ISI in damping only, and the 85mHz peak is gone, not really sure what to say
While looking for something else, I noticed that
ETMY had a similar feature at 0.7 Hz in Aug 2016. Jim and Jeff did some work on it.
see alog 28960.
Not sure if we resolved that one, but maybe it is interesting. I log it here so I don't forget.
Never mind - the previous issue was with a Trans Mon Suspension which had been left undamped and caused a feature at about 0.73 Hz. This feature is at 0.085 Hz, not 0.85, so is not related.
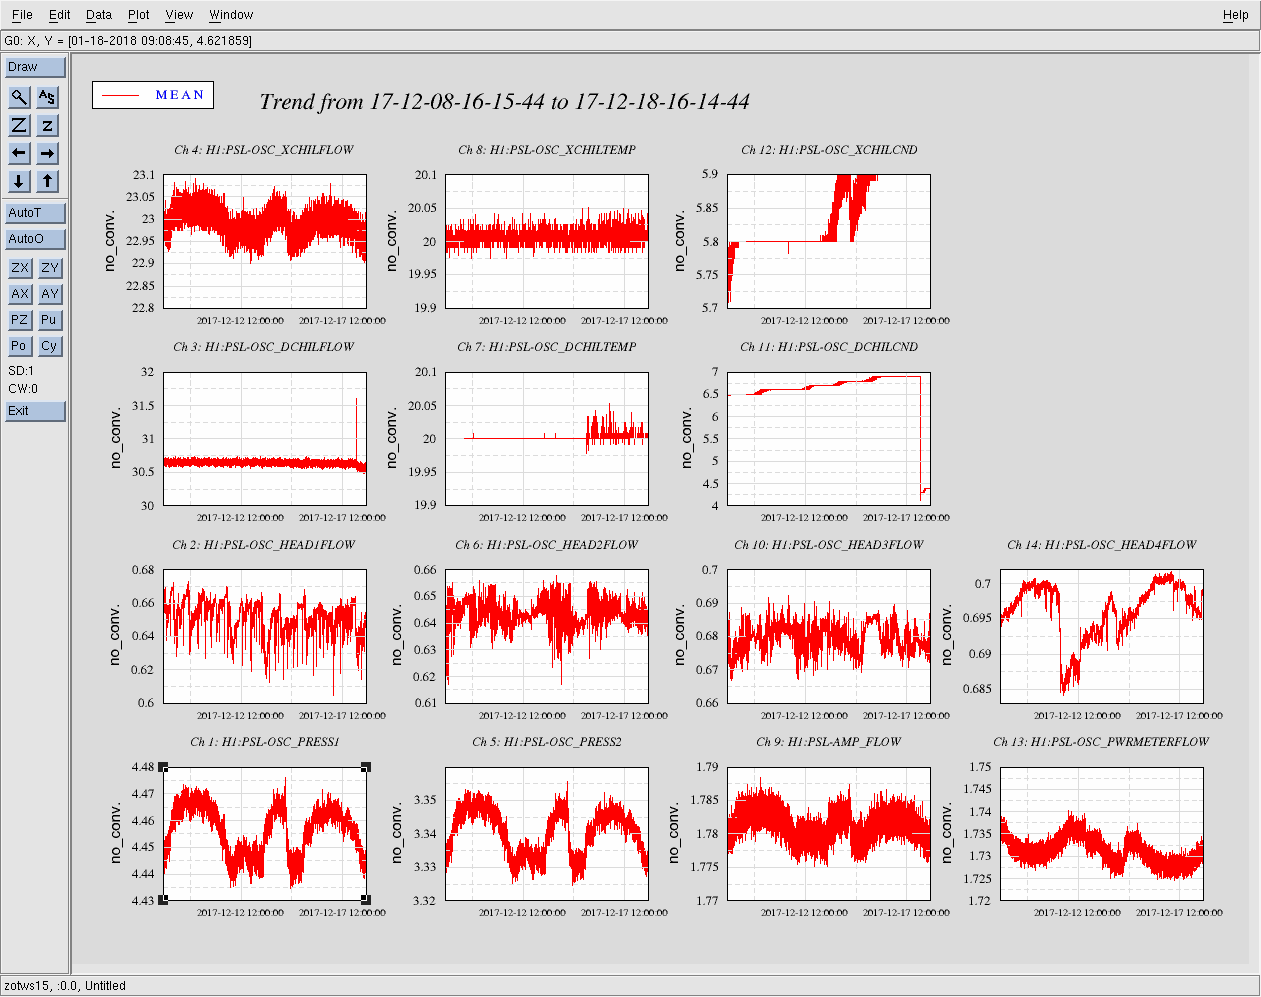
This morning I completed the weekly PSL FAMIS tasks.
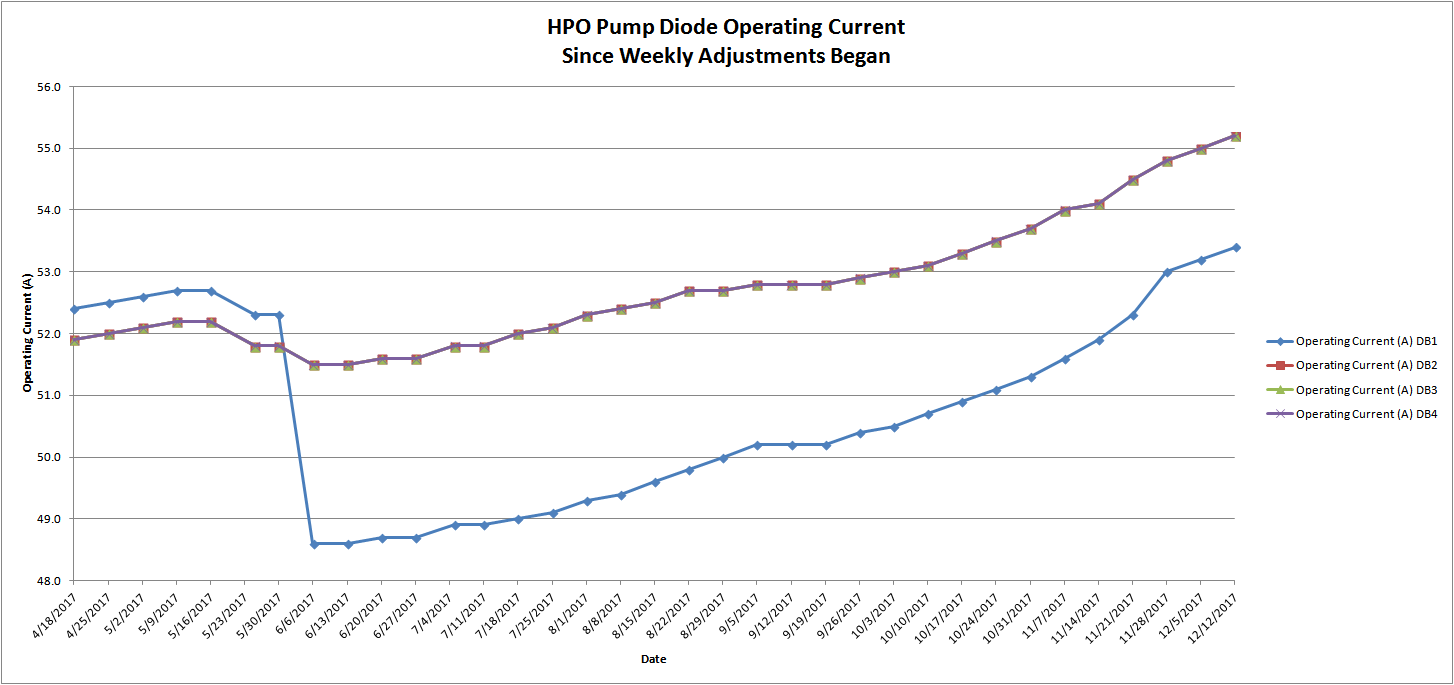
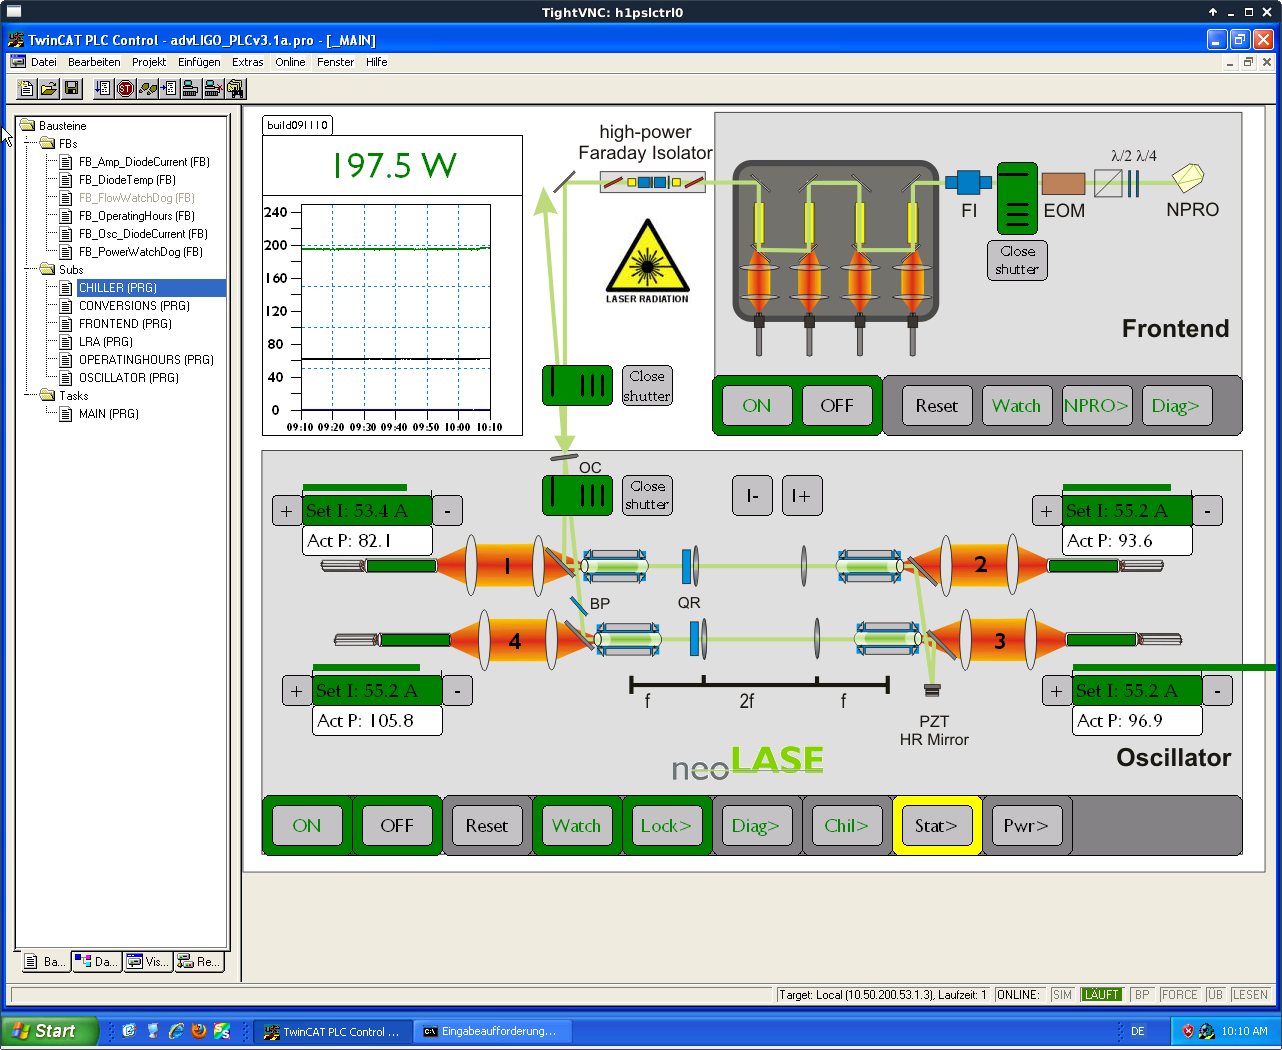
HPO Pump Diode Current Adjust (FAMIS 8452)
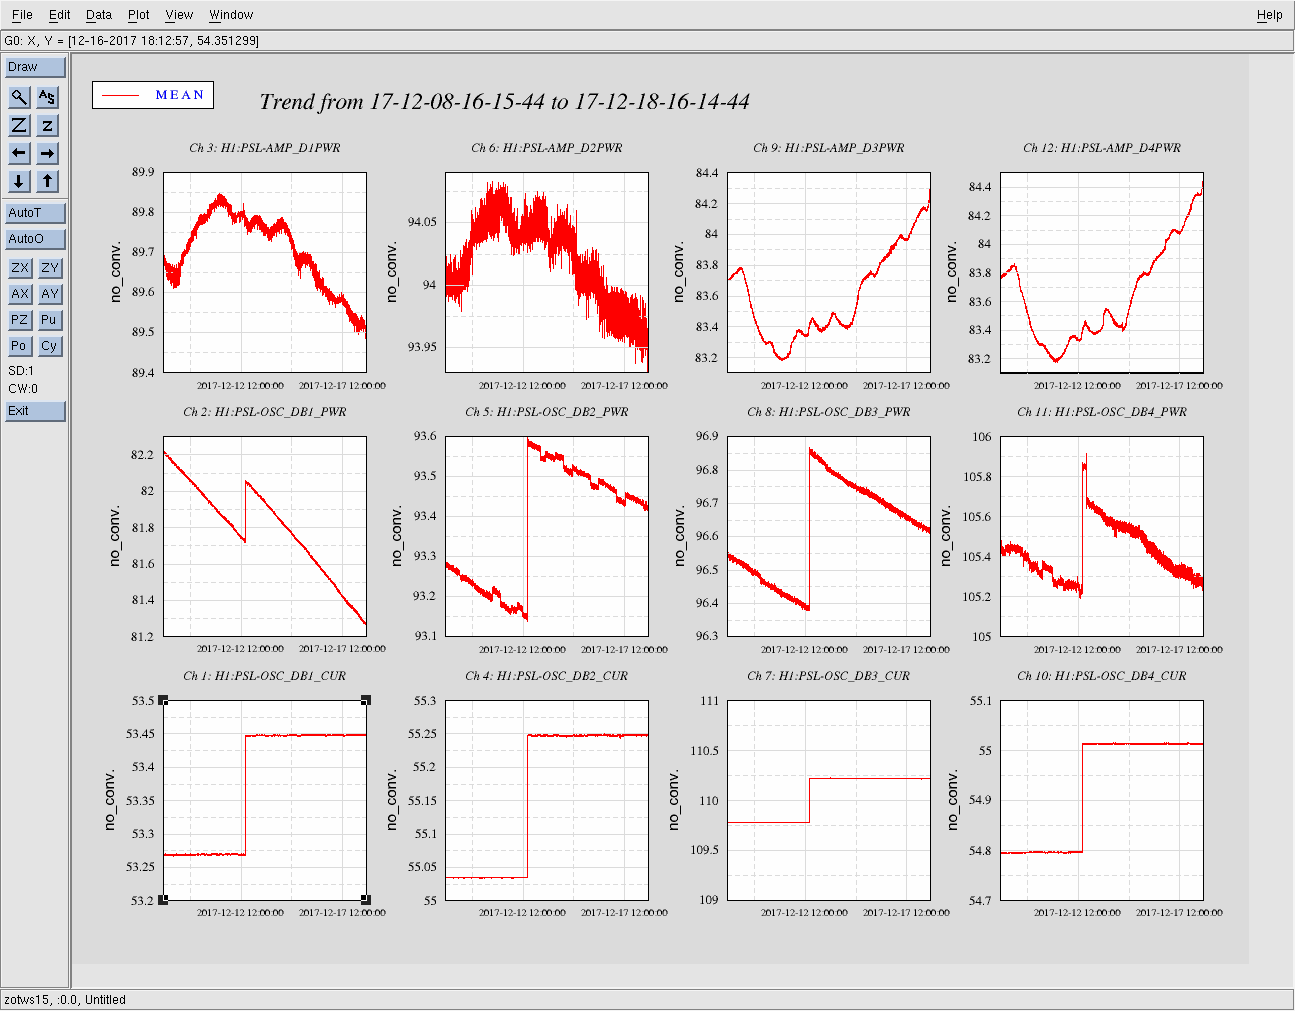
With the ISS OFF, I adjusted the operating current of the HPO DBs. The changes are summarized in the below table, I also attached a screenshot of the PSL Beckhoff main screen for future reference.
| Operating Current (A) | ||
| Old | New | |
| DB1 | 53.2 | 53.4 |
| DB2 | 55.0 | 55.2 |
| DB3 | 55.0 | 55.2 |
| DB4 | 55.0 | 55.2 |
I did not adjust the operating temperatures of the DBs. The HPO is now outputting 155.4 W and the ISS is back ON. This completes FAMIS 8452.
PSL Power Watchdog Reset (FAMIS 4023)
I reset both PSL power watchdogs at 16:55 UTC (8:55 PST). This completes FAMIS 4023.
Attached is the running trend of diode box current increaes since we started weekly adjustments. The large increases required at the end of November seem to have leveled off back to the more normal 0.2 A weekly increase. We are continuing to monitor this.