patrick.thomas@LIGO.ORG - posted 10:10, Friday 01 December 2017 - last comment - 13:18, Friday 01 December 2017(39592)
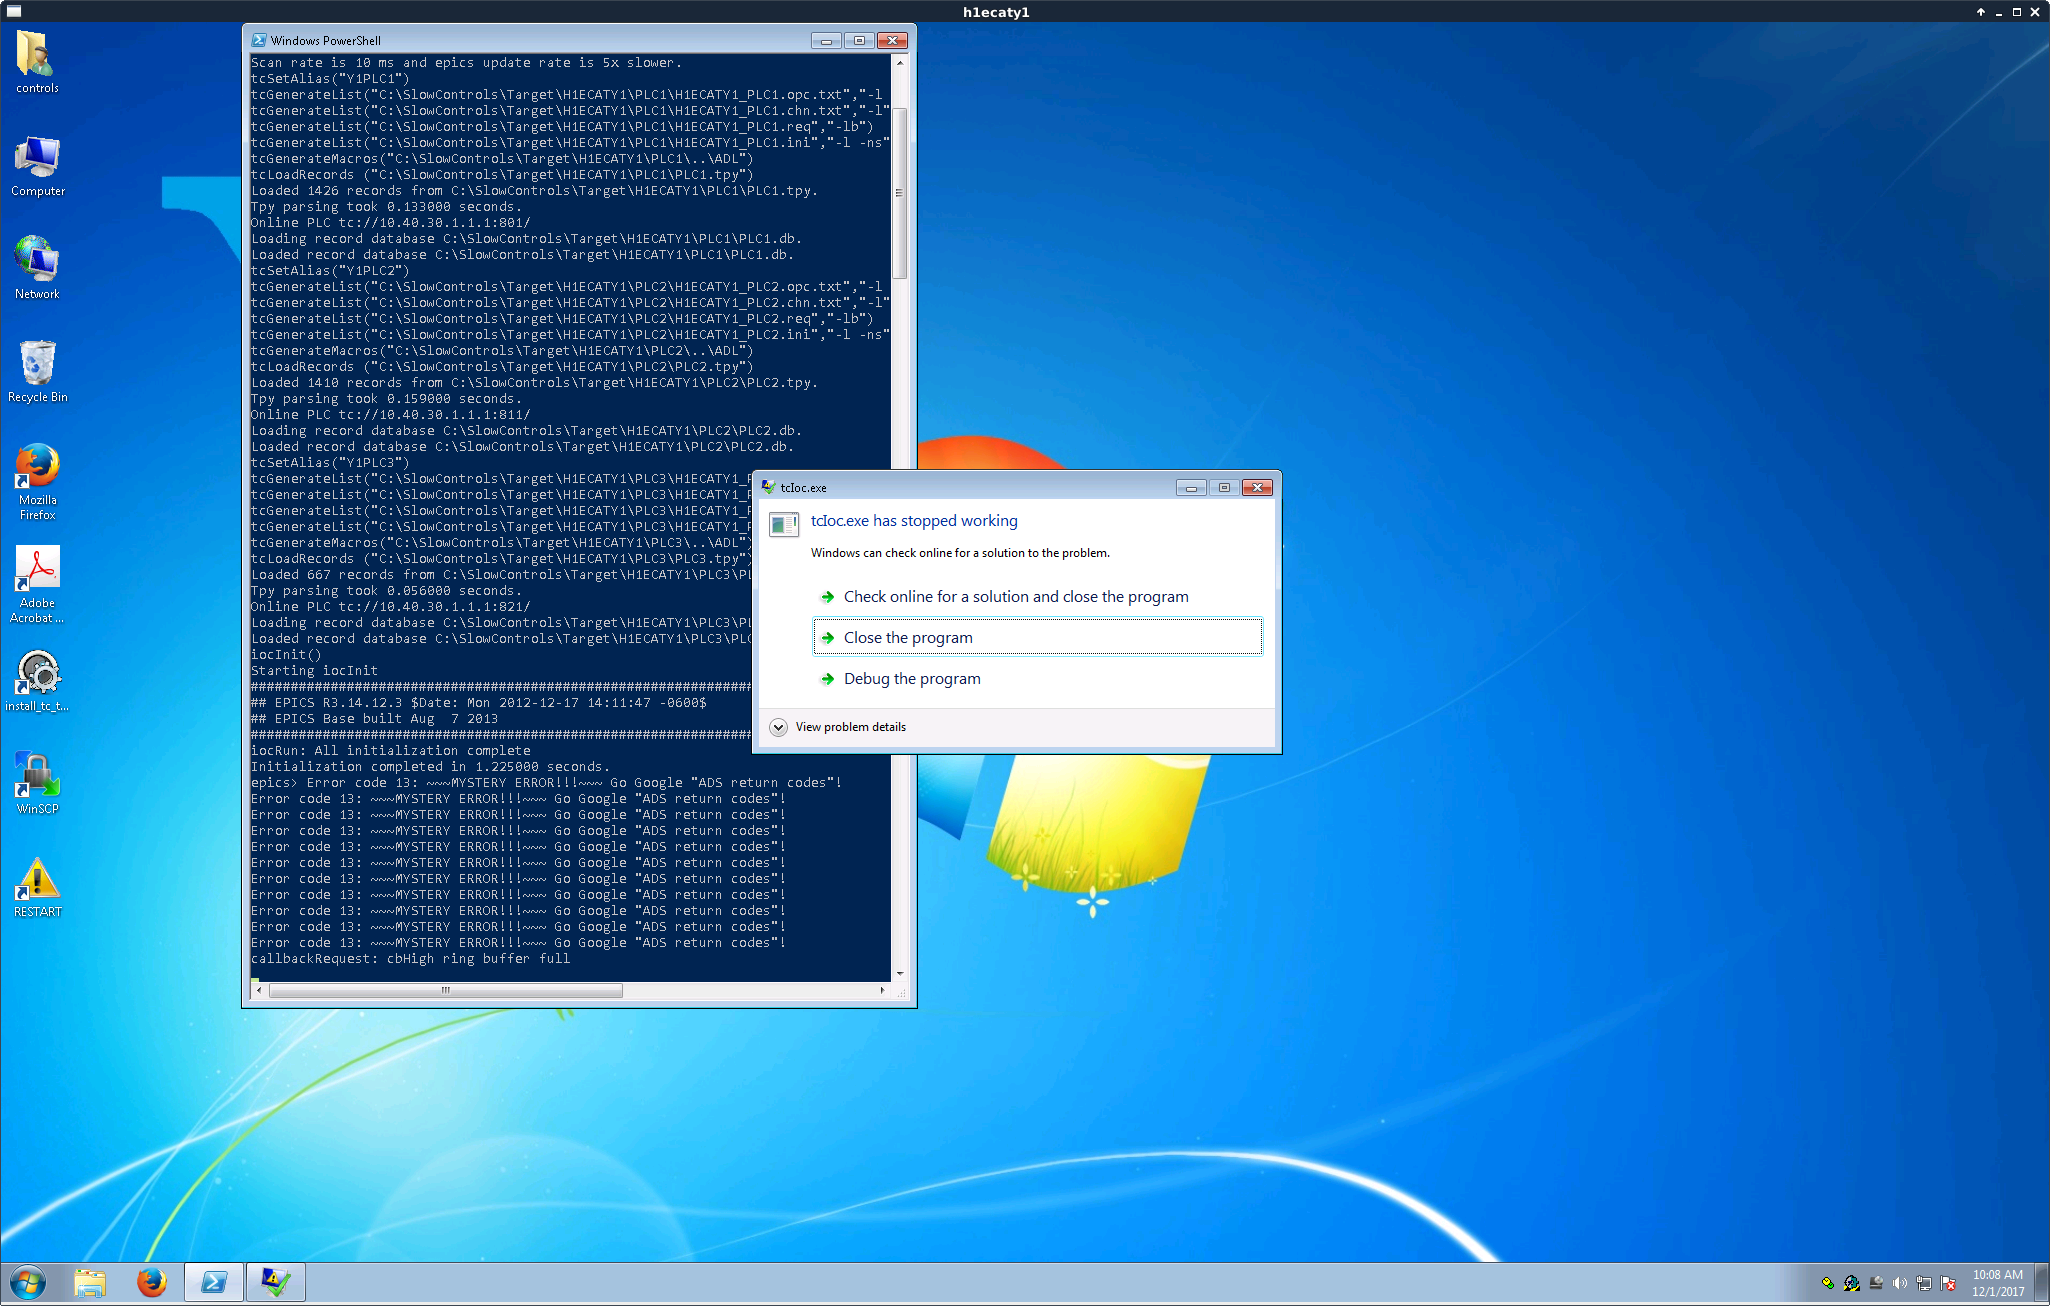
h1ecaty1 IOC crashed, restarted
Screenshot attached.
Images attached to this report
Comments related to this report
FRS 8220
Looking at the screen, I see "Error code 13 ~~~MYSTERY ERROR~~~ Go Google "ADS Return Codes"

So I did. ADS return codes are from Beckhoff - error 13 is "Port Not Connected"
Once the IOCs were started the corresponding SDF systems crashed. This is unusual behaviour, but we have seen it before. I restarted the SDF processes as user controls on h1build
starth1sysecaty1plc1sdf
starth1sysecaty1plc2sdf
starth1sysecaty1plc3sdf
I think we now have a fix for that in RCG 3.4 and beyond. Due to EPICS sequencer changes, I had to re-write the EZCA parts in our front-end sequencer code so they are now robust against the (remote) IOC going offline/online. This will fix the problem when the PSL Beckhoff OPI<->EPICS IOC is restarted, causing the non-real-time part of the PSLISS model to stop. Thinking about this, it may also apply in this case, where we communicate with a remote IOC on the IFO Beckhoff TwinCAT<->EPICS IOCs