The daq was restarted to use the new H1EDCU_ECATC1PLC[1,2].ini files.
Note that channels named H1:PSL-SPARE_QPD_WHITEN_ are now called H1:PSL-BES_A_WHITEN_ (Bulls Eye Sensor channels).
SQZ cable installation for 8/29/2017:
1. Heliax cables were pulled/dressed into racks ISC-C3 & ISC-C4.
2. 4 DC power cables were pulled in from the CER Mezzanine to HAM6 racks.
Further work to be done:
1. Terminate DC and RF cabling
2. Install patch panels in racks.
3. SQZ-R1 rack is missing top lid. Still need to connect DC power junction box and DC power strips.
F. Clara, E. Merilh, R. McCarthy
DCS (LDAS) switched from archiving the raw and aggregated hoft under the O2 location to the postO2 location today at:
1188081664 == Aug 29 2017 15:40:46 PDT == Aug 29 2017 17:40:46 CDT
It will take a little while for the diskcache, LDR, and NDS2 to pick up the change.
This change should be transparent to the control room.
We will continue to save all the raw data, and generate C00 hoft, for
postO2 studies.
TITLE: 08/29 Day Shift: 15:00-23:00 UTC (08:00-16:00 PST), all times posted in UTC STATE of H1: Preventive Maintenance INCOMING OPERATOR: Patrick SHIFT SUMMARY: Current: Timing errors at end stations. BSC5,9 chambers pumping down. Occurred: Fire pumps run. Fire maintenance to work on RFAIR. TMDS at end X. GV20 closed. Pumping back down. Restarted nucs in control room. Two LN2 deliveries. Ryan restarted alog. Filiberto, Ed pulled cables in CER. Marc shutdown EtherCAT chassis 2 in CER to add AnyBus module. Powered back up. Hugh checked CPS boards for ITMX SEI. Hugh surveying. Jim worked on recentering BRSY. Dave powercycled h1susey. Tripped SUS and SEI. GV5 & 7 softclosed for craning cleanrooms. Reopened. TCS laser trips. Restarted. HPO diode power adjusted. PLC code updated on h1ecatc1. EtherCAT card added to h1ecatc1. Timing errors at end stations. Persist. Dick documented RF in LVEA. Carlos and Jonathan rebooted h1hwsex. Paradise H2O delivery. Conlog crashed. Invalid input character to SQL? Restarted. Karen and Christina cleaned. h1seih16 tripped. LX vacuum system accidentally restarted? LOG: TCS laser: X flow alarm 15:04 Fire system maintenance through gate, hydrants 15:05 SC_OFF_NOBRSXY 15:05 Kyle to end X, WP 7119 15:10 Fire department through gate, RFAIR issue 15:12 Restarted nuc5 15:17 Restarted nuc5 15:25 Ryan restarting alog 15:28 visitor through gate to see Bubba 15:30 Jeff B. to check TCS X laser 15:32 Filiberto and Ed to LVEA, pickup test equip, CER squeezer cabling, RF cabling into ISC racks 15:32 Karen to end Y 15:37 Hugh to LVEA, ITMX SEI to ISI_OFFLINE, check CPS boards 15:46 ISI ITMX stage 2 WD tripped 15:48 ISI ITMX stage 1 WD tripped 15:51 Hugh done, staying out for surveying 15:55 ISI ITMX reisolated 15:59 Jim to end Y. recenter BRSY 15:59 Bubba soft closing GV5 & 7, craning cleanrooms 15:59 Marc adding AnyBUS to corner 2 chassis 16:12 TJ, Thomas restarting TCSX laser 16:13 LN2 delivery through gate 16:15 Travis to LVEA, retrieve hardware TJ and Thomas back Jason, HPO diode current adjustment 16:22 Christina to end X, cleaning 16:26 Timing system error (multiple) (Marc has chassis 2 off) 16:33 Chris to LVEA to help Bubba 16:38 Dave to end Y, reboot h1susey 16:40 Travis back 16:51 Dave rebooting h1susey (everything tripped) 17:01 John to end X to help Kyle 17:04 DKT? here to drop equip off for chillers 17:08 Jason done with HPO diode current adjustment 17:11 TJ and Thomas to mezzanine to check on TCS chiller 17:13 Daniel running SVN update on h1ecatc1 17:16 Marc done 17:18 Daniel, Dave powering done h1ecatc1 to add EtherCAT card 17:22 Dick to LVEA, CER, documentation for alog 17:30 Jason and TJ walking TCS chiller lines looking for leaks 17:37 Hugh done, Karen done 17:55 Kyle attaching ion gun 17:57 TJ and Jason back, no leaks found 18:00 Karen to LVEA 18:01 Travis to LVEA 18:02 Carlos and Johnathan to end X, WP 7128, reboot h1hwsex 18:04 Jason to PSL diode room to take pictures 18:07 Travis back 18:08 LN2 delivery 18:11 Jason back 18:13 Untripped ETMY HEPI requested ROBUST_ISOLATED, set back to READY 18:17 Johnathan and Carlos done 18:32 Paradise H2O delivery 19:21 Dick done 19:39 Kyle done prep for TMDS 19:40 Daniel, Jeff, Kyle, Nergis to end X for TMDS 20:04 Chris to LVEA 20:04 Dave to CER 20:05 Restarted conlog 20:58 Hugh to LVEA, surveying Corey to LVEA to help Hugh 21:12 Dave to endY to look at timing 21:13 Travis to LVEA 21:14 Thomas to turn on TCSX 21:19 Corey back. Travis back. 21:31 Restarted CR nucs 21:31 TJ and Sheila back from optics lab 21:42 Bubba opening gate valve 21:49 Pumping down at end X 22:06 Thomas transitioning LVEA to laser hazard 22:54 Filiberto and Ed done
J. Kissel, N. Mavalvala, K. Ryan, D. Sigg, J. Worden Executive / Expert Summary: We've completed our first cycle of the Test Mass Discharge System. We ran into a little confusion when we first started with the TMDS valved into the chamber (around 13:30 PDT) because our clean air flow rate was too low (only ~30 [L/min] or "slm"). With that input rate, our electrometer readings of the ion flow were only ~+/-3 [V], and the pressure inside the TMDS (as measured by the Baratron) only read ~18 [Torr]. However, our patience drove us to investigate when the BSC chamber pressure only was increasing at a rate of [0.1 Torr/ 10 min]. After increasing the clean are input flow rate to ~70 [L/min], we were able to reliably put in +/- 7.5 [V] (we were not able to get as high as the design value of +/- 13 [V]), and pressure in the TMDS came up to near the desired value, around 95 [Torr] (desired value is 120 [Torr]). 
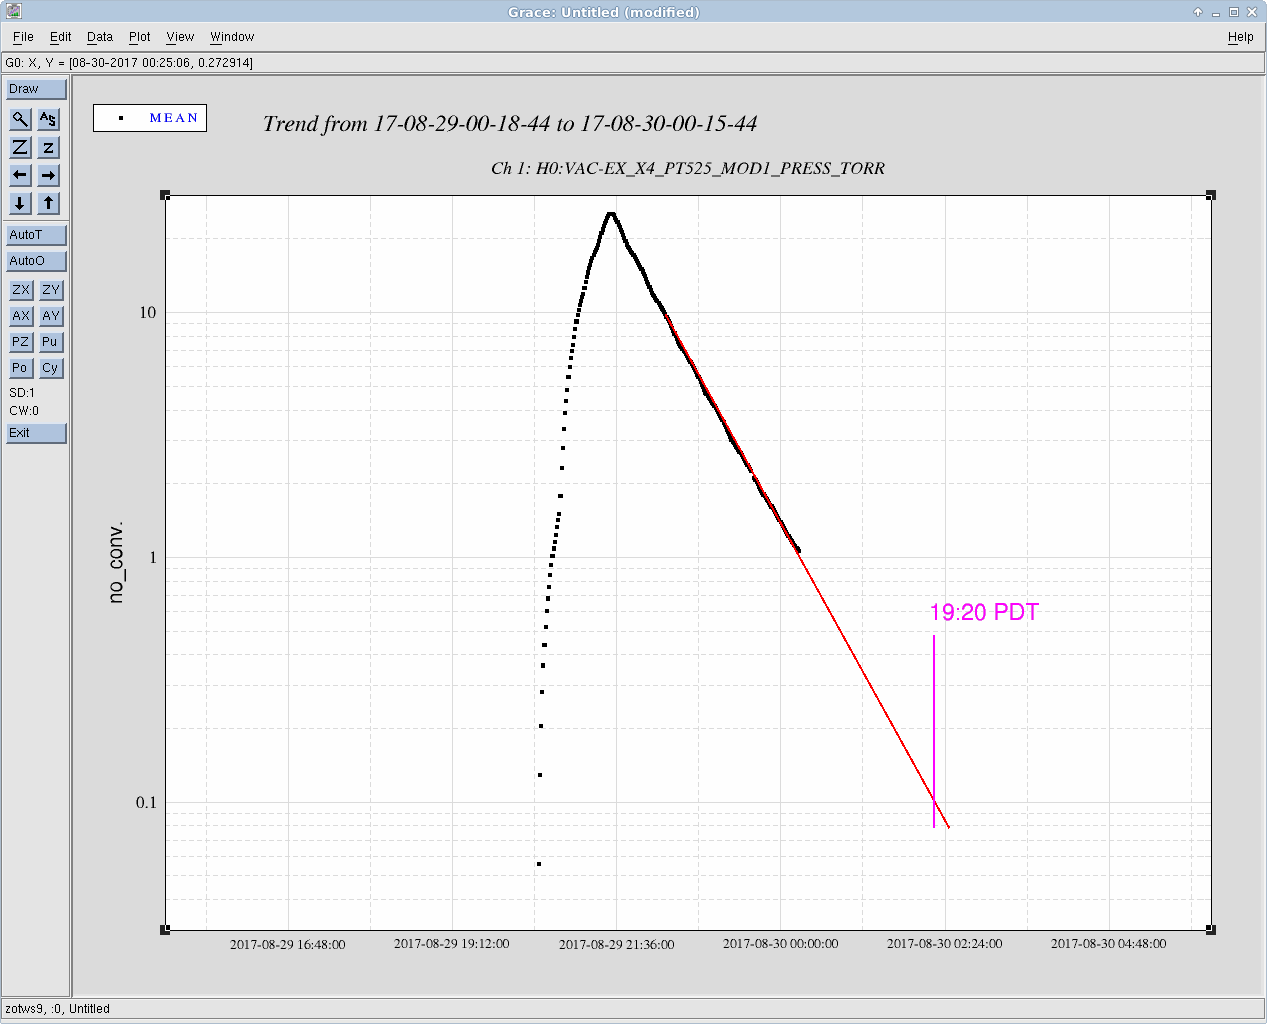
However, even with ~70 [L/min] of ionized gas going into the chamber -- it took us twice as long (about an hour) to reach the desired BSC chamber pressure of 30 [Torr] -- because we have two BSCs worth of volume (BSC9 and BSC5) (obvious in retrospect!). After completing the first cycle (by 14:30 PDT -- note, twice as long, LLO only took ~1/2 hour to get that high), we're now pumping on the two-chamber volume with the QDP80, but it'll likely also take twice as long. We're going to continue to monitor the pressure into the evening, with the hope to get another cycle in tonight. If not -- two cycles tomorrow, one starting first thing in the morning the other mid-afternoon. Right now we're suggesting that gate valves will be open first thing Thursday (but we may get there faster). Details The documentation that proved to be most helpful: T1500057: -v2 of Rai's procedure for operating the TMDS, and associated documentation uploaded from S. McCormick and R. DeRosa's using of the TMDS at LLO. E1500252: Video of Calum and Ben running the TMDS system (valved out of chamber) T1400713: "Final" Design Documentation, Figure 1. Changes in the system since the above documentation: - The electrometer and ion generator are all powered from the TMDS interface, D1500152, and connected to the electrometer and ion generator as shown in LHO aLOG 38358 - Not included in the "final" design Figure 1, but included in Rai's hand-drawn diagram in T1500057 is a temperature controlled heater that's re-heating the clean input air to room temperature after being cooled and filtered by the cold trap. With the input clean air as low as we started out, at 30 [L/min], we did not need to use the heater. However, once we increased the flow rate to 70 [L/min], Future User Guidance (as gleened from documentation and use of the system by Daniel and Nergis): - Step 12 of T1500057 is the most exciting part, and the paragraph is pretty loaded. One of the more important sentences is "Reduce the amplitude of the square wave [fed to the electrometer] to 2 Vpp, and leave this value for most of the filling. Occasionally raise the square wave voltage to 25 Vpp and note the +/- ion current." What Rai's elluding to: The electrometer is measuring the ion current (converted into voltage by a resistor). However, the higher the amplitude of square wave, the more ions are being sucked into the electrometer to be measured. That means less ions are getting into the chamber. So, one should - Before the TMDS is valved into the chamber, constantly "measure" the ion current (once at the desired clean air input flow rate) with a high square wave amplitude (say the max, 25 Vpp), while turning up the HV VARIAC knob, watching the HV readback of the ion generator to ensure you're just at the border line of major distortion of the HV waveform (some small amount of distortion is OK -- we want the most amount of ions going into the chamber as possible). The ion current (voltage) from the electrometer should show *roughly* equal +/- voltage. Both Ryan's results (see LLO aLOG 35636), and our experience shows that one cannot get a perfect balance; a deviation from perfect of ~0.5-1 [V] / ~10 [V] = 5-10% is OK. - Just before valving into the chamber, turn down the square wave amplitude to something low -- 2 +/- 0.5 [V] is fine, no need to be more precise. Once you've turned down the square wave amplitude, the measurement on the electrometer degrades, so you'll see a reduction of ion current (voltage), and likely the imbalance of +/- will increase or change. This is OK, you're just trying to back the electrometer out of the way, and let all the charged ions go into the chamber. - Now Rai's second sentence, and Ryan's data makes more sense. Every once and a while (every 10-15 minutes, or at your favorite increment of pressure), bring the amplitude of the square wave back up, and measure the ion current (voltage). This is just a double check, to make sure that your ion current is still balanced, and you're still sending in (roughly) equal number of positive and negative ions - Before doing anything, Kyle had turned off all high-voltage power supplies to anything in-and-around the chamber. Good. However, as a triple layer of precaution, we should also make sure that we're not requesting any digital high-voltage. As such, in the future, operators should - Bring the QUAD's ESD Bias Voltage to Zero - Reduced the requested Ring Heater power to Zero - Turn off any suspension alignment offsets (though it's nice to leave the suspensions damped -- don't forget about the TransMon / TMTS) - Turn off / disable the in-vac pico-motor control - Make sure that the transmon pico motors are disabled. - 4 Piezo controllers are on the ISCT EX / EY for the green WFS centering, and centering the green input onto the TransMon QPDs. Since these are external to the chamber, you don't *have* to turn them off, but we don't need them, so might as well.


I went to try to recenter BRSY today, but I had little luck. Looks like it's sitting in another difficult spot. I spent 5 hrs trying to recenter and barely out of range is the best I could do. It will drift further out of range as the box heats up again. I've left the damping off on the BRS and have turned off the outputs on the sensor correction paths that use the BRS. Right now, this probably won't prevent locking, but if someone tries to turn on the sensor correction at EY it will trip the ISI, as seems to have already happened once today. I've left the outputs of the appropriate sensor correction banks off, so please talk to me before "fixing" the ETMY ISI SDF or trying to change the ISI's controls configuration. I need a day to recover enough to try again, so I'll see if I can make another attempt on Thursday.
It looks like cabling work in the CER accidentally glitched the timing for h1seih16 (its at the end of the row of racks). I have restarted all the models on this front end computer.
These ringdown measurements, of the LHO QUAD suspensions violin mode 4th and 5th harmonics, were obtained 2 days after the big Earthquake hitting LHO on the 20170706. For this analysis I used 17 hours of detector data in Low noise state from "20170708 06:30:00" UTC. None of the 4th and 5th harmonics were being actively damped or excited. Although clearly the Earthquake excited these harmonics well enough to get very nice ringdowns.
In this analysis, a line tracker (iWave) was applied over each of the identified 4th and 5th harmonic frequencies, locking onto them.
I give next the results for those frequencies that show ringdowns. I also attach 'png' plots which shows; in each column the mode monitored with the top plot being the frequency tracked as a function of time, the middle plot is the 'log(Amplitude)' (natural logarithm of the mode's amplitude). The red dashed lines are respectively the median of the tracked frequency and the fitted first order polynomial to the 'log' of the mode's ringdown. The plot at the bottom shows the Phase deviation respect to the linear fit.
4th Harmonic
Mode frequency (Hz) Q
1924.678 795280070
1924.919 940157702
1926.236 1013199693
1927.462 963907721
1929.327 590576596
1931.569 1022004204
1932.15 890355597
1932.331 985512132
1932.623 946775350
1941.352 838872691
1942.129 808459376
1942.178 1140538266
1942.384 806784836
1946.727 1153580301
1947.704 1078584113
1954.459 778605954
1956.503 788173599
1957.333 847485779
5th Harmonic
Mode frequency (Hz) Q
2373.487 431860210
2374.656 495634311
2381.893 719623590
2382.987 638328976
2385.441 691971670
2386.924 767976787
2398.523 791021530
2398.529 761223997
2399.509 843982379
2400.302 746568211
2404.642 860932811
2405.621 807844171
2406.763 630423384
2407.992 880751631
2409.266 617892329
2410.265 819561647
2411.371 789591091
2414.764 827720300
2415.259 860571672
2419.552 603552195
2424.416 575422358
2427.241 672293500
2428.109 789905044
These results show that exciting and measuring the Q of higher order harmonics is possible. If we are able to identify these higher order harmonics with specific fibres then this information could be used to enhance suspension thermal noise characterisation.
The plots of the OpLev 7 day trends are attached. All look OK, except ETMX Pitch, which is approaching -10, down from 0 a week ago. Closinf FAMIS #4742
Concur with Jeff, all looks normal.
Found the water level on TCS-Y chiller to be just above the zero level. I added 1420ml to bring up the water level up to the 3/4 level. Before today, water added was 40 days ago. TJ and Jason checked the system lines and found no apparent leaks. TJ is going to take a look on the table.
When TJ and I went out to check on the chillers around mid-morning, I added an additional 750 mL of water to the chiller. This was added due to an air bubble under the mesh screen filter giving an incorrect reading of the chiller fill level; I released this bubble and then filled with water to the mark Jeff had filled to earlier in the morning.
The machine h1hwsex was pinned to run kernel 3.19.49 which is the newest kernel that successfully work with the hws camera, previeusly it was trying to run 3.19.78 on boot, but we removed that option from Grub. see work permit number 7128
WP7127 Daniel, Dave:
we powered down h1ecatc1, installed a second ethernet PCIe card in the second slot down on the full card size side, and powered the computer back up.
WP7126: Dave:
The BIOS setting on h1susey was modifed in an attempt to stop the periodic ADC glitching seen on these faster computers. Gerrit at AEI discovered that disabling the 'turbo' cpu mode fixed the glitching.
The BIOS path to the relevant screen is Advanced -> CPU Configuration -> CPU Power Management Configuration
The 'Power Technology' item was changed from 'Max Performance' to 'Disabled'
Before this change both h1susex and h1susey were glitching (approximately several times per day), now hopefully h1susey will stop glitching.
Unfortunately, even though I manually took h1susey out of the Dolphin fabric, and ran its power off script, it still glitched the EY Dolphin on restart. All models on h1seiey and h1iscey needed to be restarted. For now on we will assume this glitching can happen and put SEI into its SAFE state before rebooting SUS.
The CPU usage of the models running on h1susey are shown in the second trend plot attached (two hour trend, BIOS change in the middle). The IOP model (Ch 3) does not show any change. SUSETMY (Ch 4) is running 2uS longer (33uS to 35uS). SUSTMSY (Ch 5) is running 1uS longer. SUSETMYPI (Ch 6) is running 1-2uS longer.
All are well within nominal range.
Laser Status:
SysStat is good
Front End Power is 33.8W (should be around 30 W)
HPO Output Power is 154.8W
Front End Watch is GREEN
HPO Watch is GREEN
PMC:
It has been locked 14 days, 1 hr 23 minutes (should be days/weeks)
Reflected power = 16.87Watts
Transmitted power = 57.1Watts
PowerSum = 73.97Watts.
FSS:
It has been locked for 0 days 1 hr and 12 min (should be days/weeks)
TPD[V] = 1.446V (min 0.9V)
ISS:
The diffracted power is around 3.2% (should be 3-5%)
Last saturation event was 0 days 1 hours and 12 minutes ago (should be days/weeks)
Possible Issues:
None
This closes FAMIS7453
Jason O., Thomas V., TJ S.
TCSX chiller tripped at Aug 29 2017 11:21:40 UTC (1188040918 GPS). Flow rate only dropped to ~2.55gpm, this should not trip until 2.0gpm. See attached.
This 2.0gpm limit is set analog via some resistors in the controller. The plan, sometime in the future, is to test this controller and make sure that the resistance is what it is suppose to be, and then fix/replace if necessary.
Thomas and I went out to the LVEA to reset the interlock and it came right back. Verbal briefly complained that it had turned off a few minutes after we got back, but it seems that it just lost lock briefly and the power fell low enough that Verbal caught it. Everything seems okay now.
Yes it sounds like the right plan is to pull that controller and test it. If we can check what voltage/current causes the controller to trip, then we can check that against the flowmeter setting (which should be in current per gallon per minute).
I have compiled the results of in-air measurements during installation and in-vacuum measurements from the alogs; 14231 LLO (including corrections mentioned in alogs 21652 and 27901) and 17610 at LHO (including corrections mentioned on the comments).
In the case when a frequency split is shown on in-vacuum measurements we have taken the average of both frequencies. I have grouped these numbers per front and back fibres, then per test mass and then per detector, finally I obtained the difference as (in-vacuum – in-air) including the sign:

We notice that in most cases the frequency difference is always positive, so frequency increases when moving the suspension to in-vacuum.
The increase in frequency is always a few hundred mHz (mean of 0.3Hz and median of 0.4Hz), with a clear outlier on LLO_ITMY_FL (which as explained here seems to be involved with uncertainty in the identification).
There is not clear difference in frequency variation between front and back fibres (especially no sign difference) which would indicate pitch effect.
However, notice that as per the Technical document T1700399 the expected increase in frequency due to buoyancy is of 0.14Hz, and the variation in frequency due to pitch angles of 2mHz is of 0.33Hz (although that would be an opposite sign change between front and back fibres). Therefore while the observed changes cannot be explained through pitch and buoyancy alone, they are of the same order.
Further discussions on the results presented here has led to realize that the in-air measurements of the violin modes fundamental frequencies have a potential error of about 0.25Hz (as an example here are measurement results for LHO ITMX suspension). In base of this and to better understand the actual differences between in-air and in-vacuum measurements, now that we have very accurate measurements in-vacuum, it would be informative to measure in-air values once the suspensions are taken out.
The in-air measurements have so far been done by acoustically driving the violin mode resonances. During this measurements the frequency of the driving acoustic signal is changed as a sweep sine. Because the in-air Q of the violin modes is considerably less than the in-vacuum values of 1 billion, if the sweep sine drive is not done with suitable slow pace then the observed a violin mode excitation at a frequency on the sweep sine which actually correspond to a previous frequency of the sweep but took some time to ring up. Under this assumption, if the sweep sines were driven down (from high frequencies to lower frequencies) then there would be a consistent error on the measured in-air frequencies with values being lower than in-vacuum ones.
A way to improve the acoustic excitation could be by building a tower of speakers so that they could inject more energy into the violin modes of the fibres. Also be sure to drive the sweep sine at enough low pace or inject random noise excitation instead. Finally a lot of information could be gained by in-air measurements of higher order harmonics, this would help on characterization and understanding of higher order inharmonicity as well as higher order mode identification.
In order to proceed with the in-air measurements of the violin mode and its harmonics during the installation of the suspensions in the near future (as well as measuring the already install suspensions once removed), we have built in Glasgow a line array of 24 speakers of 60 cm length to match the length of the fused silica fibres. Its lightweight and compact design make it suitable to locate it parallel and in close proximity to the fibre that wants to be excited.
This line array produces considerable sound from 300Hz and well above several kHz making it suitable to excite the fundamental mode and up to the 6th harmonic and beyond.
A more complete description can be found on the technical document T1700414T1700414.
It is relevant to this alog to remember that while preliminary FEA modelling of the actual fibre profiles measured during installation of the LHO ITMX suspension (end of March 2014), has been used to predict in general terms the observed departure of the frequencies of the violin mode harmonics from whole multiples of the fundamental (“inharmonicity”):

However this preliminary results show that this prediction is not yet accurate to the few Hz level required for identification:

In order to complete the list of possible causes for the different inair and invacuum measured violin mode frequencies, I add next the contributions suggested recently by Norna, Dennis and Jon Feicht:
Violin modes frequency variations due to air damping
Air damping lowers the in-air measured violin mode frequency by a value inverse proportional to the violin mode’s Q-factor. Such that the maximum frequency for a damped oscillator (fm) is related to the undamped maximum frequency (f0) by:
fm = f0 ∙ sqrt[1-1/(2∙Q2)]
A quick look at recent in-air measurement on the LHO alog 38743 suggest a Q of at least 100 in-air at the ~ 500 Hz fundamental mode. This would give a in-air measured frequency value of the fundamental of 0.012Hz lower than in-vacuum.
Violin modes frequency variations due to mass/length of the fibre decreasing as the water desorbs from the silica fibre in vacuum
The mass loading on the fibre, due to water adsorption in-air, should in principle cause the in-air measurement of the violin mode fundamental frequency to be lower than in-vacuum, as once much of the water is pumped off the fibre in vacuum the frequency should increase. Dennis Coyne calculated that about ~3500 monolayers of water (each 2.5 angstroms thick) would be necessary to cause a 1 Hz shift at 500 Hz, due to mass loading alone. It is commonly asserted in vacuum literature that stainless-steel surfaces of a vacuum system exposed to air can start with "hundreds of monolayers of water".
However fused silica is hydrophilic and the interaction of silica surfaces and water is complex; Surfaces of silica under water can swell and form layers of silica gel1. The modification of the fused silica surface by the chemisorption and physisorption of water may even lead to a reduction in the elastic modulus of the fused silica in the outer layers.
References
[1] V.V. Yaminsky, et. al., "Interaction between Surfaces of Fused Silica in Water", Langmuir 1998, 14, 3223-3235.