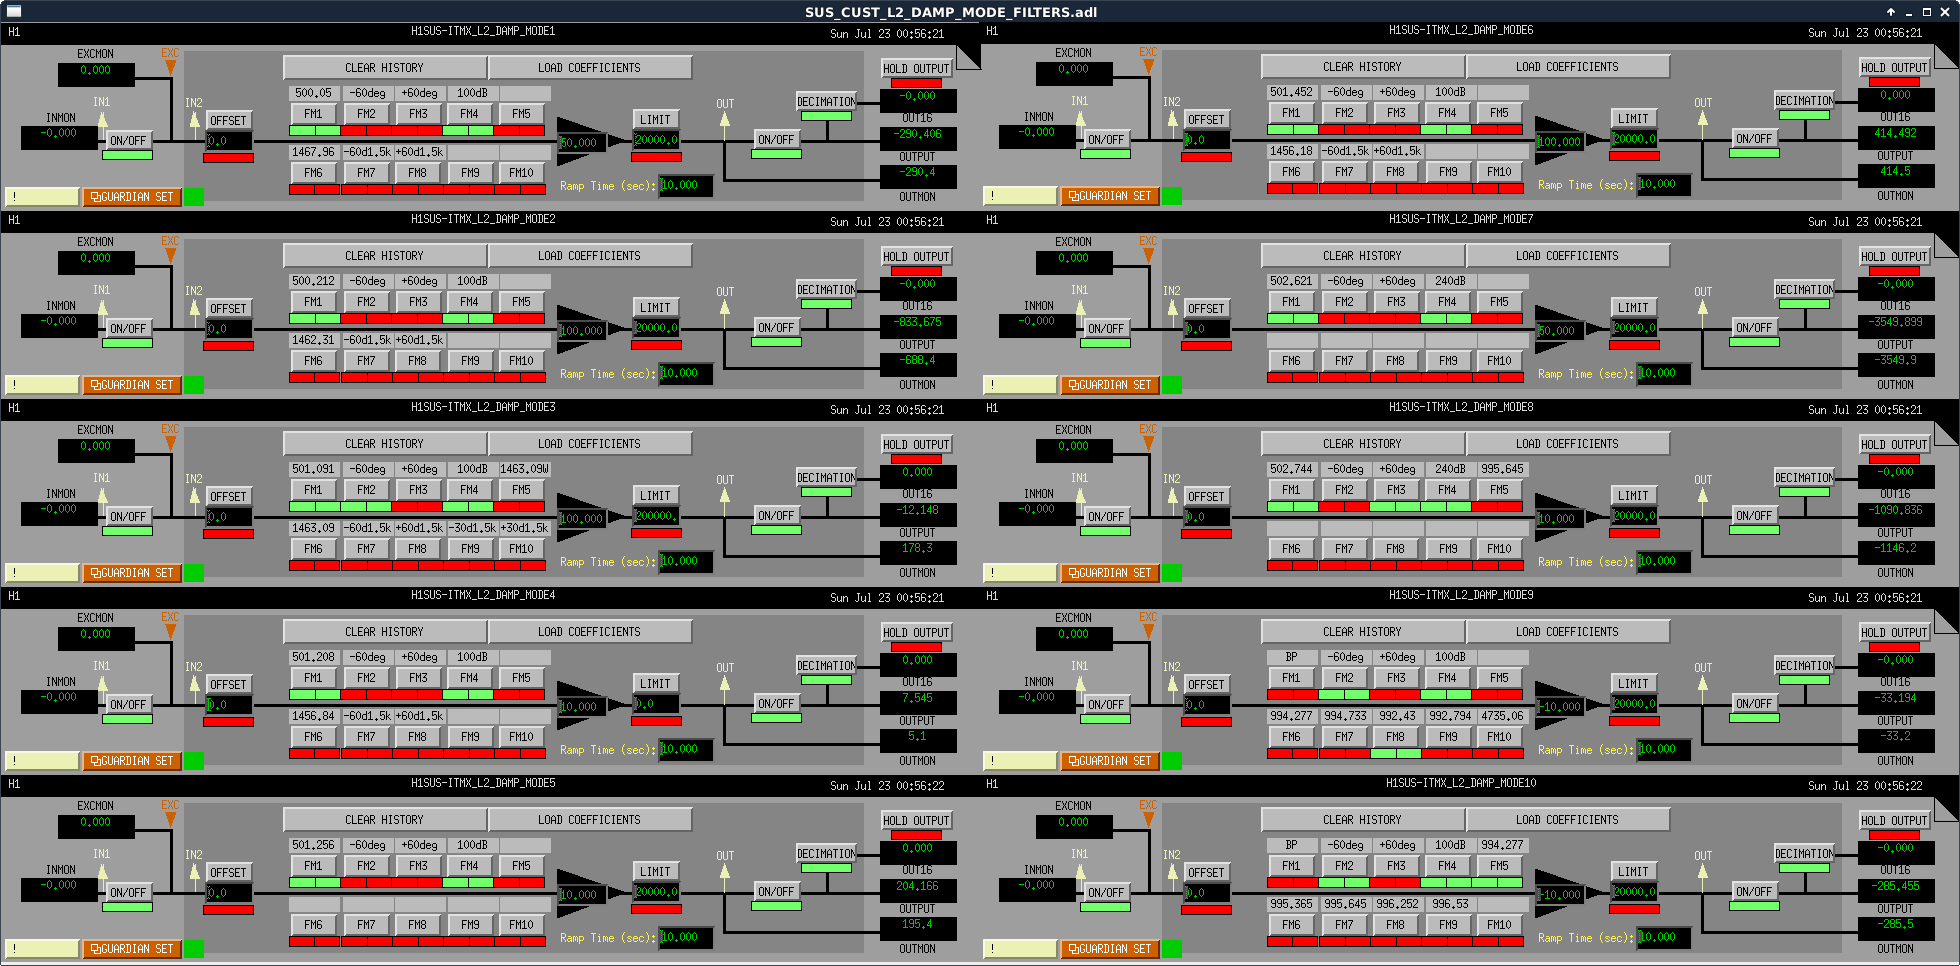
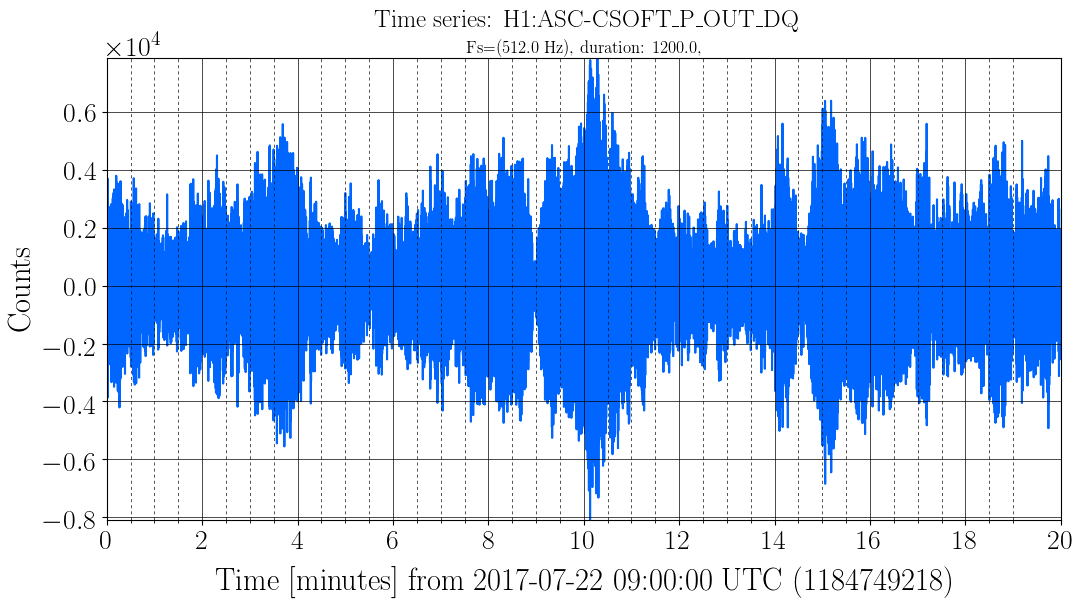
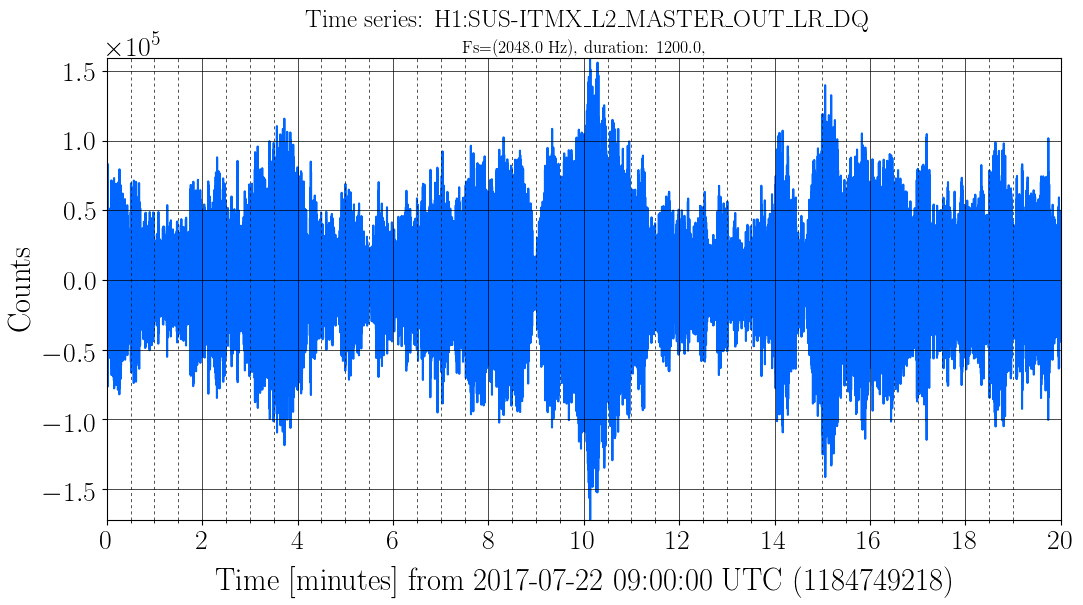
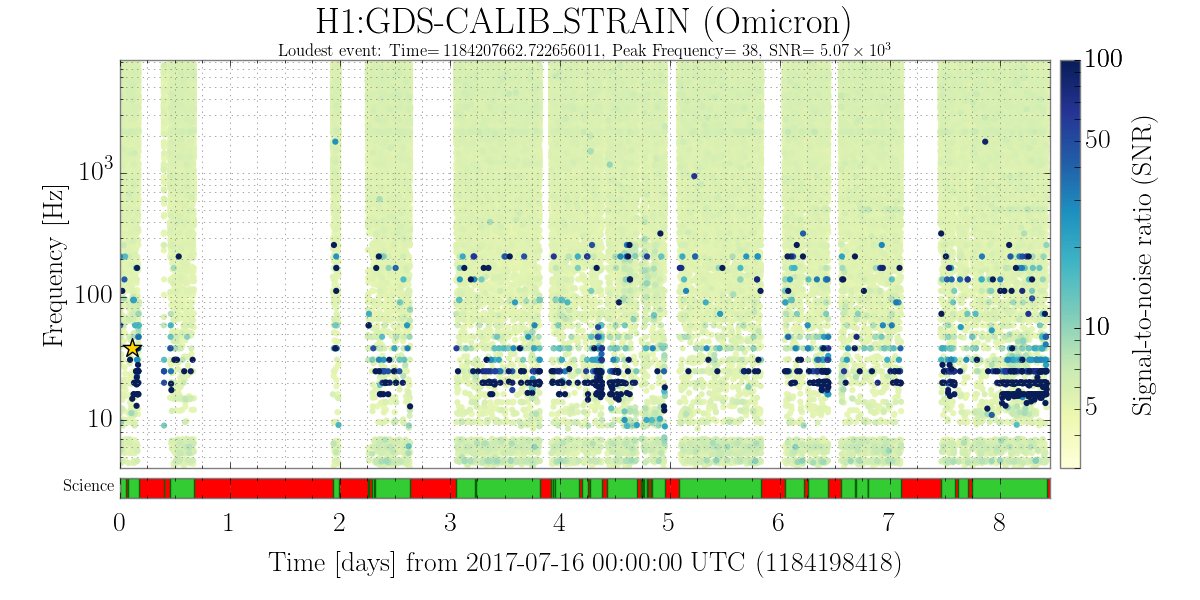
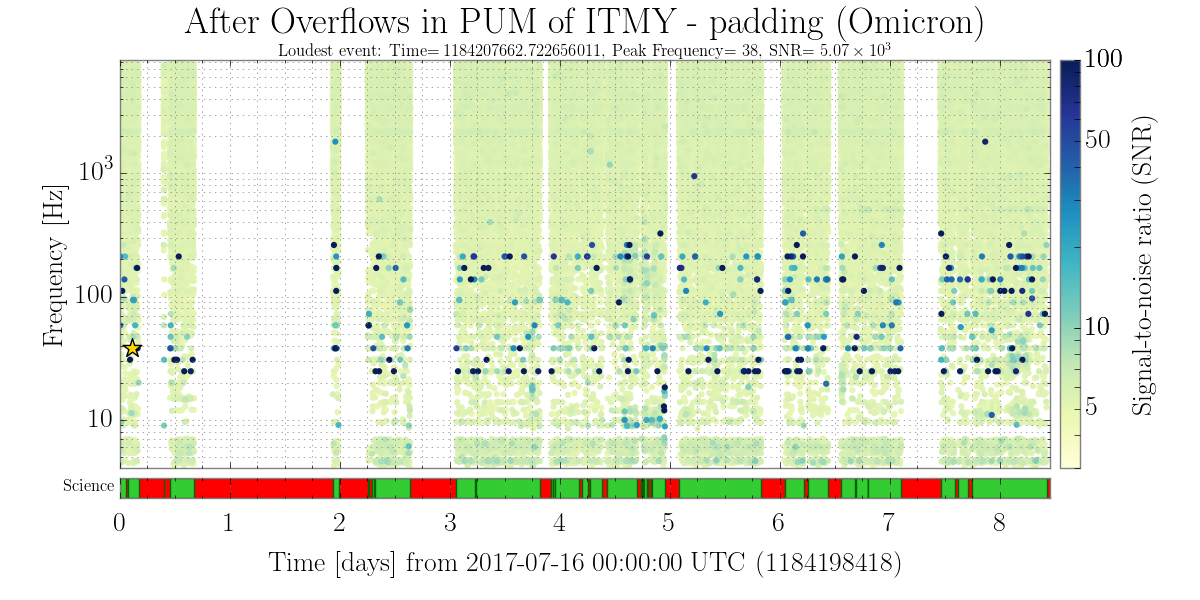
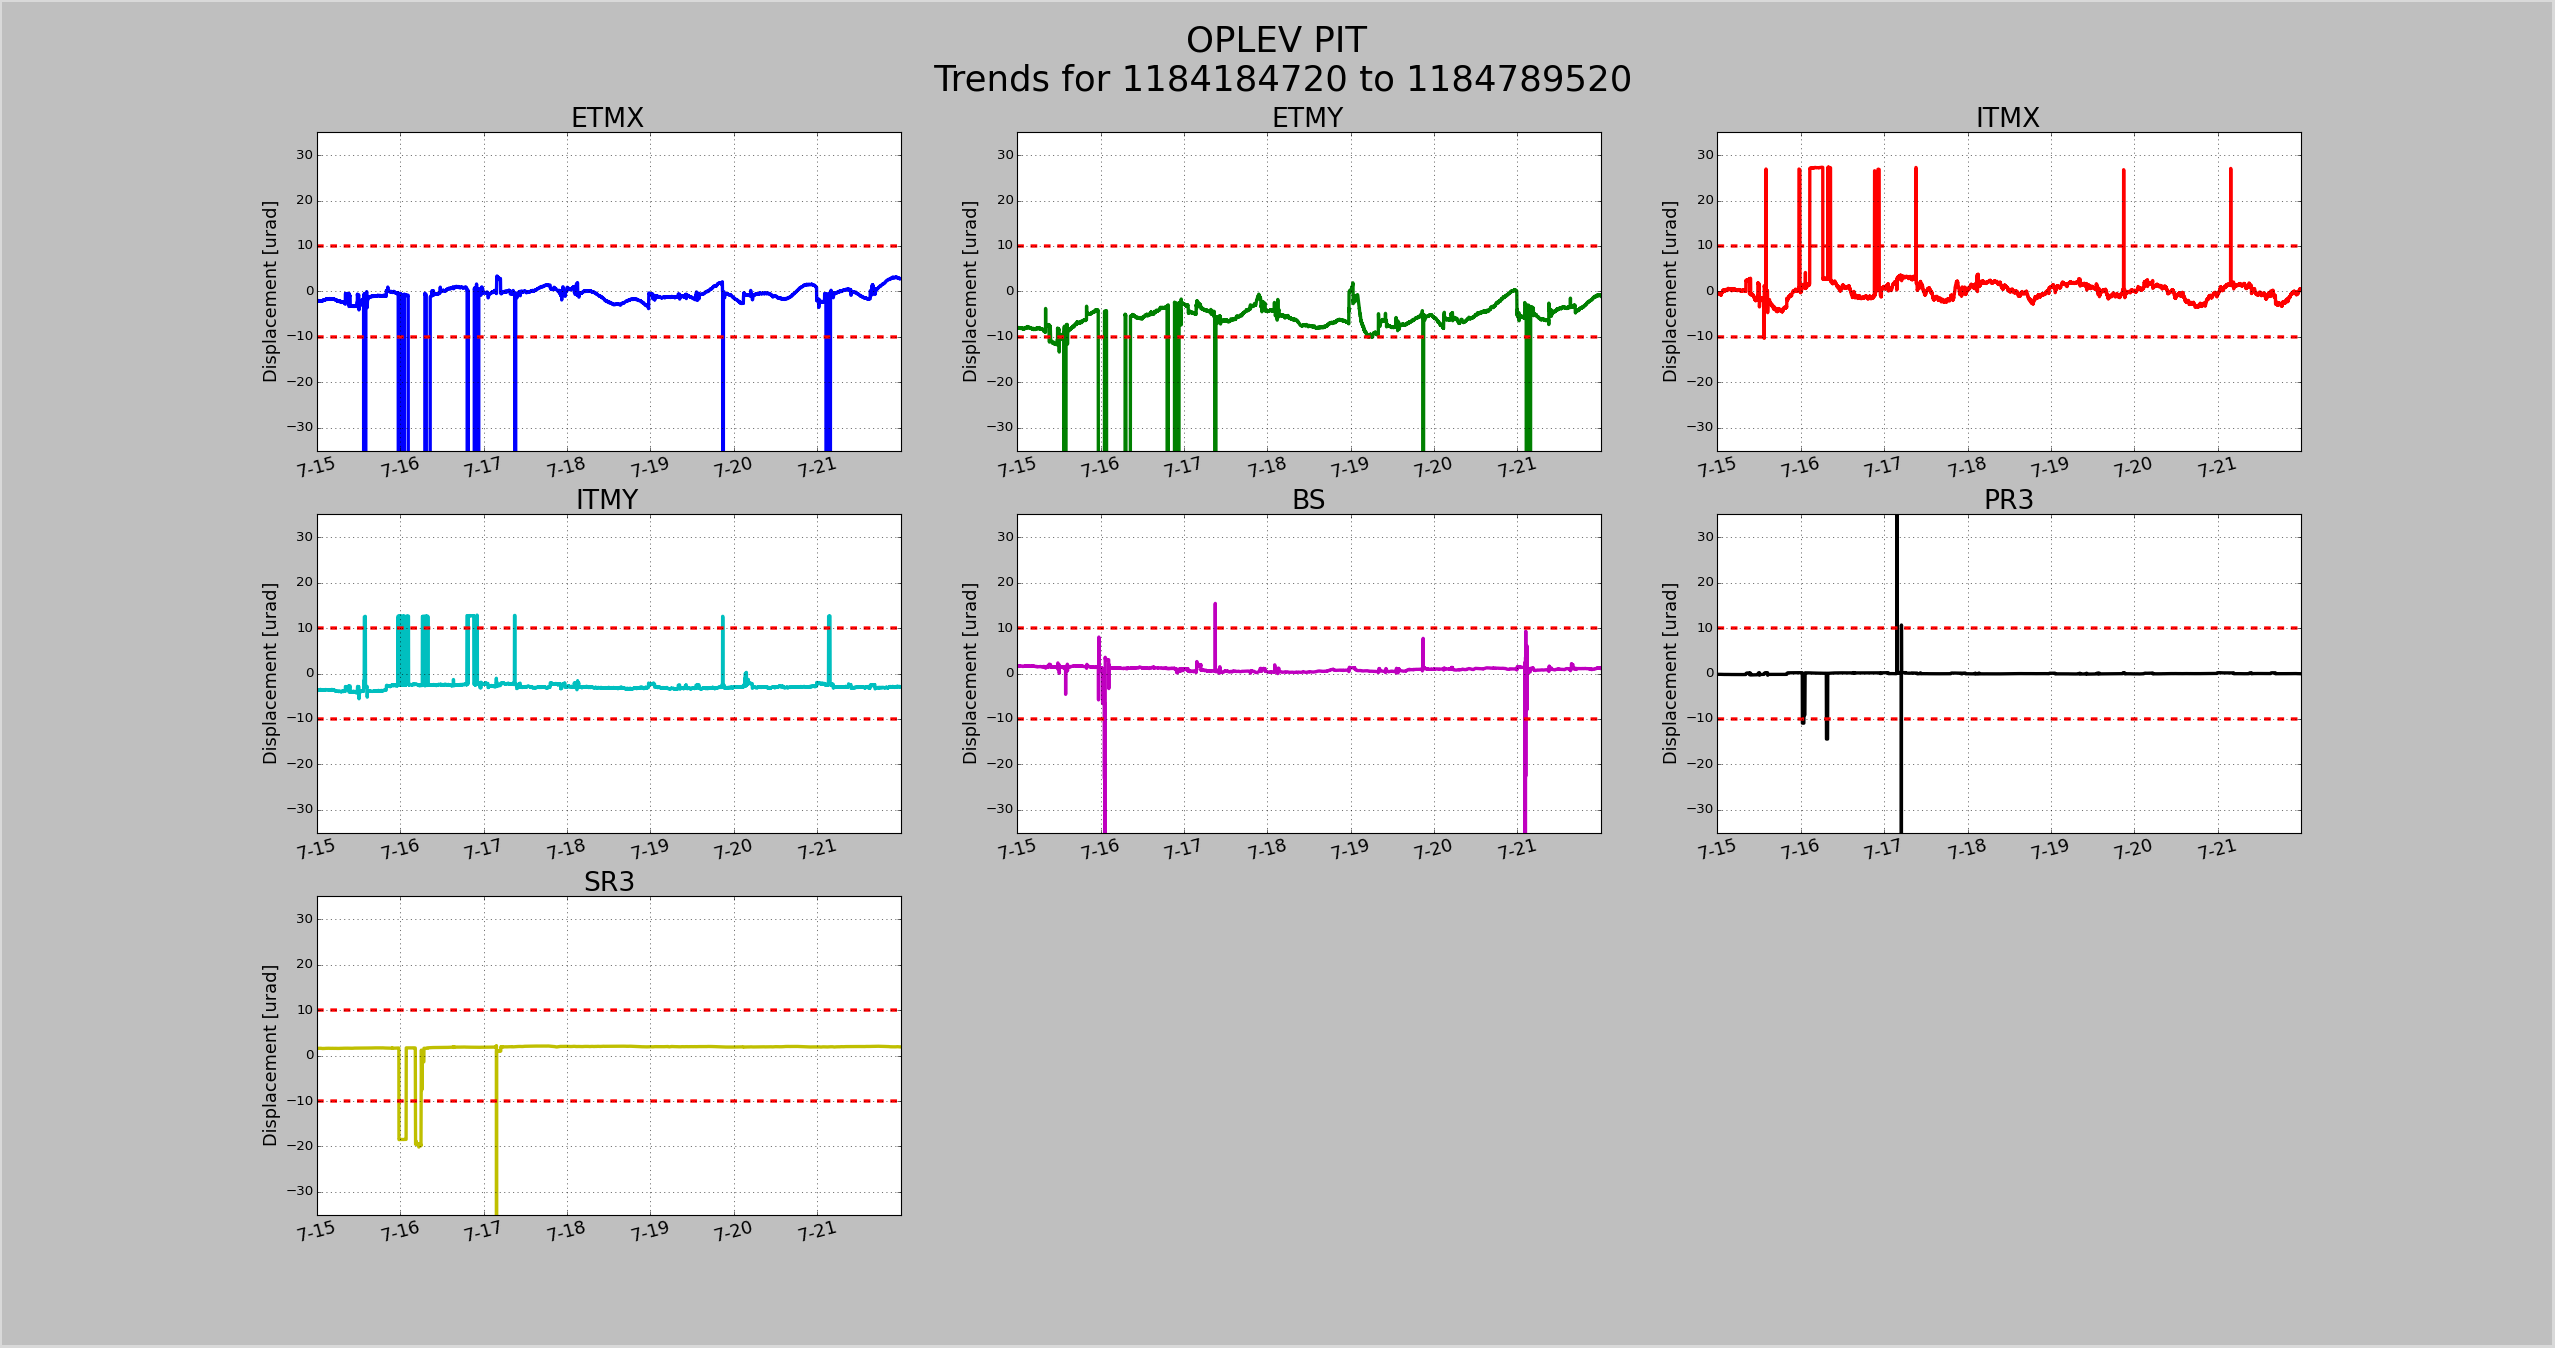
The glitchy periods at 10 UTC today, and 8 UTC on July 20, seem to be due to overflows in all of the test mass L2 coils. The cause of the overflows looks to be CSOFT pitch.
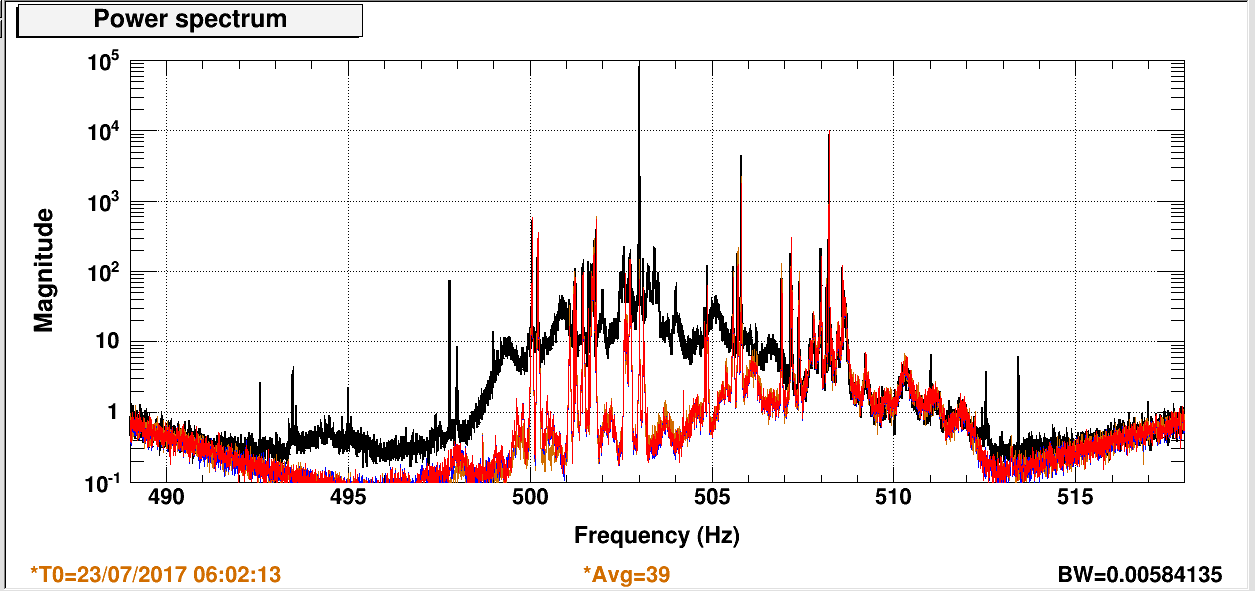
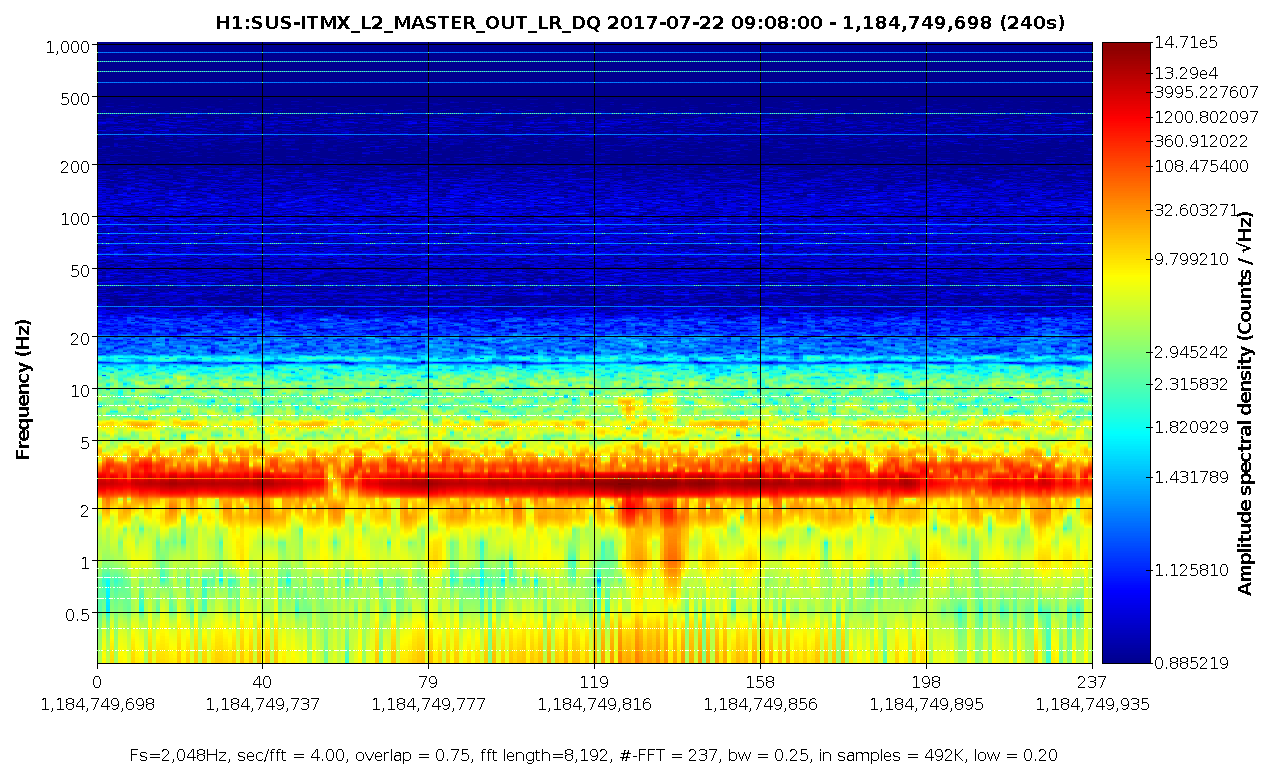
The attached plots show timeseries of CSOFT pitch and ITMX L2 master for one quadrant, then a spectrogram of the coil signal. It looks like most of the power is in the 2.8 Hz pitch mode of the test masses. From the summary pages, it looks like the RMS of CSOFT pitch has crept up over the last few months.
When the coil drive goes over 131,072 counts, the DAC overflows and the coil glitches. It's possible that I have things backwards, and the glitch comes first and the overflow is a symptom, but that doesn't seem to match the behavior of the RMS at non-glitchy times.
Is there a way to get CSOFT pitch lower, or maybe suppress some of the feedback at 2.8 Hz (which I think is the biggest contributor)?
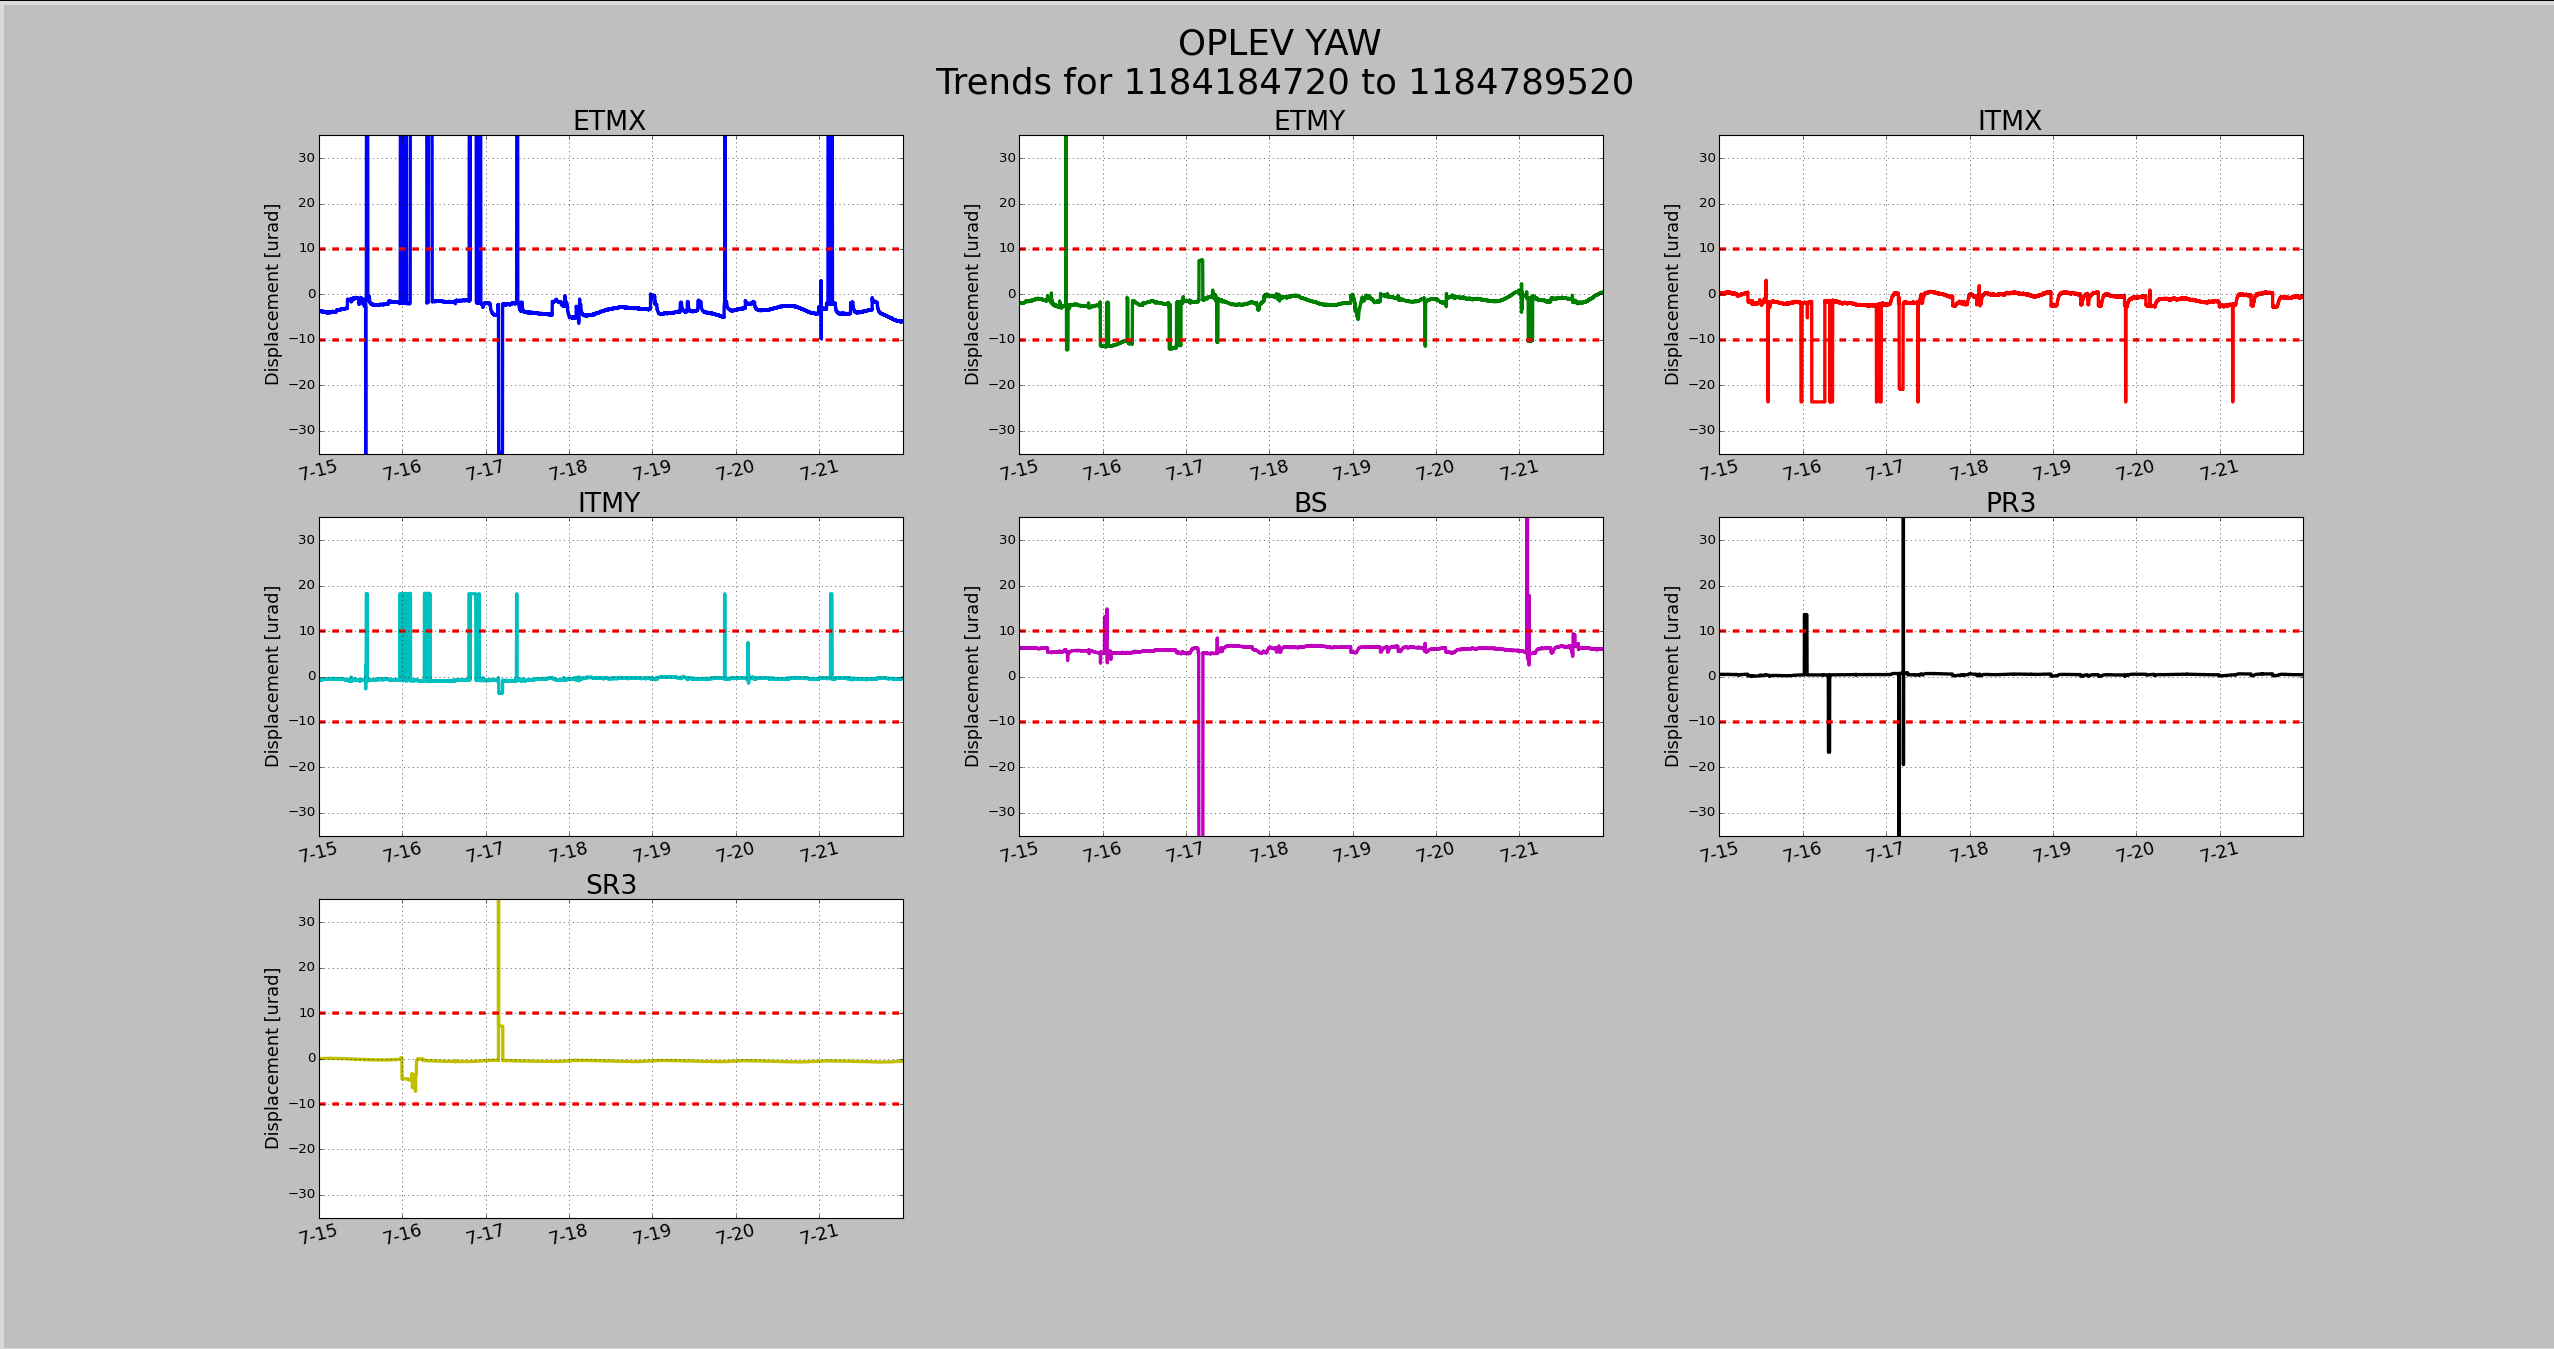
Back to Observing. PR3 was off in yaw and violins were all more rung up than usual. There are still a few of the usual culprits that are high, but the rest have damped.