model restarts logged for Thu 22/Jun/2017 - Wed 14/Jun/2017 No restarts reported
model restarts logged for Tue 13/Jun/2017
2017_06_13 09:24 h1isiham6
2017_06_13 09:29 h1broadcast0
2017_06_13 09:29 h1dc0
2017_06_13 09:29 h1fw0
2017_06_13 09:29 h1fw1
2017_06_13 09:29 h1fw2
2017_06_13 09:29 h1nds0
2017_06_13 09:29 h1nds1
2017_06_13 09:29 h1tw1
2017_06_13 10:19 h1isiham6
2017_06_13 11:23 h1iopoaf0
2017_06_13 11:23 h1oaf
2017_06_13 11:23 h1pemcs
2017_06_13 11:23 h1tcscs
2017_06_13 11:24 h1calcs
2017_06_13 11:24 h1iopseih45
2017_06_13 11:24 h1ngn
2017_06_13 11:24 h1odcmaster
2017_06_13 11:24 h1susprocpi
2017_06_13 11:26 h1hpiham4
2017_06_13 11:26 h1hpiham5
2017_06_13 11:26 h1iopoaf0
2017_06_13 11:26 h1isiham4
2017_06_13 11:26 h1isiham5
2017_06_13 11:27 h1calcs
2017_06_13 11:27 h1oaf
2017_06_13 11:27 h1odcmaster
2017_06_13 11:27 h1pemcs
2017_06_13 11:27 h1tcscs
2017_06_13 11:28 h1ngn
2017_06_13 11:28 h1susprocpi
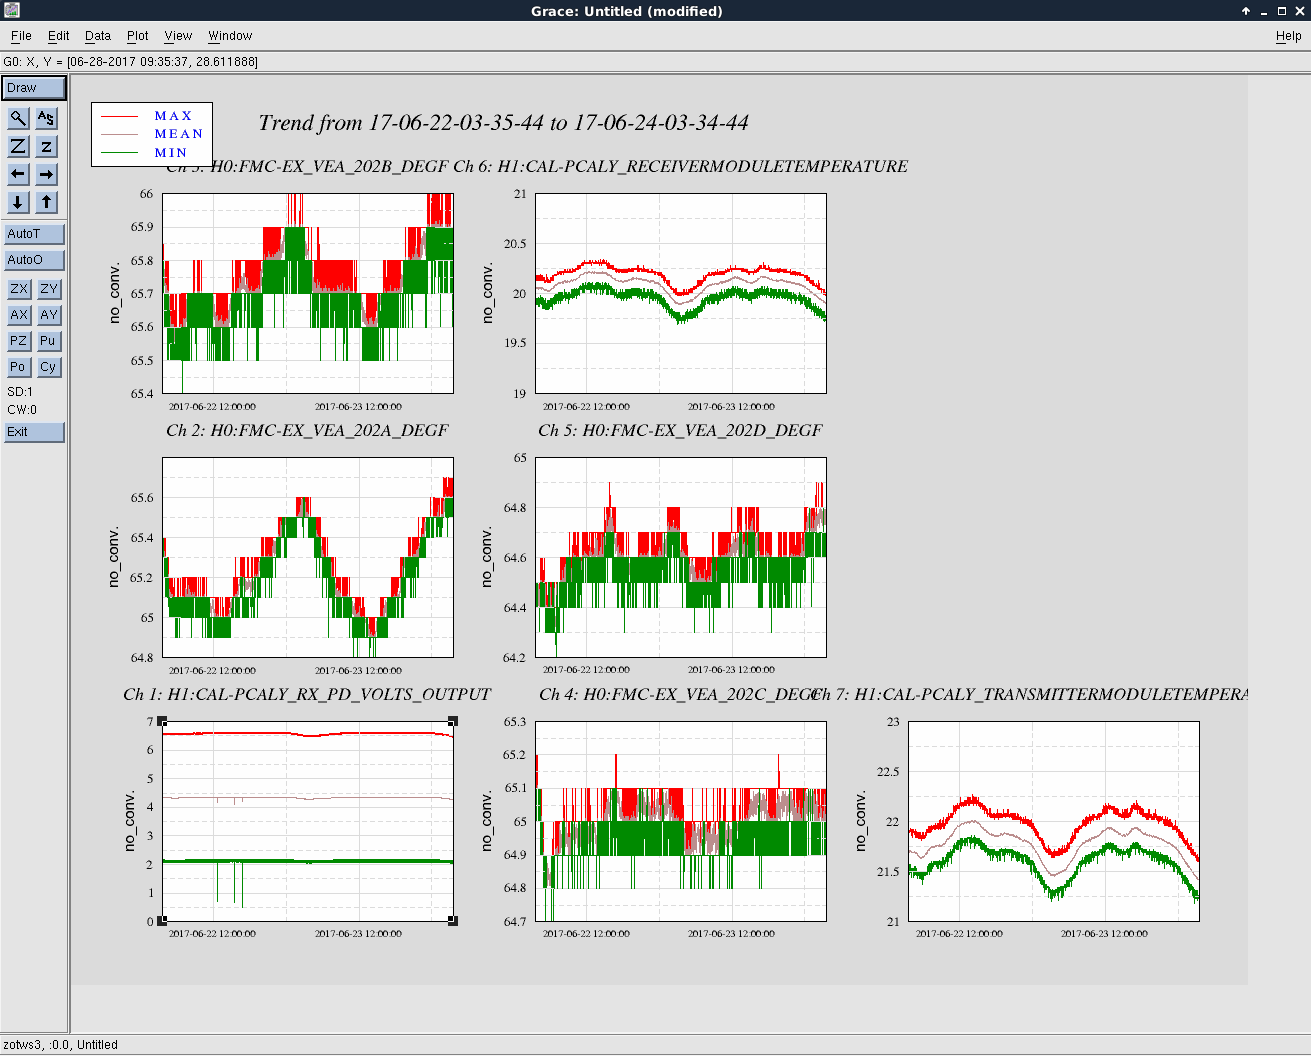
Maintenance Tuesday. New isiham6 code with associated DAQ restarts. Unexpected problems with h1seih45 and h1oaf0 which required model restarts.
model restarts logged for Mon 12/Jun/2017 - Wed 07/Jun/2017 No restarts reported
model restarts logged for Tue 06/Jun/2017
2017_06_06 08:54 h1susomc
Maintenance Tuesday, minor model change to h1susomc.
model restarts logged for Mon 05/Jun/2017 - Sat 03/Jun/2017 No restarts reported
model restarts logged for Fri 02/Jun/2017
2017_06_02 10:17 h1caley
2017_06_02 10:17 h1iopiscey
2017_06_02 10:17 h1iscey
2017_06_02 10:17 h1pemey
2017_06_02 10:18 h1caley
2017_06_02 10:18 h1iopiscey
2017_06_02 10:18 h1iscey
2017_06_02 10:18 h1pemey
2017_06_02 10:19 h1alsey
h1iscey power cycle as part of ALS-Y problem investigation.
model restarts logged for Thu 01/Jun/2017
2017_06_01 11:59 h1nds1
2017_06_01 12:01 h1nds0
Completion of minute trend offloading required restart of NDS daqd.
model restarts logged for Wed 31/May/2017 No restarts reported