Displaying reports 501-520 of 89074.Go to page Start 22 23 24 25 26 27 28 29 30 End
Reports until 08:47, Thursday 23 July 2026
H1 AOS
camilla.compton@LIGO.ORG - posted 08:47, Thursday 23 July 2026 - last comment - 13:44, Tuesday 28 July 2026(91197)
New ZM2 alignment, Power check through OPOS, PD BD Checks, ZM5 iris placed

Ryan S, Camilla

ZM2 alignment
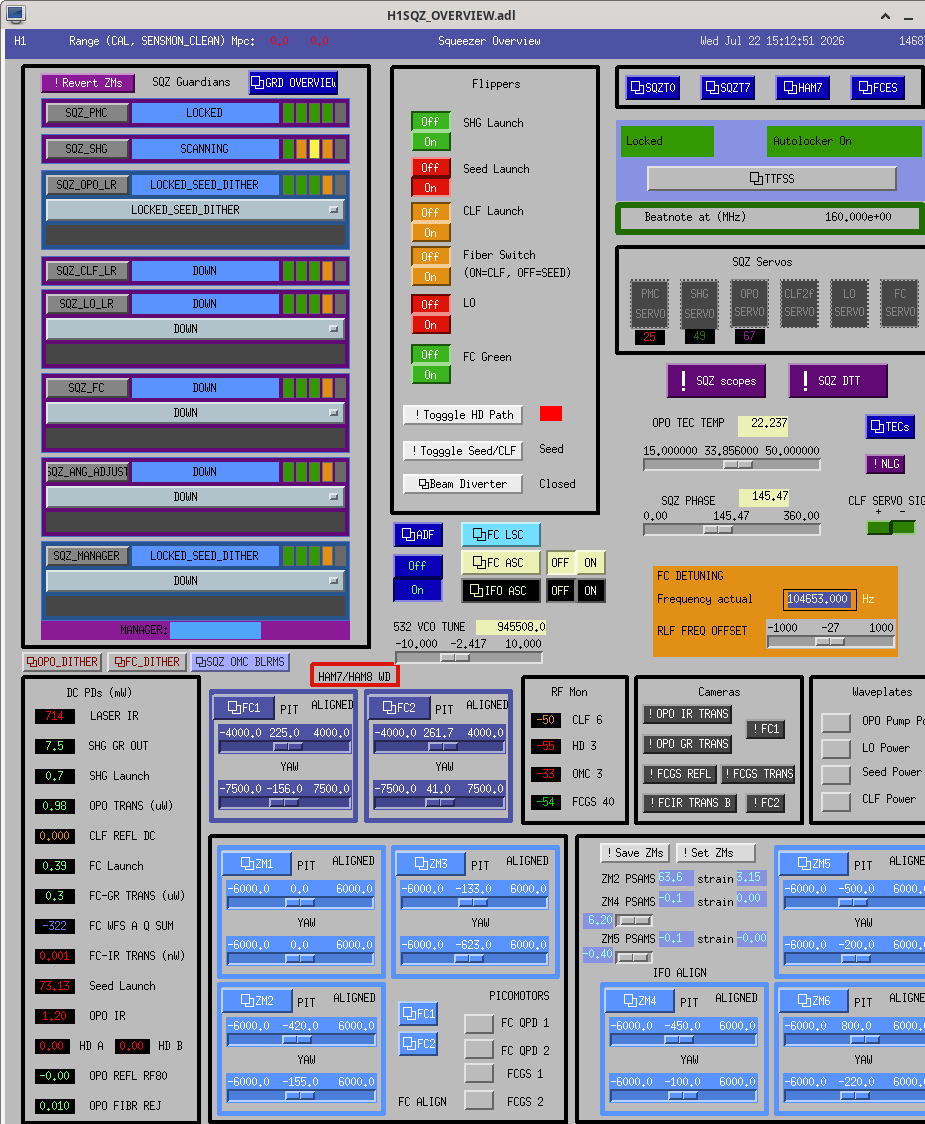
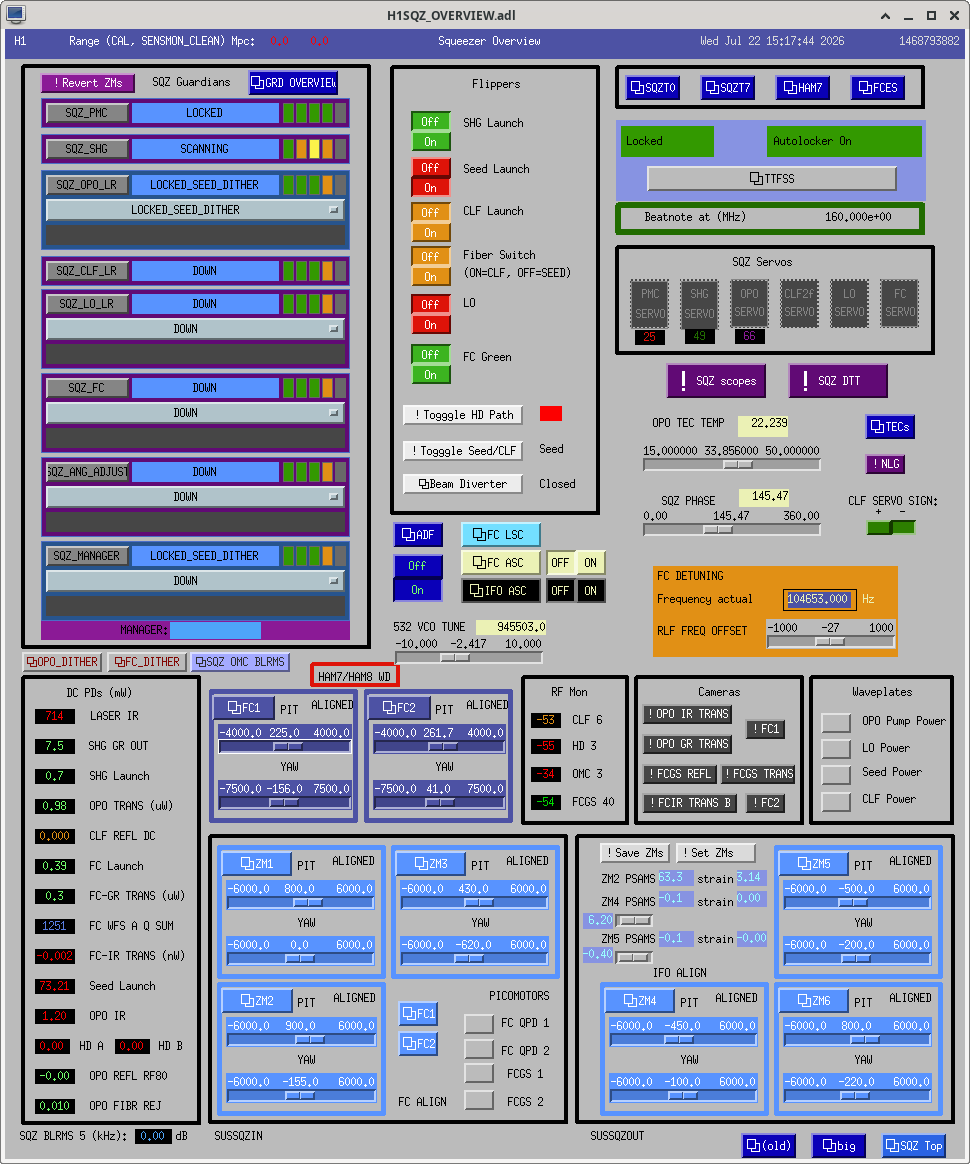
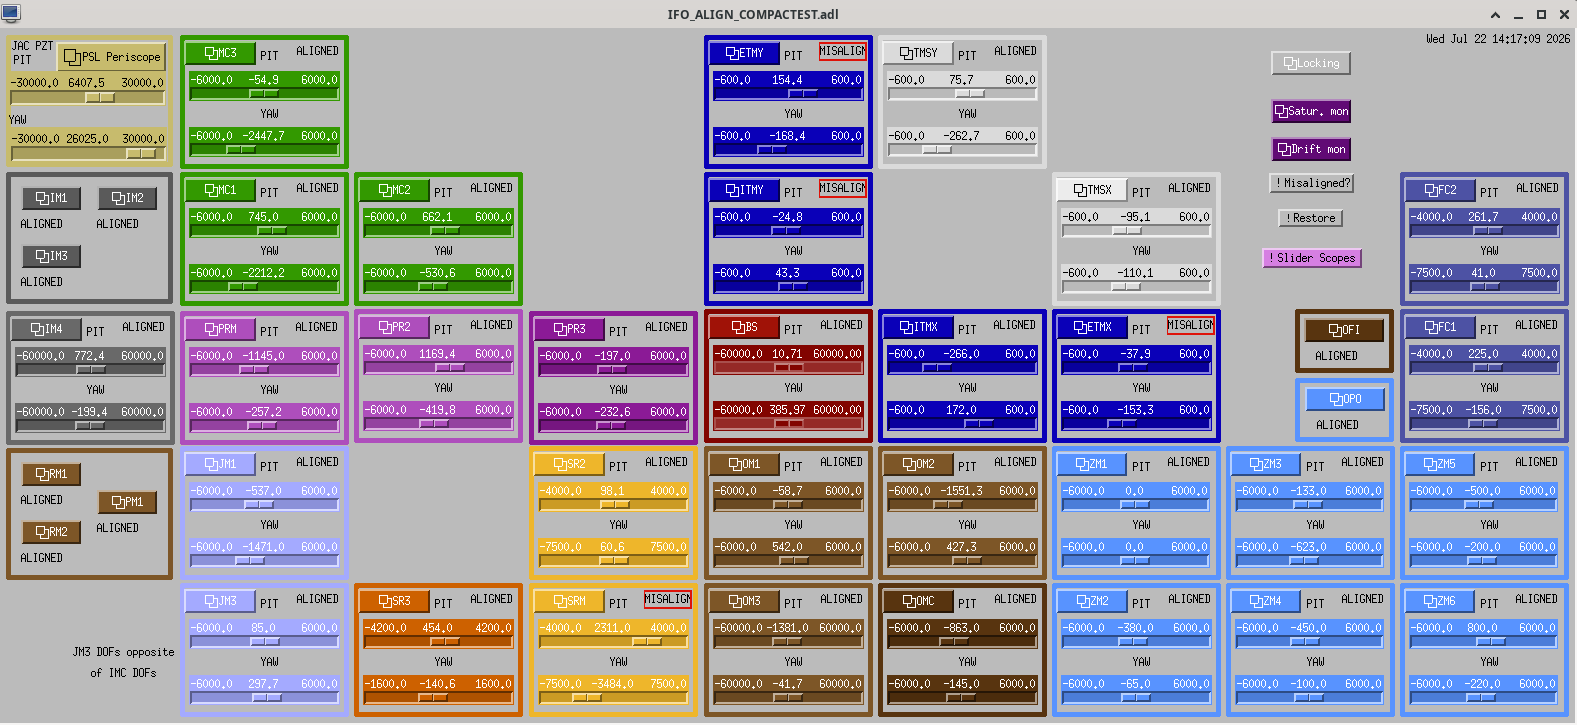
After the alignment mystery yesterday 91183 where I must have moved the ZM2 cable adjusting it's alignment, today I found the new ZM2 alignment for the beam to be retroreflected in the FC path, nominal alignment sliders attached. Also moved to the "new" ZM2 beam location (beam closer to 5.75" high at ZM2) plus the amount I needed to move ZM2 to account for the ZM2 bump. The beam was retroreflected fine, sliders of the "new ZM2" location attached.  In this new location the H1:FEC-160_DAC_OUTPUT s are around 20k which slightly better than before I bumped ZM2. 
 
Power Budget 
Ryan and I took power budgets through the OPOS. We got between 4.5 and 7.5% power drop from out fo the OPO before A:DC1 to after B:M4 for both the nominal and "new ZM2" alignments, see below. In 90573 we got between a 2% and 5.5% power drop, so although we thought his was fine at the time, but maybe it isn't. 
ZM5 iris
We added an iris after ZM5, to assist in realignment of ZM5 once it is swapped next week. 
 
Power Meter and beamdumps checked
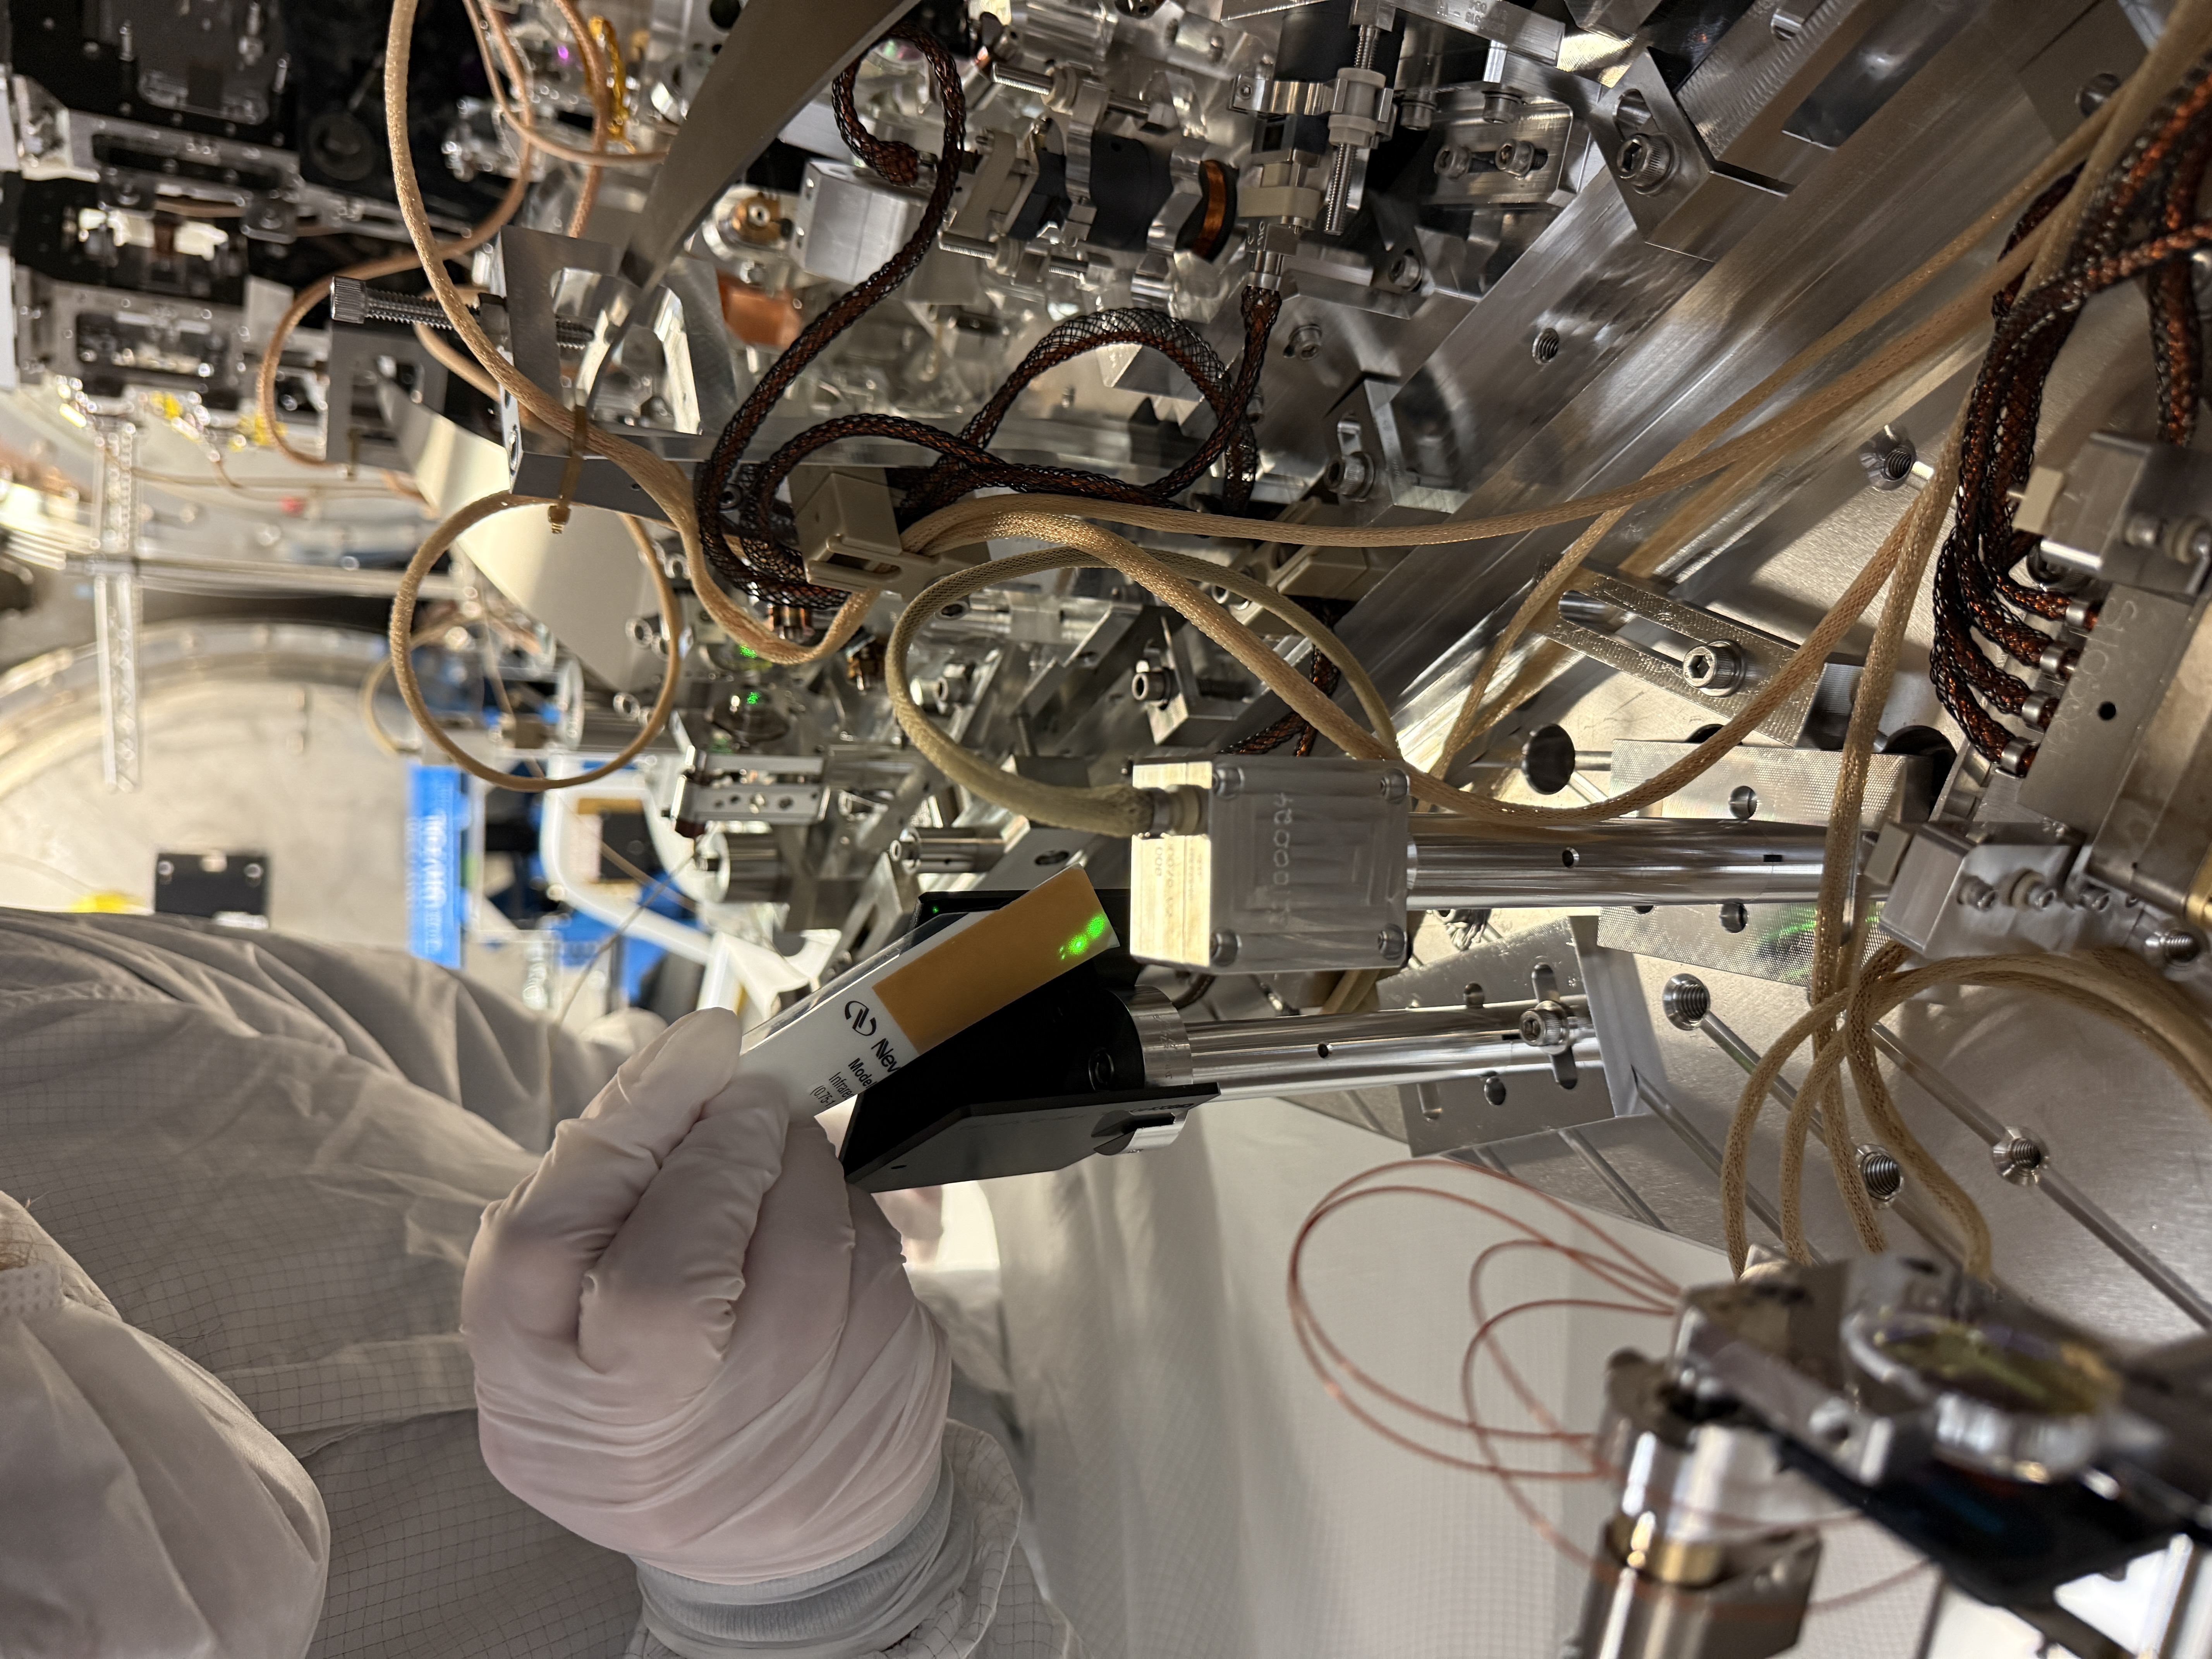
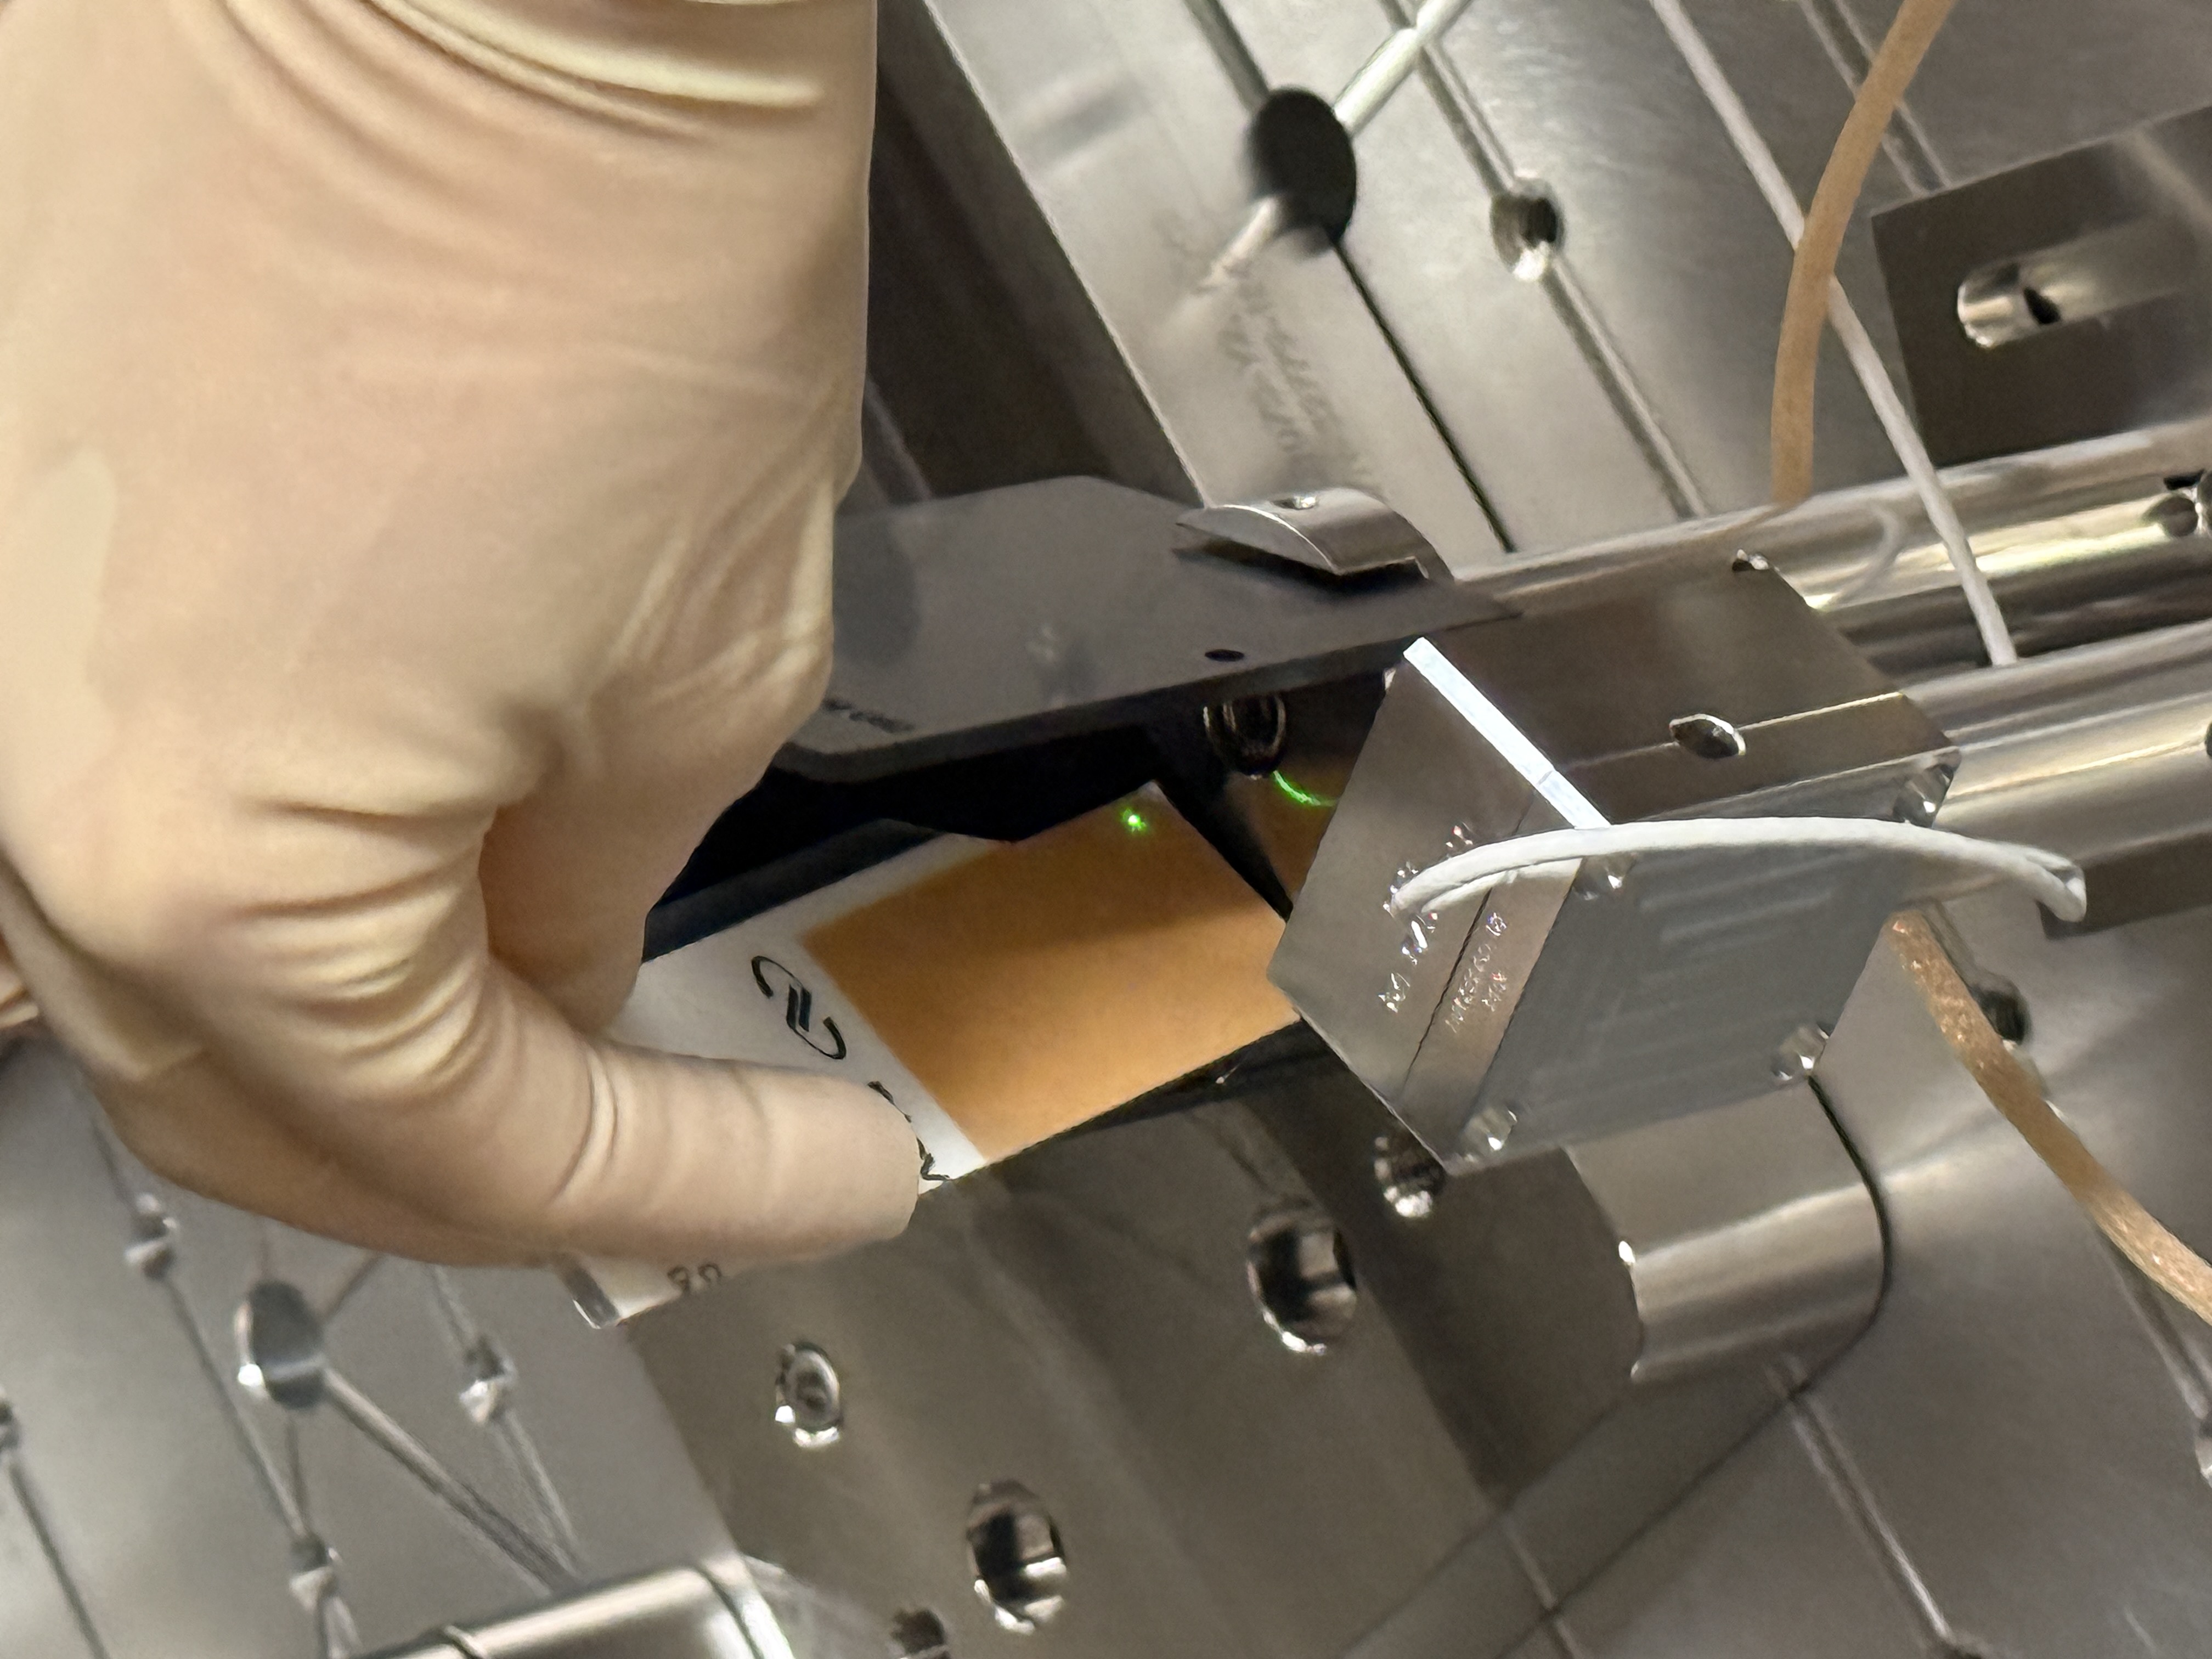
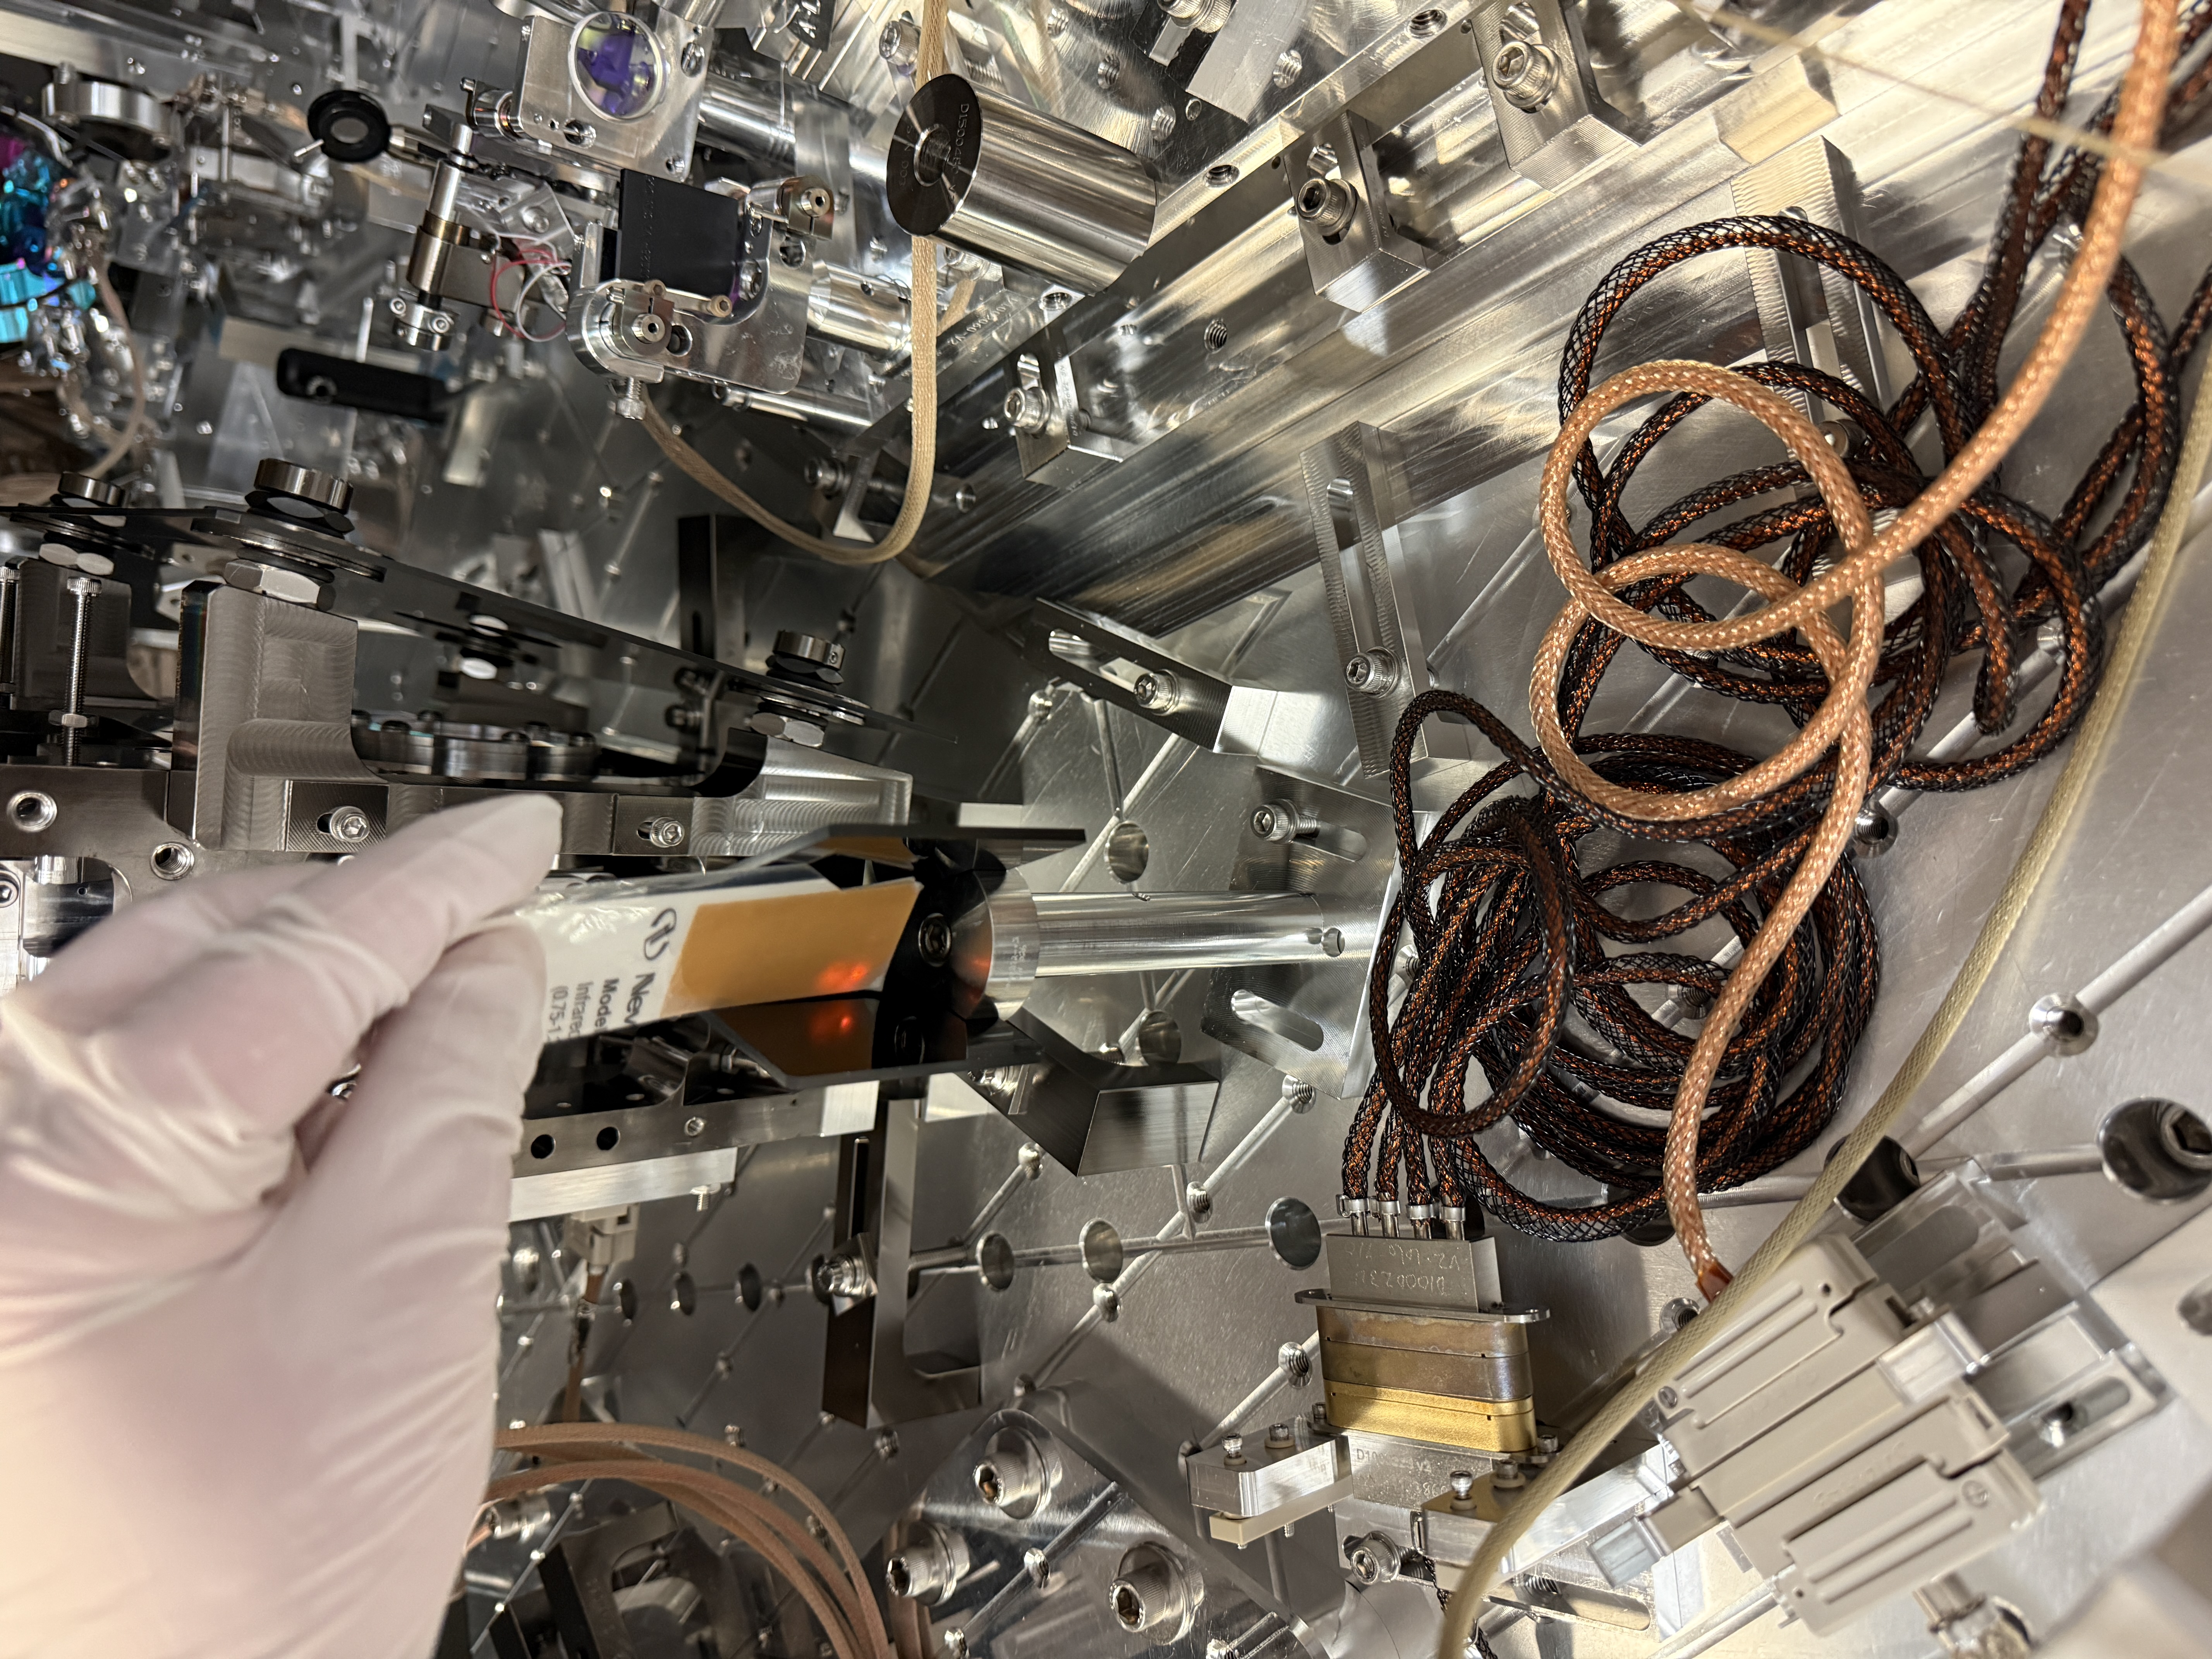
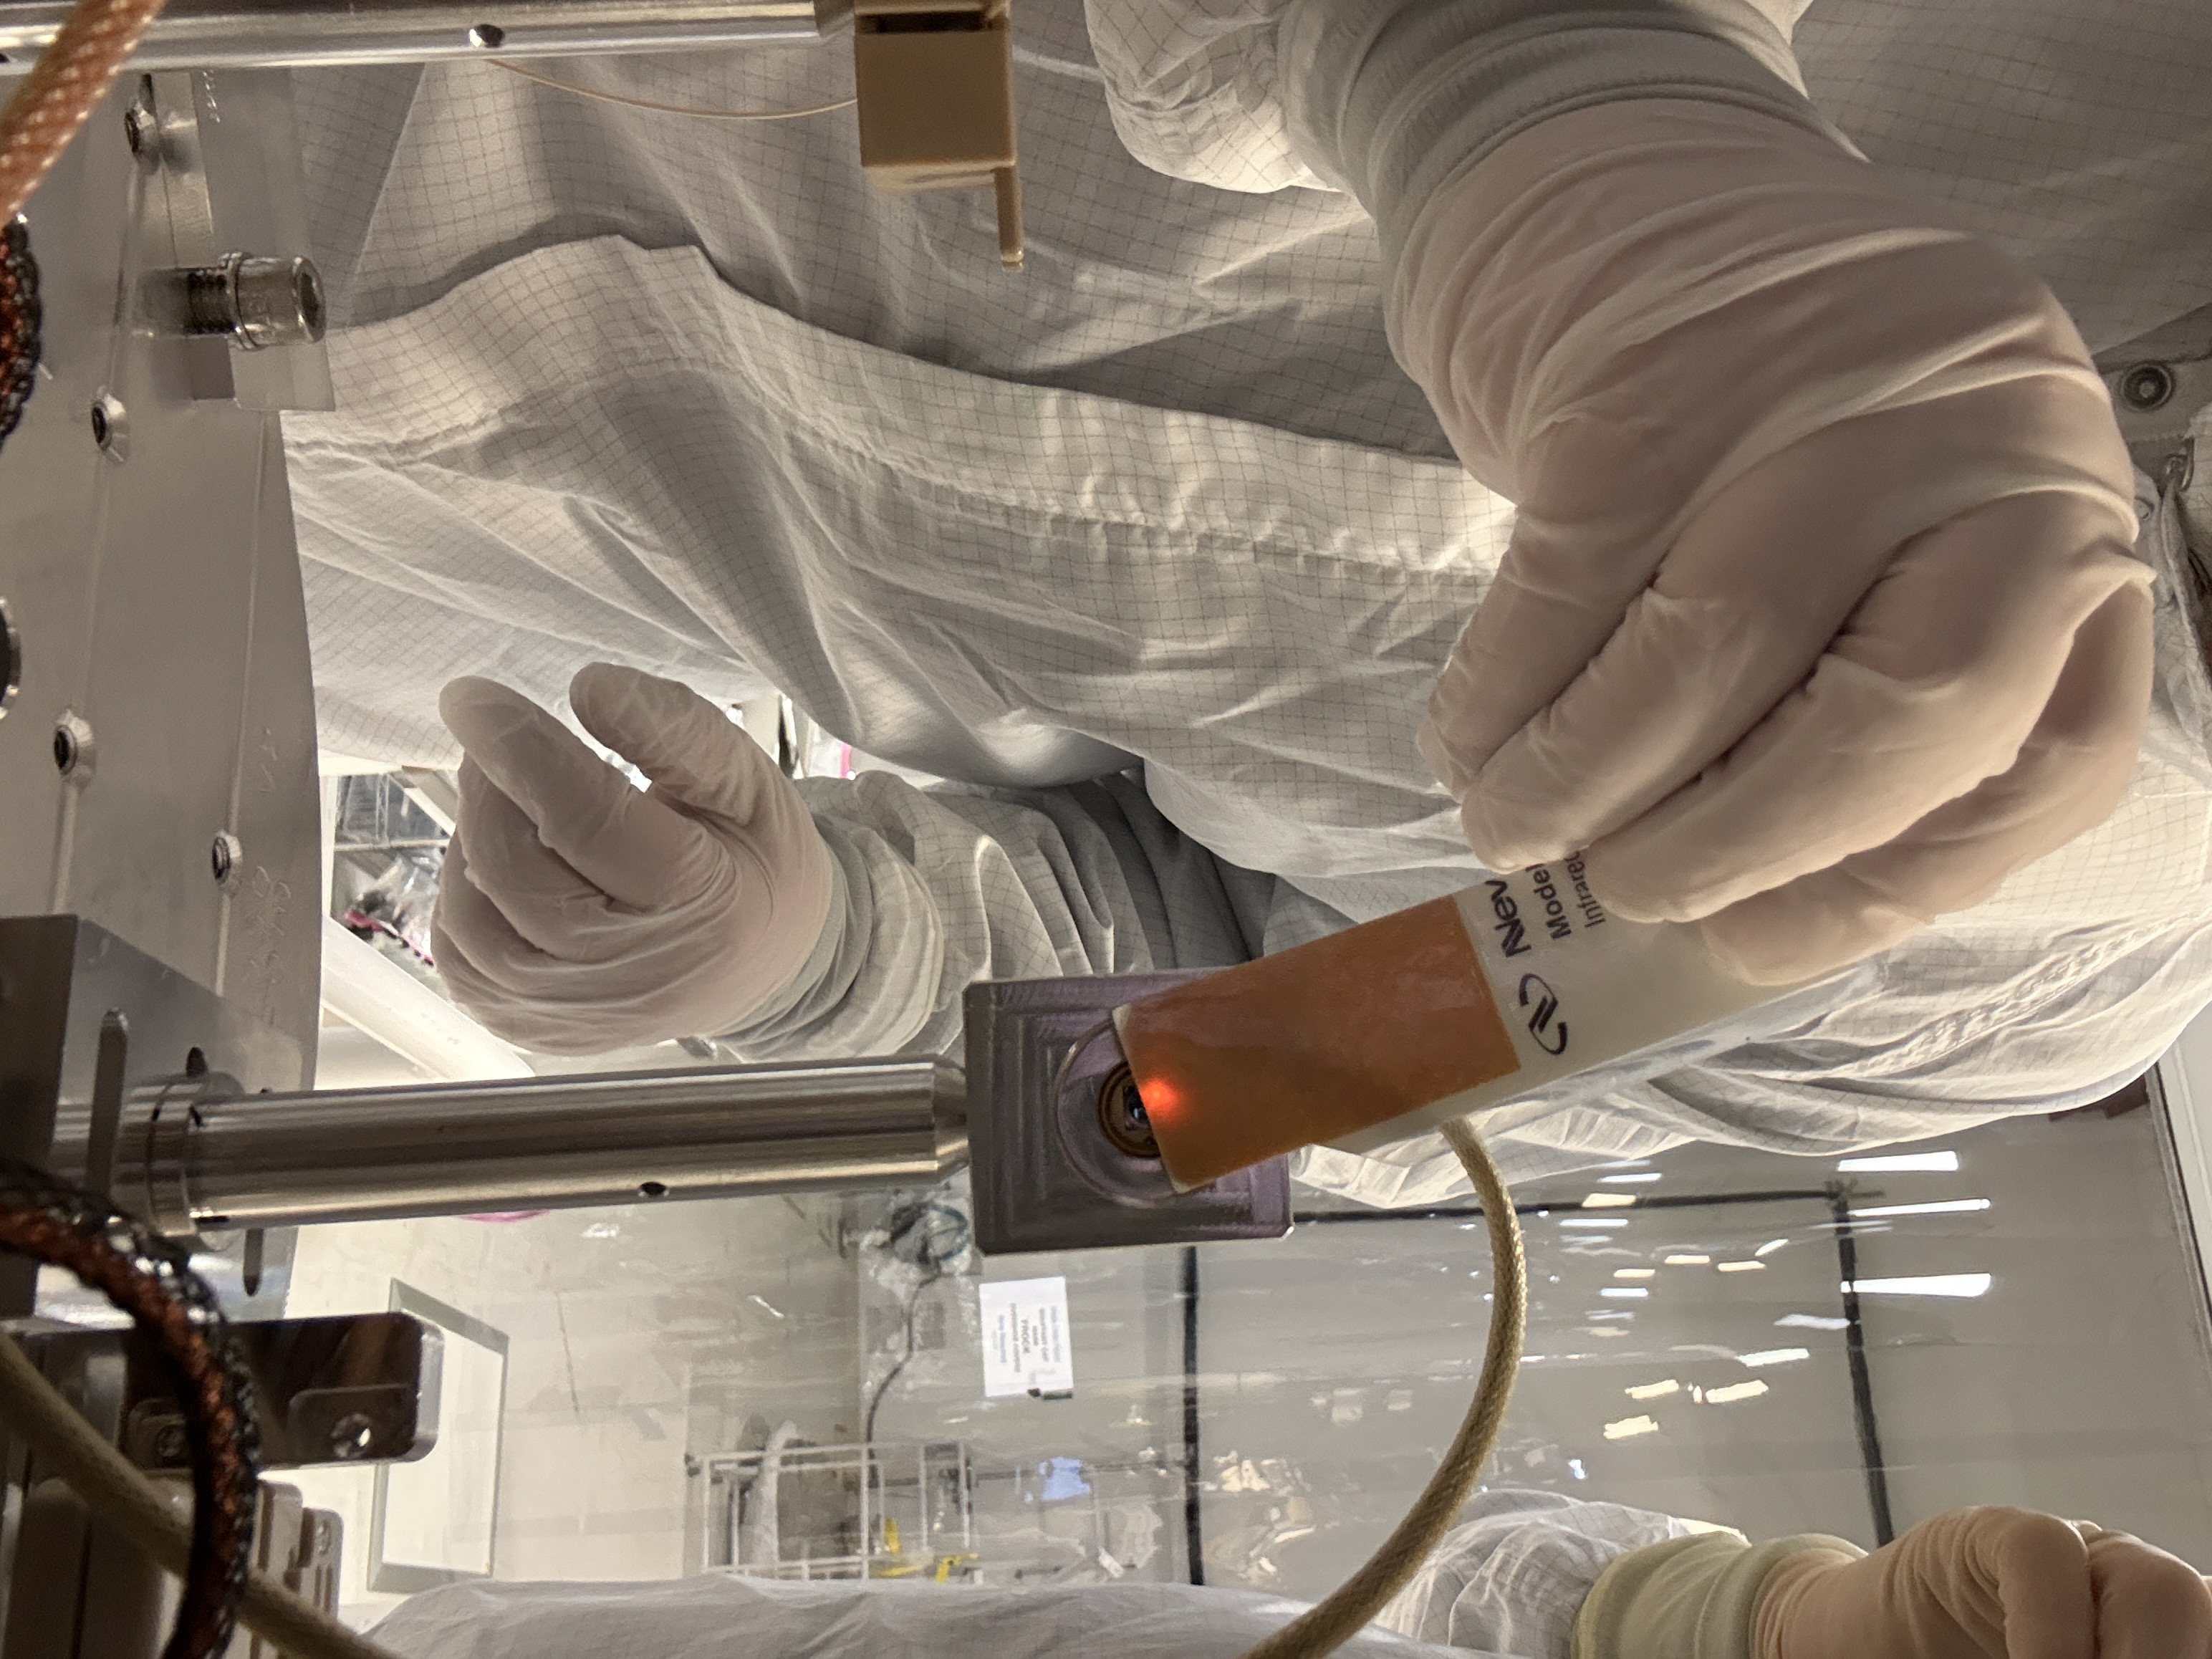
We digitally checked that the three fiber rejected powermeters F:BD1, G:BD1 and H:BD1 we reading power in medm when the beams were on them. We did not check the centering on the PDs. We did check the centering on the beamdumps: G:BD1 and H:BD1 were fine, the beam was very close to the gap between panels for F:BD1 so we adjusted it, before and after attached. 
Images attached to this report
Comments related to this report
camilla.compton@LIGO.ORG - 13:44, Tuesday 28 July 2026 (91290)

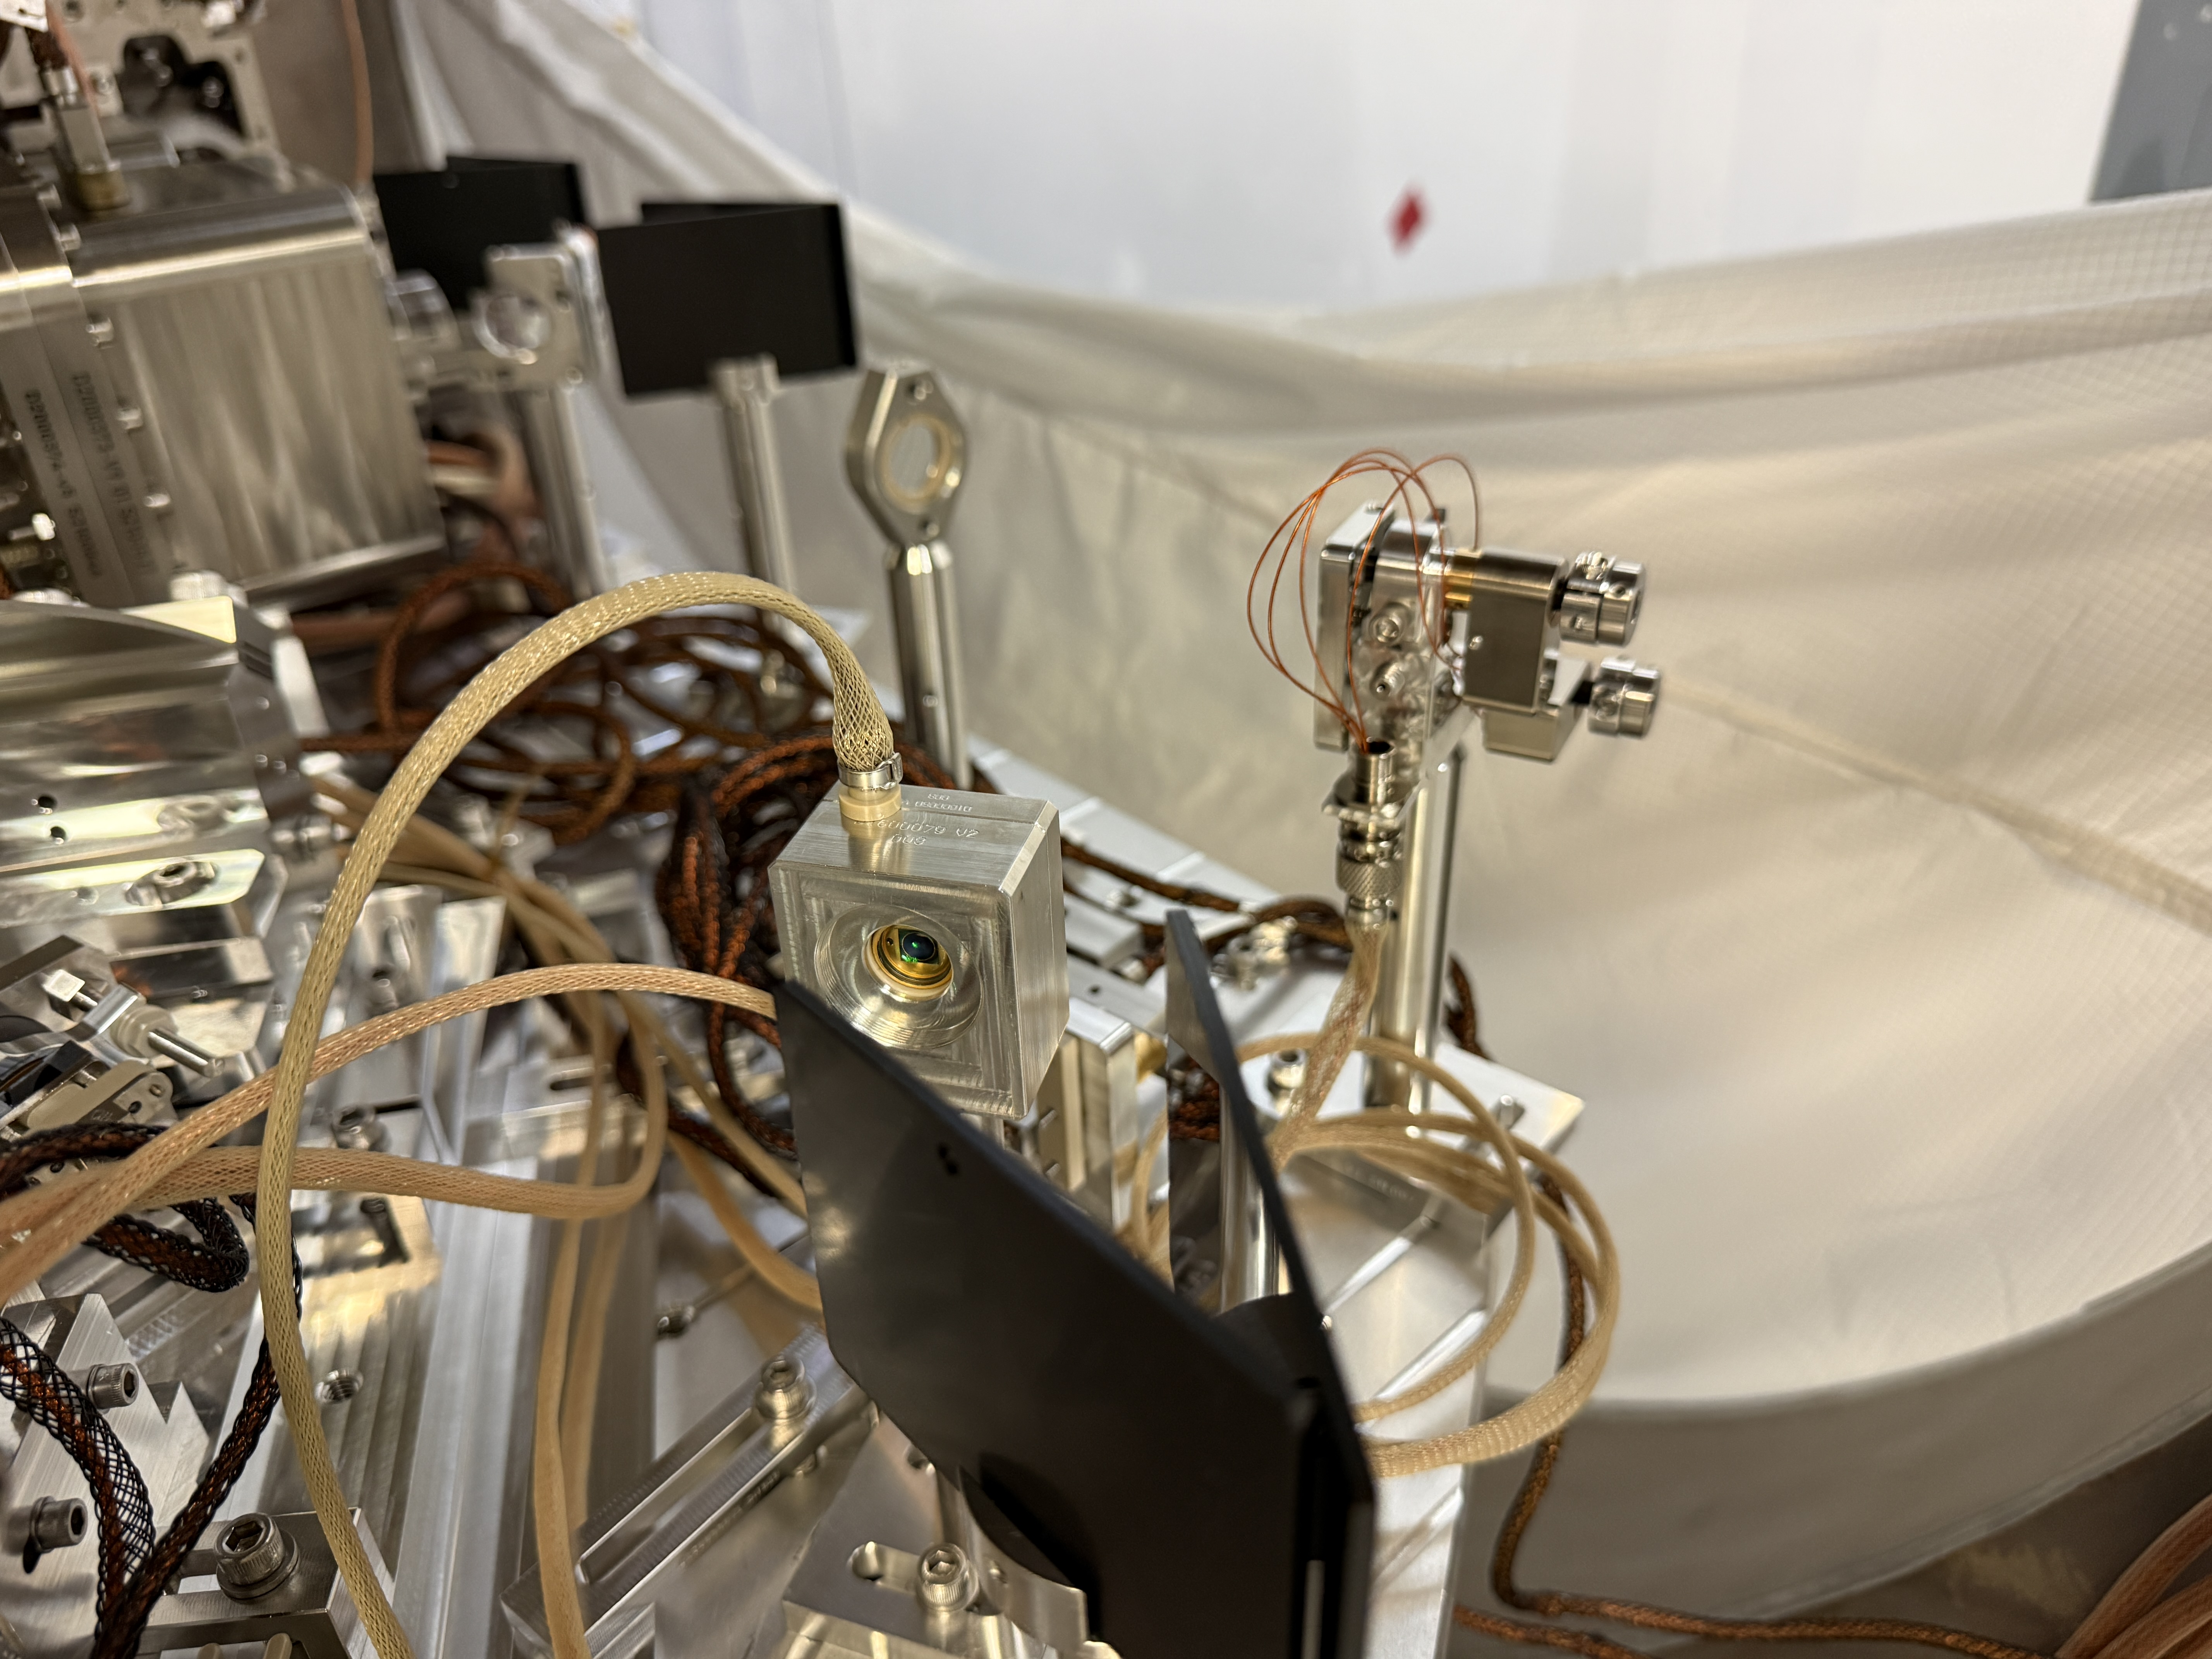
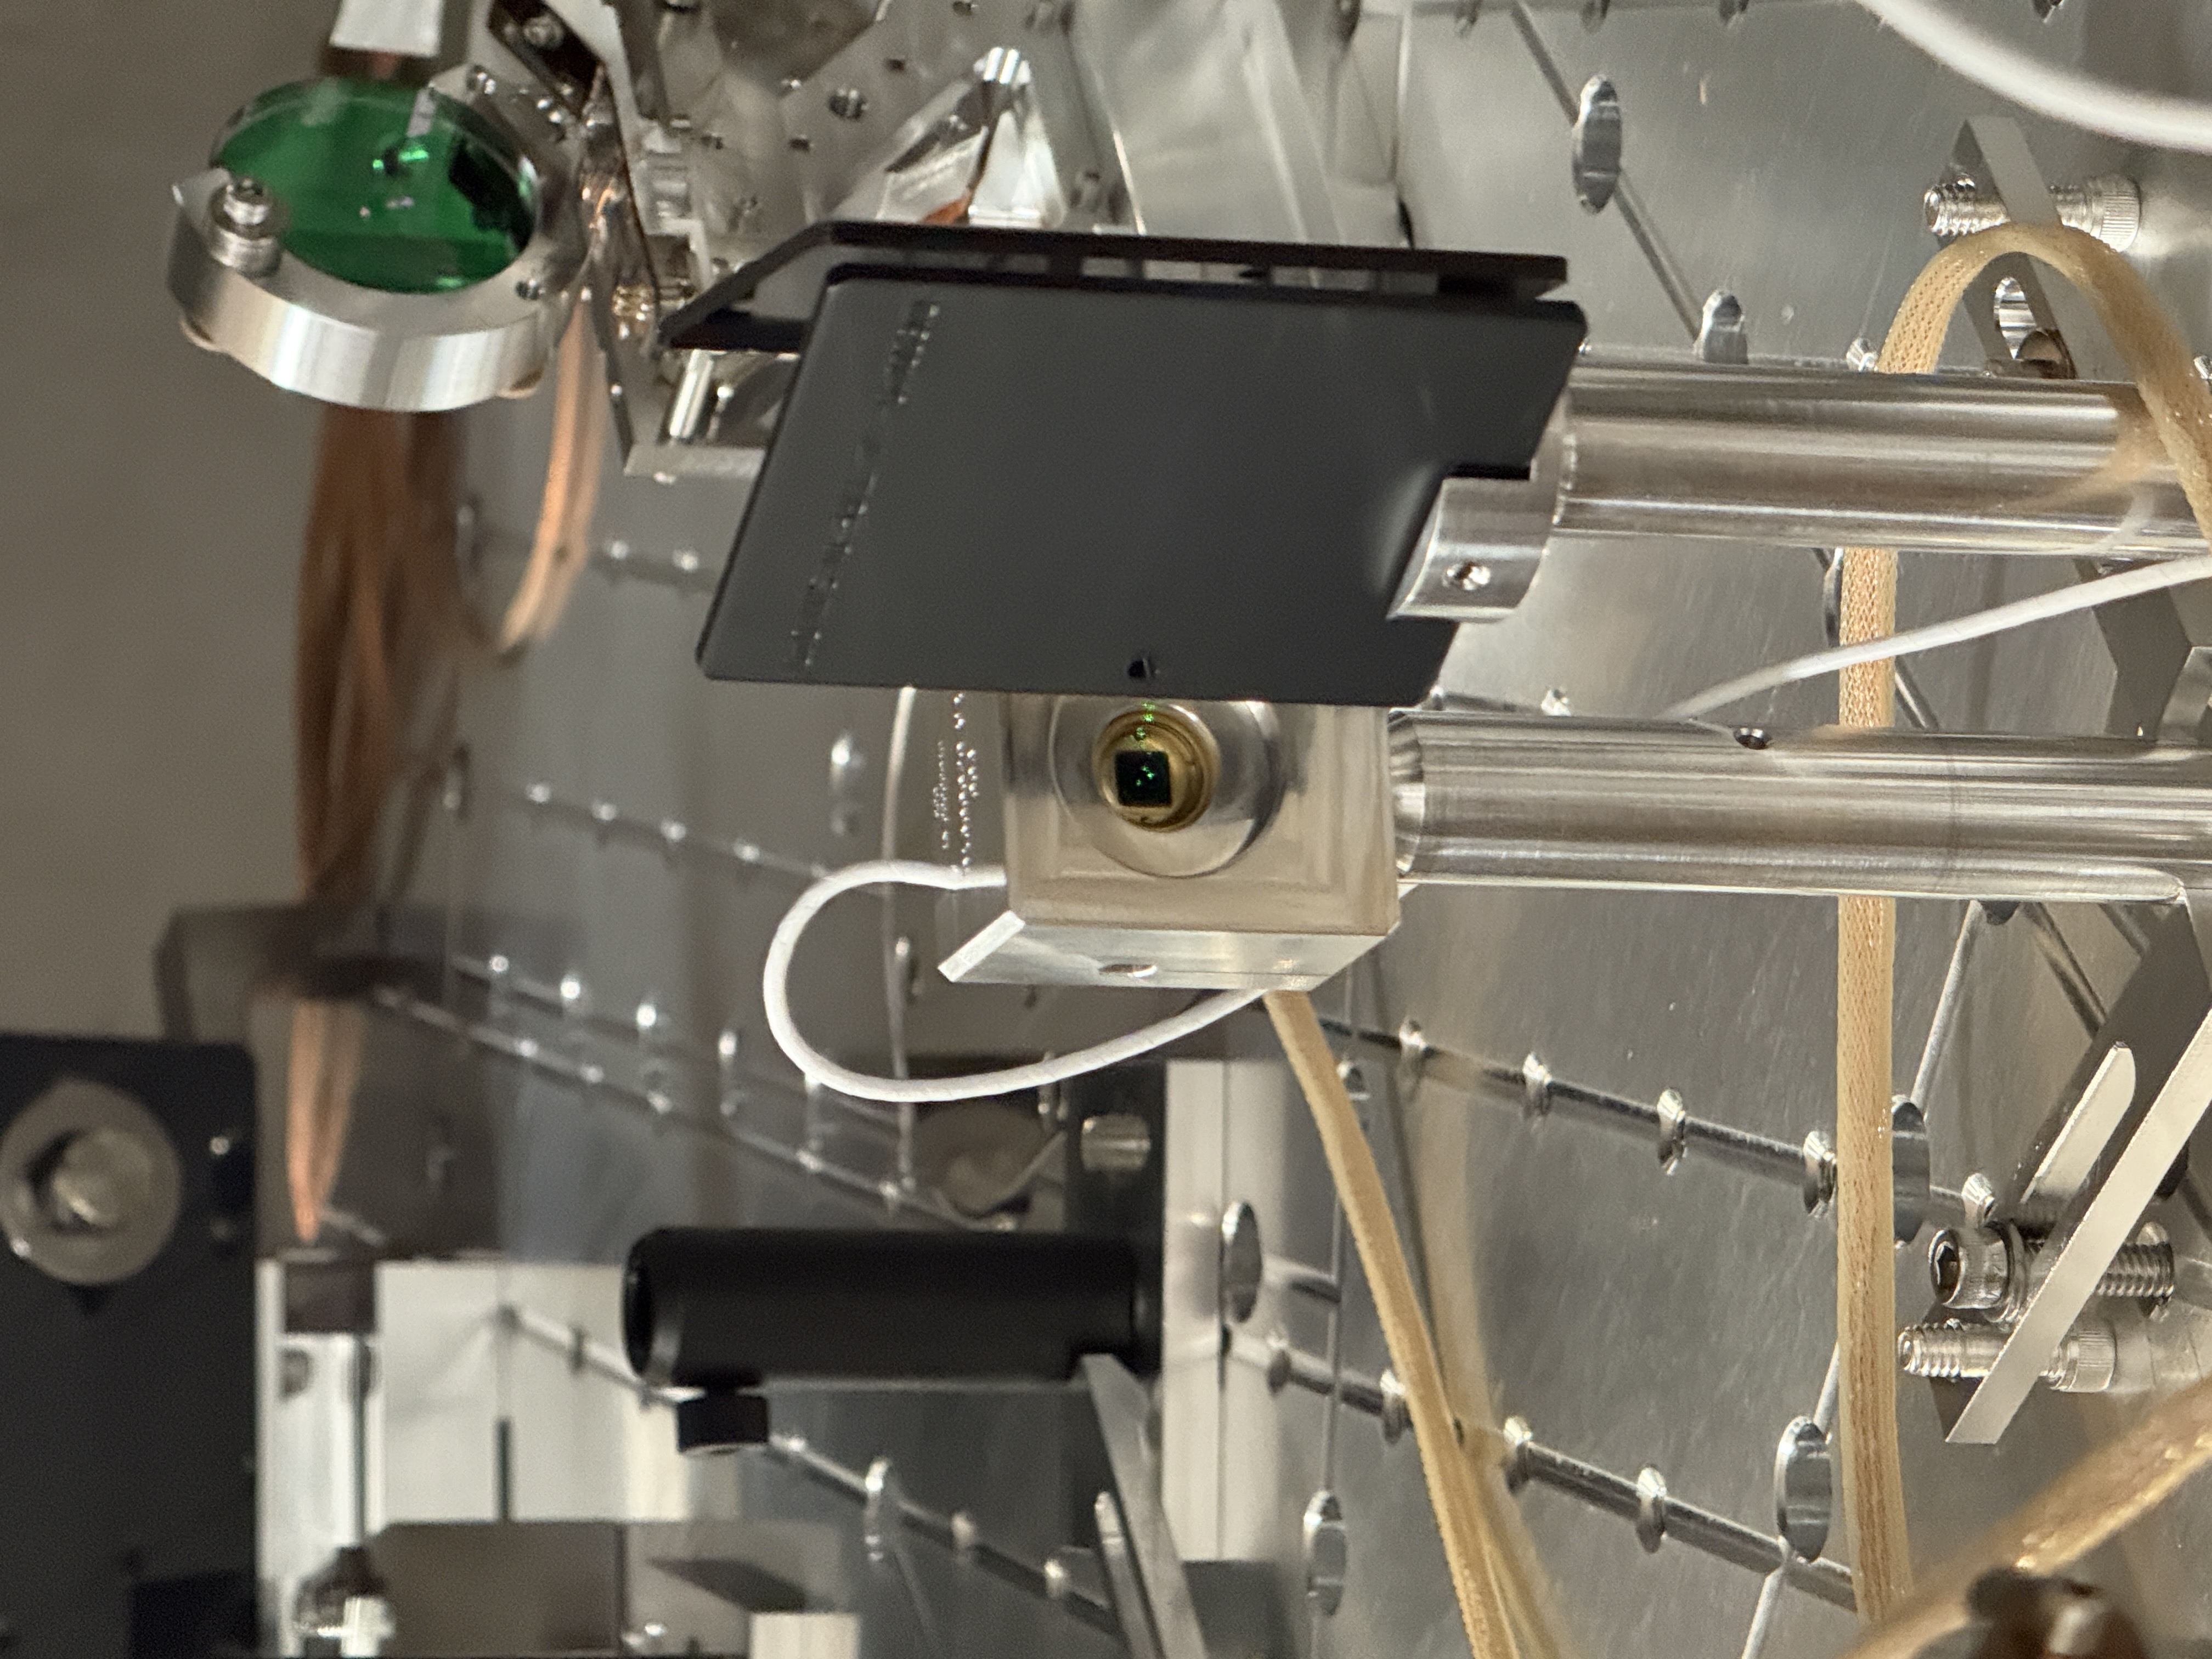
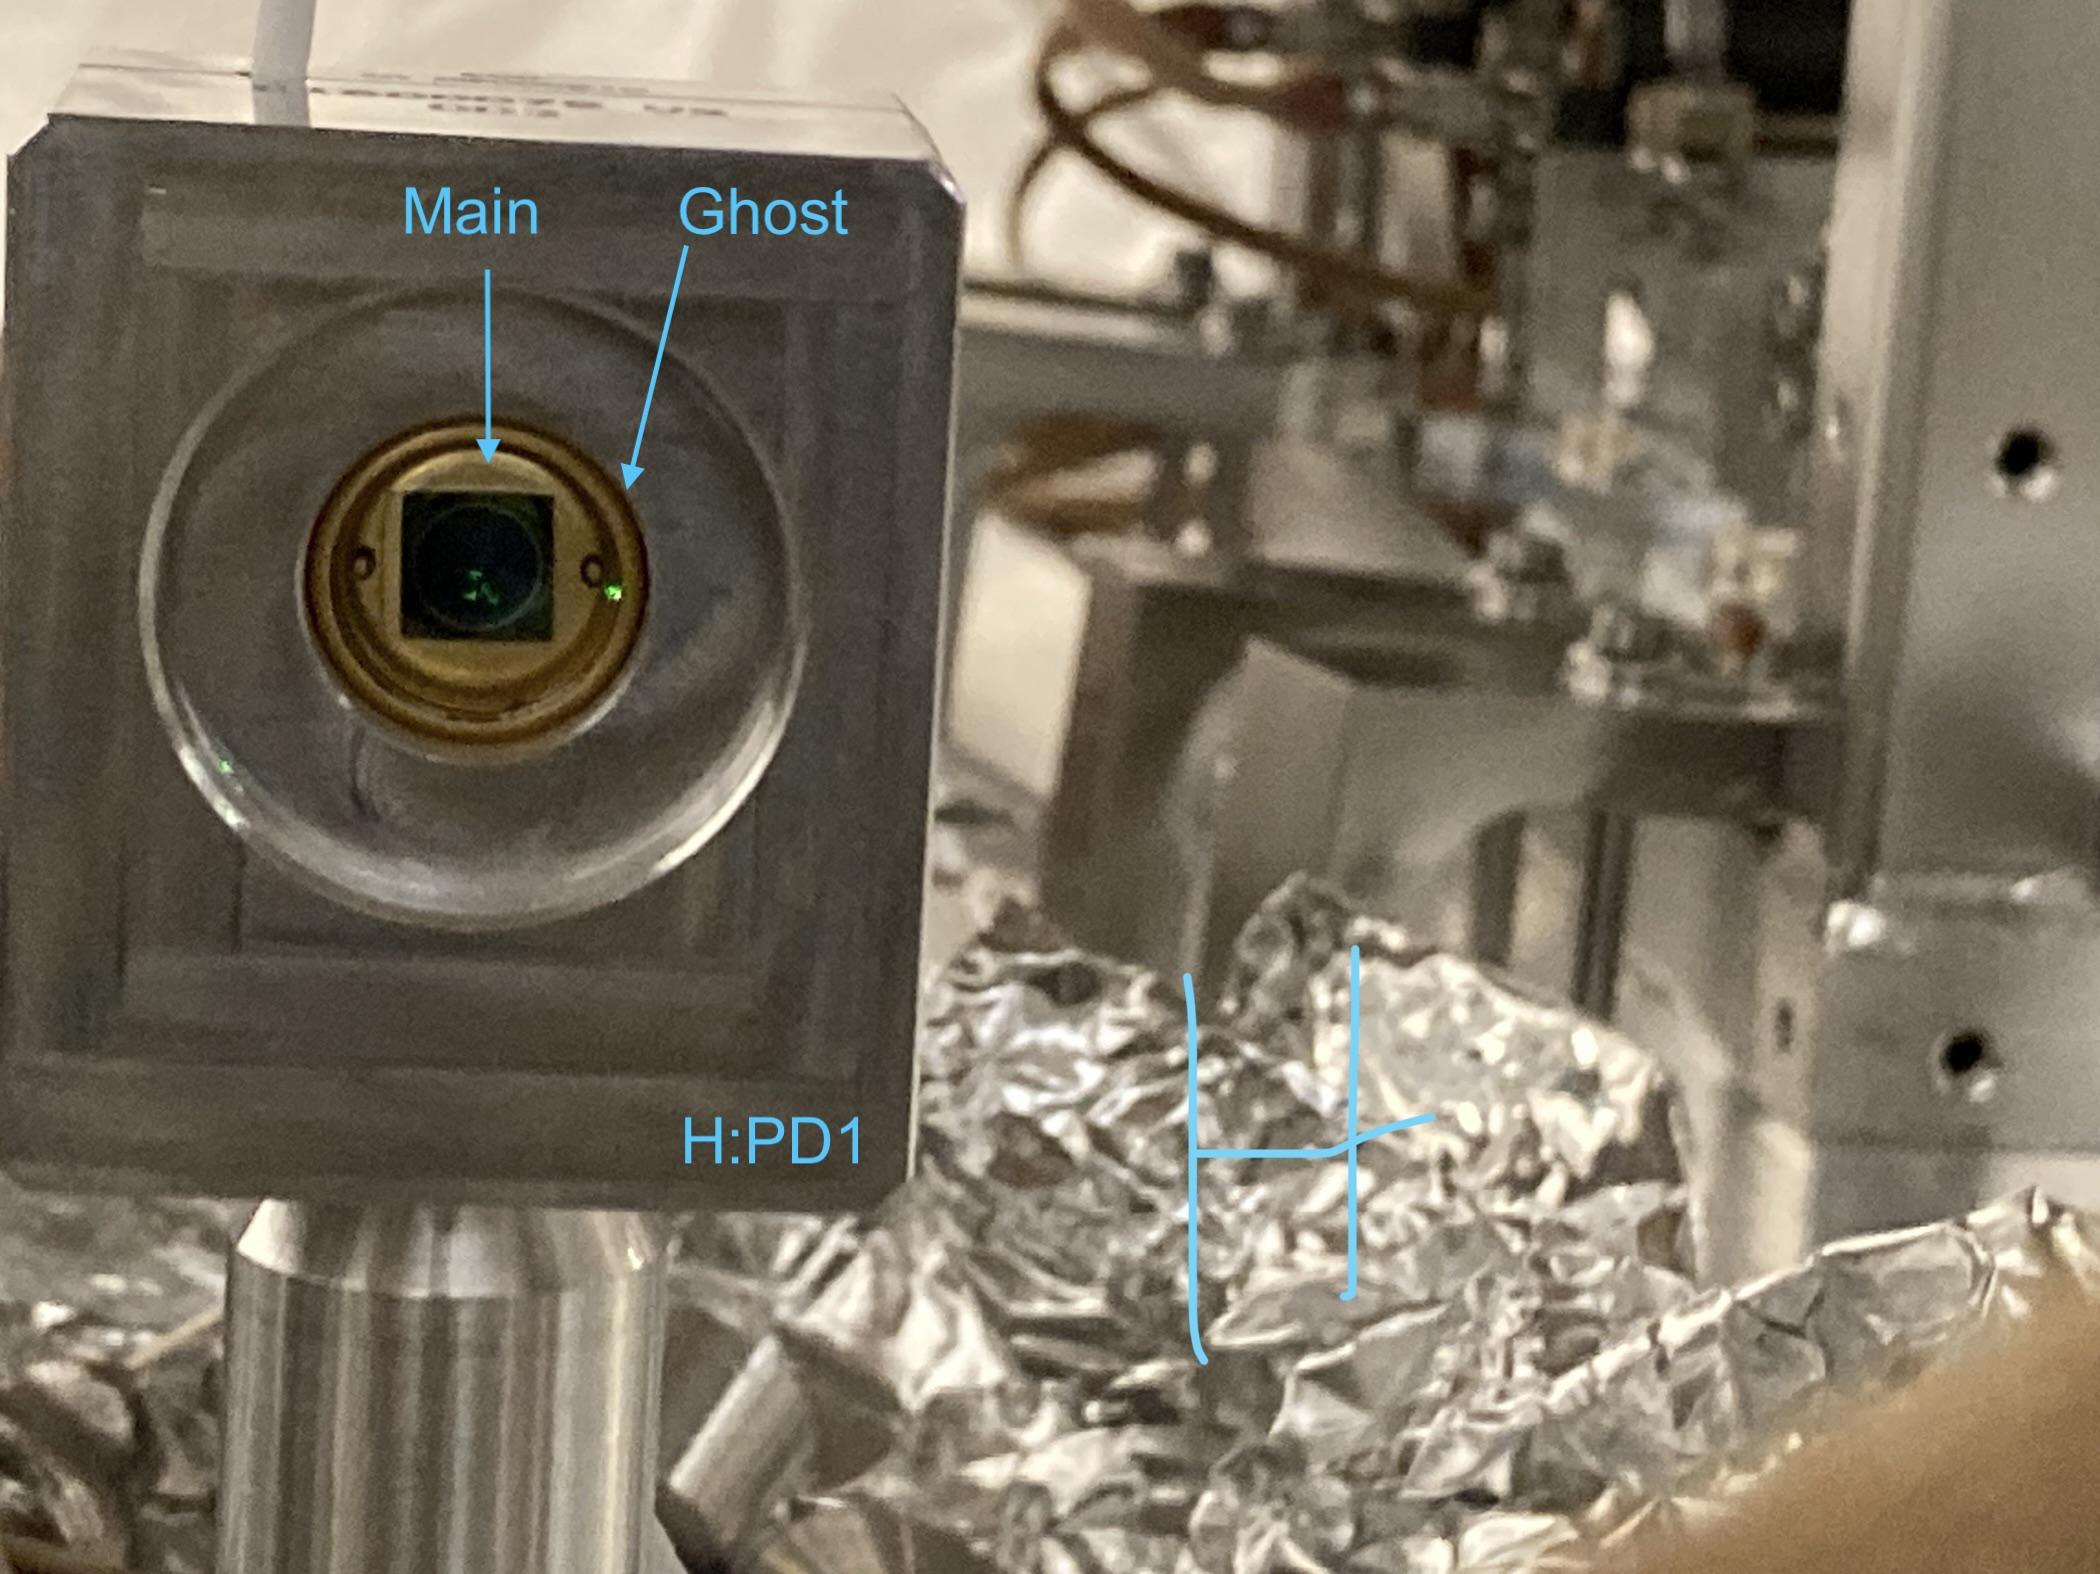
Attached are photos of the beams on the three diodes. F:PD1, G:PD1 and H:PD1 which has a known ghost beam next to it, as in 60185

Images attached to this comment
H1 SQZ
eric.oelker@LIGO.ORG - posted 08:16, Thursday 23 July 2026 (91205)
More HAM7 astigmatism analysis

I went back through more of the recent mode matching measurements in HAM7 to help us track how the changes we're making are impacting the astigmatism of the squeezed field going into the interferometer.

Below I tabulate the 1D overlap between the vertical and horizontal q parameters.  Since the PSAM settings seem to cause higher order aberrations in addition to astigmatism, I also tabulate the M2 values for each set of measurements, though its less clear what we can conclude from the M2 parameter alone since it doesn't tell us what higher order mode content is being generated by the PSAMs.


Jun 26:  aLog 90783

For this set of measurements, we were using the nominal setting for the ZM2 PSAM and taking measurements on SQZT7 after the beam diverter using the Thorlabs beam profiler.

XY 1D overlap:

ZM4\ZM5 SG (V) -4.5 -2.0 0 2.0
2.0 0.995 0.996 0.990 0.991
4.0 0.996 0.994 0.992 0.991
6.0 0.995 0.995 0.993 0.993
8.0

0.995

0.994 0.994 0.994

M2:

ZM4\ZM5 SG (V) -4.5 -2.0 0 2.0
2.0 1.35, 1.32 1.27, 1.23 1.17, 1.18 1.17, 1.19
4.0 1.33, 1.29 1.24, 1.21 1.16, 1.16 1.16, 1.17
6.0 1.32, 1.29 1.22, 1.20 1.16, 1.16 1.16, 1.17
8.0 1.31, 1.27 1.20, 1.19 1.16, 1.16 1.17, 1.18

It appears that the astigmatism gets worse for higher values of the ZM5 strain but the M2 gets better.  The dependence on ZM4 is less obvious, but that is expected since the beam spot size on ZM4 is only 1 mm.


Jun 30:  alog 90827 For this set of measurements, we were measuring the beam using a pickoff mirror between ZM4 and ZM5.  Given that we don't expect ZM4 to have that large of an impact due to the small spot size, one assumes that the astigmatism and M2 values will be similar to the data right before ZM4 taken on Jun 29:  see the data in alog 90815 and the analysis in alog 91185

Oddly, it doesn't work out this way.  The astigmatism still seems worse when ZM2 is changed from its nominal value, but the astigmatism coming from ZM2 (assuming that is the source) seems lower in this dataset than in the Jun 29 dataset.  However, the M2 values are significantly higher.  Perhaps there's some hysterisis or other non-stationarity in the astigmatism and higher order abarations coming from the PSAMs?  This seems plausible for a strain induced effect like this.  

Another possibility is that the beam was clipping somewhere.  That could explain a high M2 value.  Unfortunately, that sort of thing can happen with an improvised pick-off path like this one.

Data with ZM2 = 3.15 V

ZM4 SG (V) 1D Overlap X/Y M2
2.0 .995 1.78, 1.73
4.0 .999 1.81, 1.73
6.0 .999 1.84, 1.75
8.0 .998 1.90, 1.81


Data with ZM2 = 4.5 V

ZM4 SG (V) 1D Overlap X/Y M2
6.2 .986 1.79, 1.64


Jun 30_2:  alog 90841

This dataset looks at the mode after the beam diverter.  The ZM2 setting has been changed to 2.4 V for most of this dataset, a value which may give improved mode matching into the Filter cavity.  We expect that changing the ZM2 settings will impact the beam quality at this location.  This dataset is difficult to compare with the others since there isn't much overlap in the settings. The M2 values after ZM5 look much better than in the data taken before ZM5 earlier in the day.  Odd, since higher order aberrations aren't something that can be easily undone.

Data with ZM2 = 2.4 V

ZM4, ZM5 SG (V) 1D Overlap X/Y M2
2.0, 0.8 .993 1.24, 1.26
4.0, 0.8 .991 1.20, 1.23
4.0, 2.0 .997 1.33, 1.30
6.0, 2.0 .992 1.30, 1.30

Data with ZM2 = 3.15 V

ZM4, ZM5 SG (V) 1D Overlap X/Y M2
2.0, 4.4 .998 1.39, 1.32


July 10: alog 90986

These measurements were taken after the beam diverter on SQZT7 shortly after the ZM4 preloading was adjusted.  In the first two measurements, the beam spot postion on ZM2 is varied to see the impact on the outgoing mode:

ZM2 Spot Position 1D Overlap X/Y M2
5.85" (nominal) .995 1.35, 1.35
5.75" .997 1.28, 1.25

Centering the spot better does seem to improve things a bit.  

Next, they did a sweep of ZM4 and ZM5 with the new ZM4 preloading.  It is unclear from the aLog which ZM2 spot position was used for this dataset.  Note that the ZM5 strain gauge was broken for this measurement, so I record the bias voltage for ZM5 instead

ZM4 SG, ZM5 Bias (V) 1D Overlap X/Y M2
-4.1, 20 .997 1.41, 1.34
-4.1, 100 .995 1.31, 1.28
-2.9 , 100 .996 1.29, 1.26
-1.1, 100 .996 1.28, 1.25
-1.1, 20 .996 1.37, 1.33
1.0, 100 .996 1.26, 1.23
2.7 , 100 .995 1.25, 1.23
2.7, 20 .997 1.37, 1.31
LHO General
ryan.short@LIGO.ORG - posted 07:44, Thursday 23 July 2026 (91204)
Ops Day Shift Start

TITLE: 07/23 Day Shift: 1430-2330 UTC (0730-1630 PST), all times posted in UTC
STATE of H1: Planned Engineering
OUTGOING OPERATOR: None
CURRENT ENVIRONMENT:
    SEI_ENV state: CALM
    Wind: 9mph Gusts, 6mph 3min avg
    Primary useism: 0.01 μm/s
    Secondary useism: 0.16 μm/s 
QUICK SUMMARY: Work continues towards DRMI locking today. JAC and IMC were left offline overnight, and there was a short stint in EQ mode since sensor correction is still on.

H1 IOO
jennifer.wright@LIGO.ORG - posted 17:32, Wednesday 22 July 2026 - last comment - 16:33, Thursday 23 July 2026(91199)
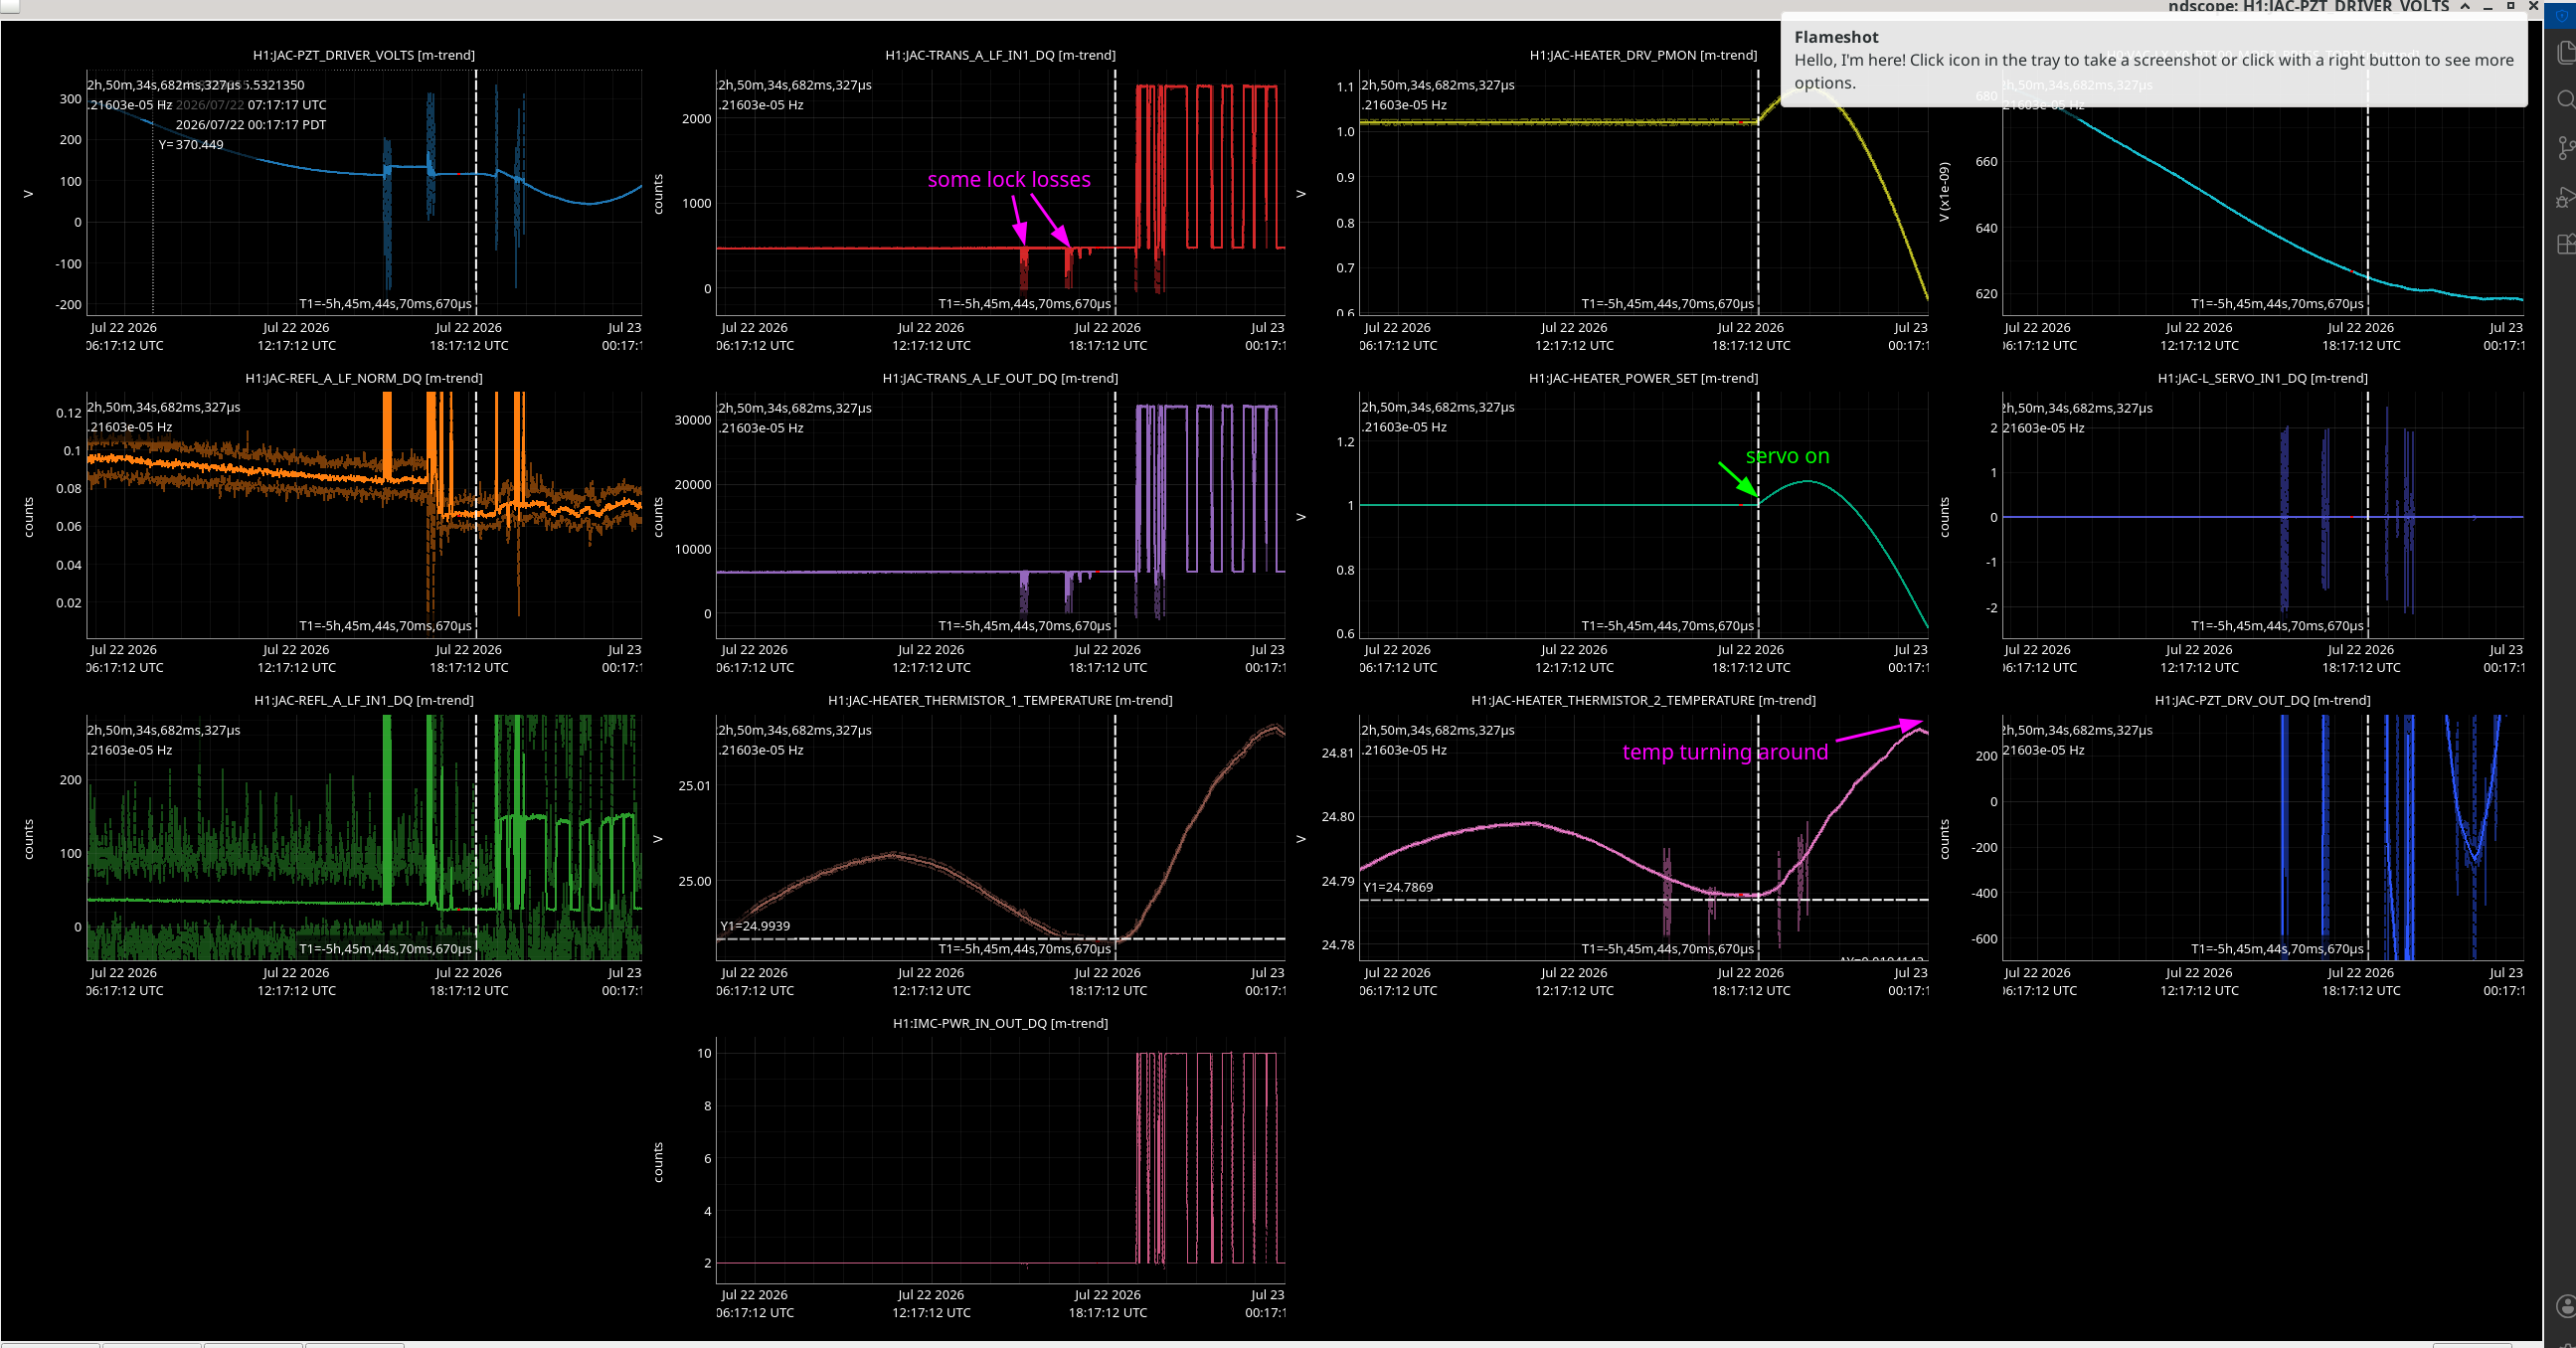
JAC Heater Guardian Take 2

I tried the heater guardian today with a gain of 0.003 and a set point of 25 degrees seeing as it seems to have reached equilibrium around this value with no loop running and 1W input overnight. It looks like it overshot initially and is turning around and coming back to the set point of 25 degrees C now. Thermistor 1 is the loop sensor but I have marked the turning point on thermistor 2 in the attached picture. We still have some range on the PZT actuator (JAC-PZT_DRIVER_VOLTS is low rate channel from Beckhoff voltage driver and JAC-PZT_DRV_OUT_DQ is front-end PZT feedback channel for fast feedback) and the temperature actuator (JAC-HEATER_POWER_SET). I will get the operator to switch it off when they leave so we don't cause any pressure spikes overnight.

Images attached to this report
Comments related to this report
jennifer.wright@LIGO.ORG - 16:33, Thursday 23 July 2026 (91223)

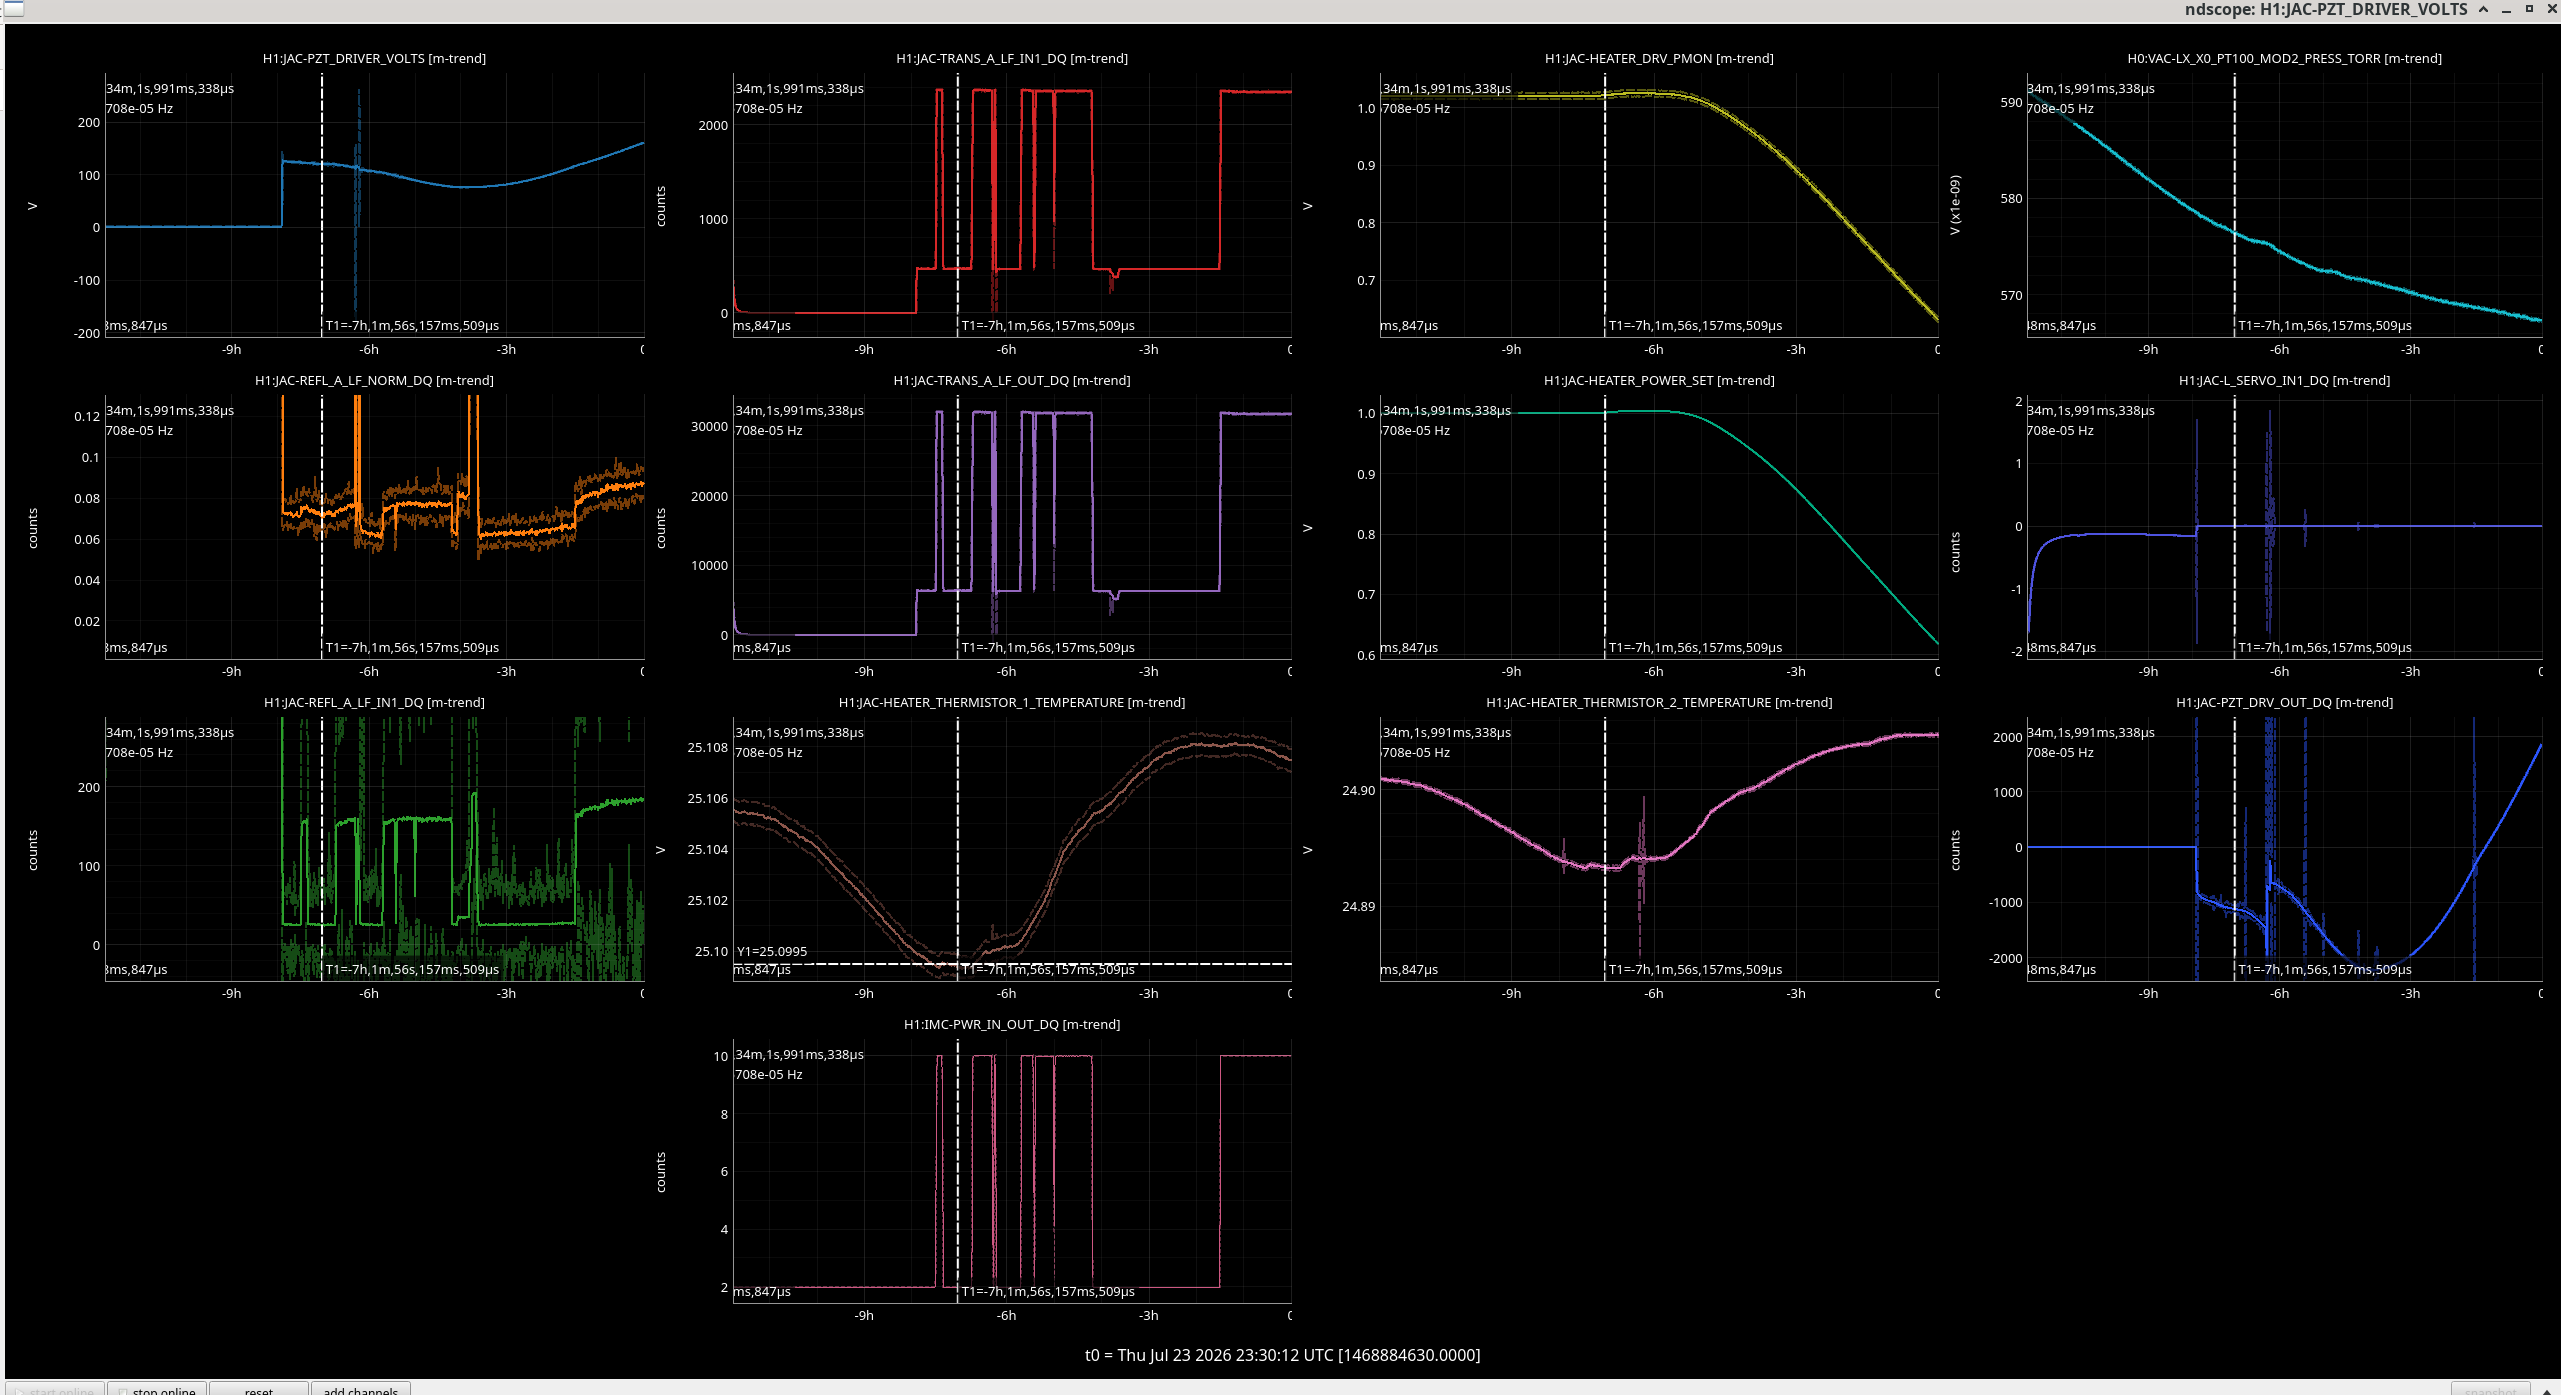
I did another test today with the same gain but the set point at 25.1 degrees C (the temperature of the thermistor 1 when I switched it on). It still overshot so we might want to test with a lower gain but it stopped the JAC from unlocking due to the PZT running out of range.

Attached is the trends from today (vertical cursor when i switched on the controller, horizontal showing the setpoint on the thermistor).

Summary: let's test tomorrow with a smaller gain.

Images attached to this comment
H1 SEI (SPI)
arnaud.pele@LIGO.ORG - posted 15:54, Wednesday 22 July 2026 - last comment - 16:27, Wednesday 22 July 2026(91194)
SPI QPD A PIT works and measures HAM3 tilt during excitation

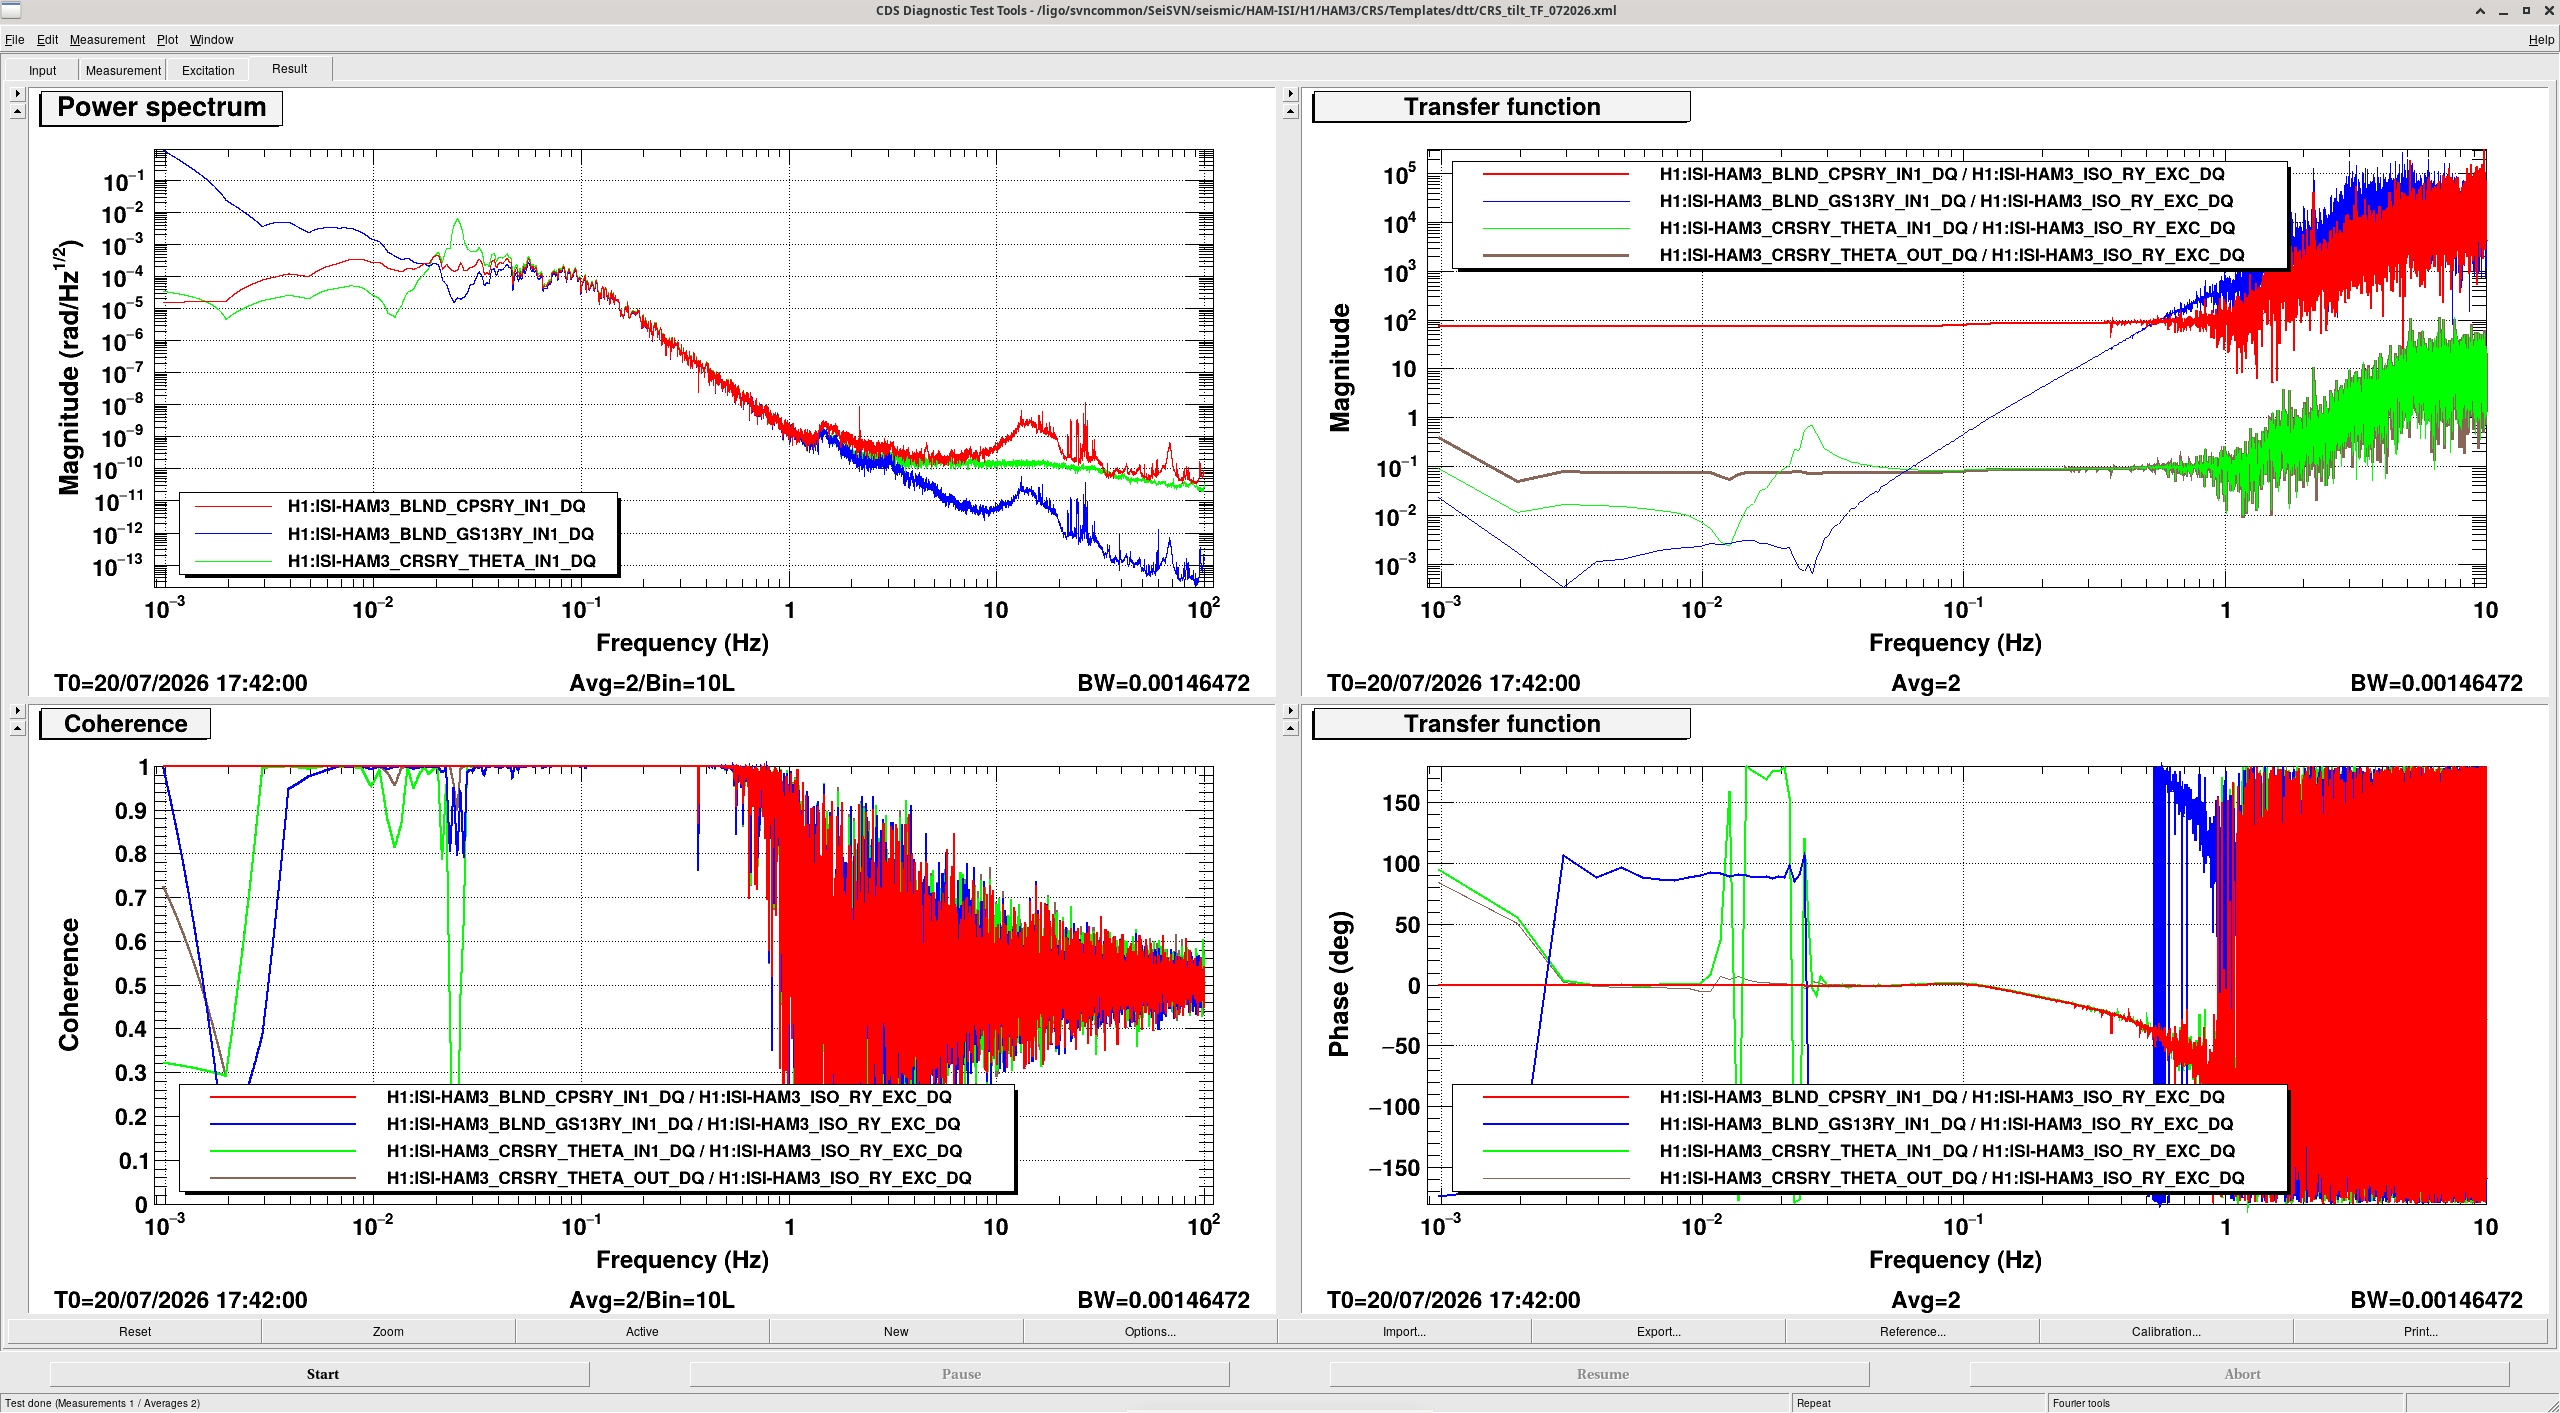
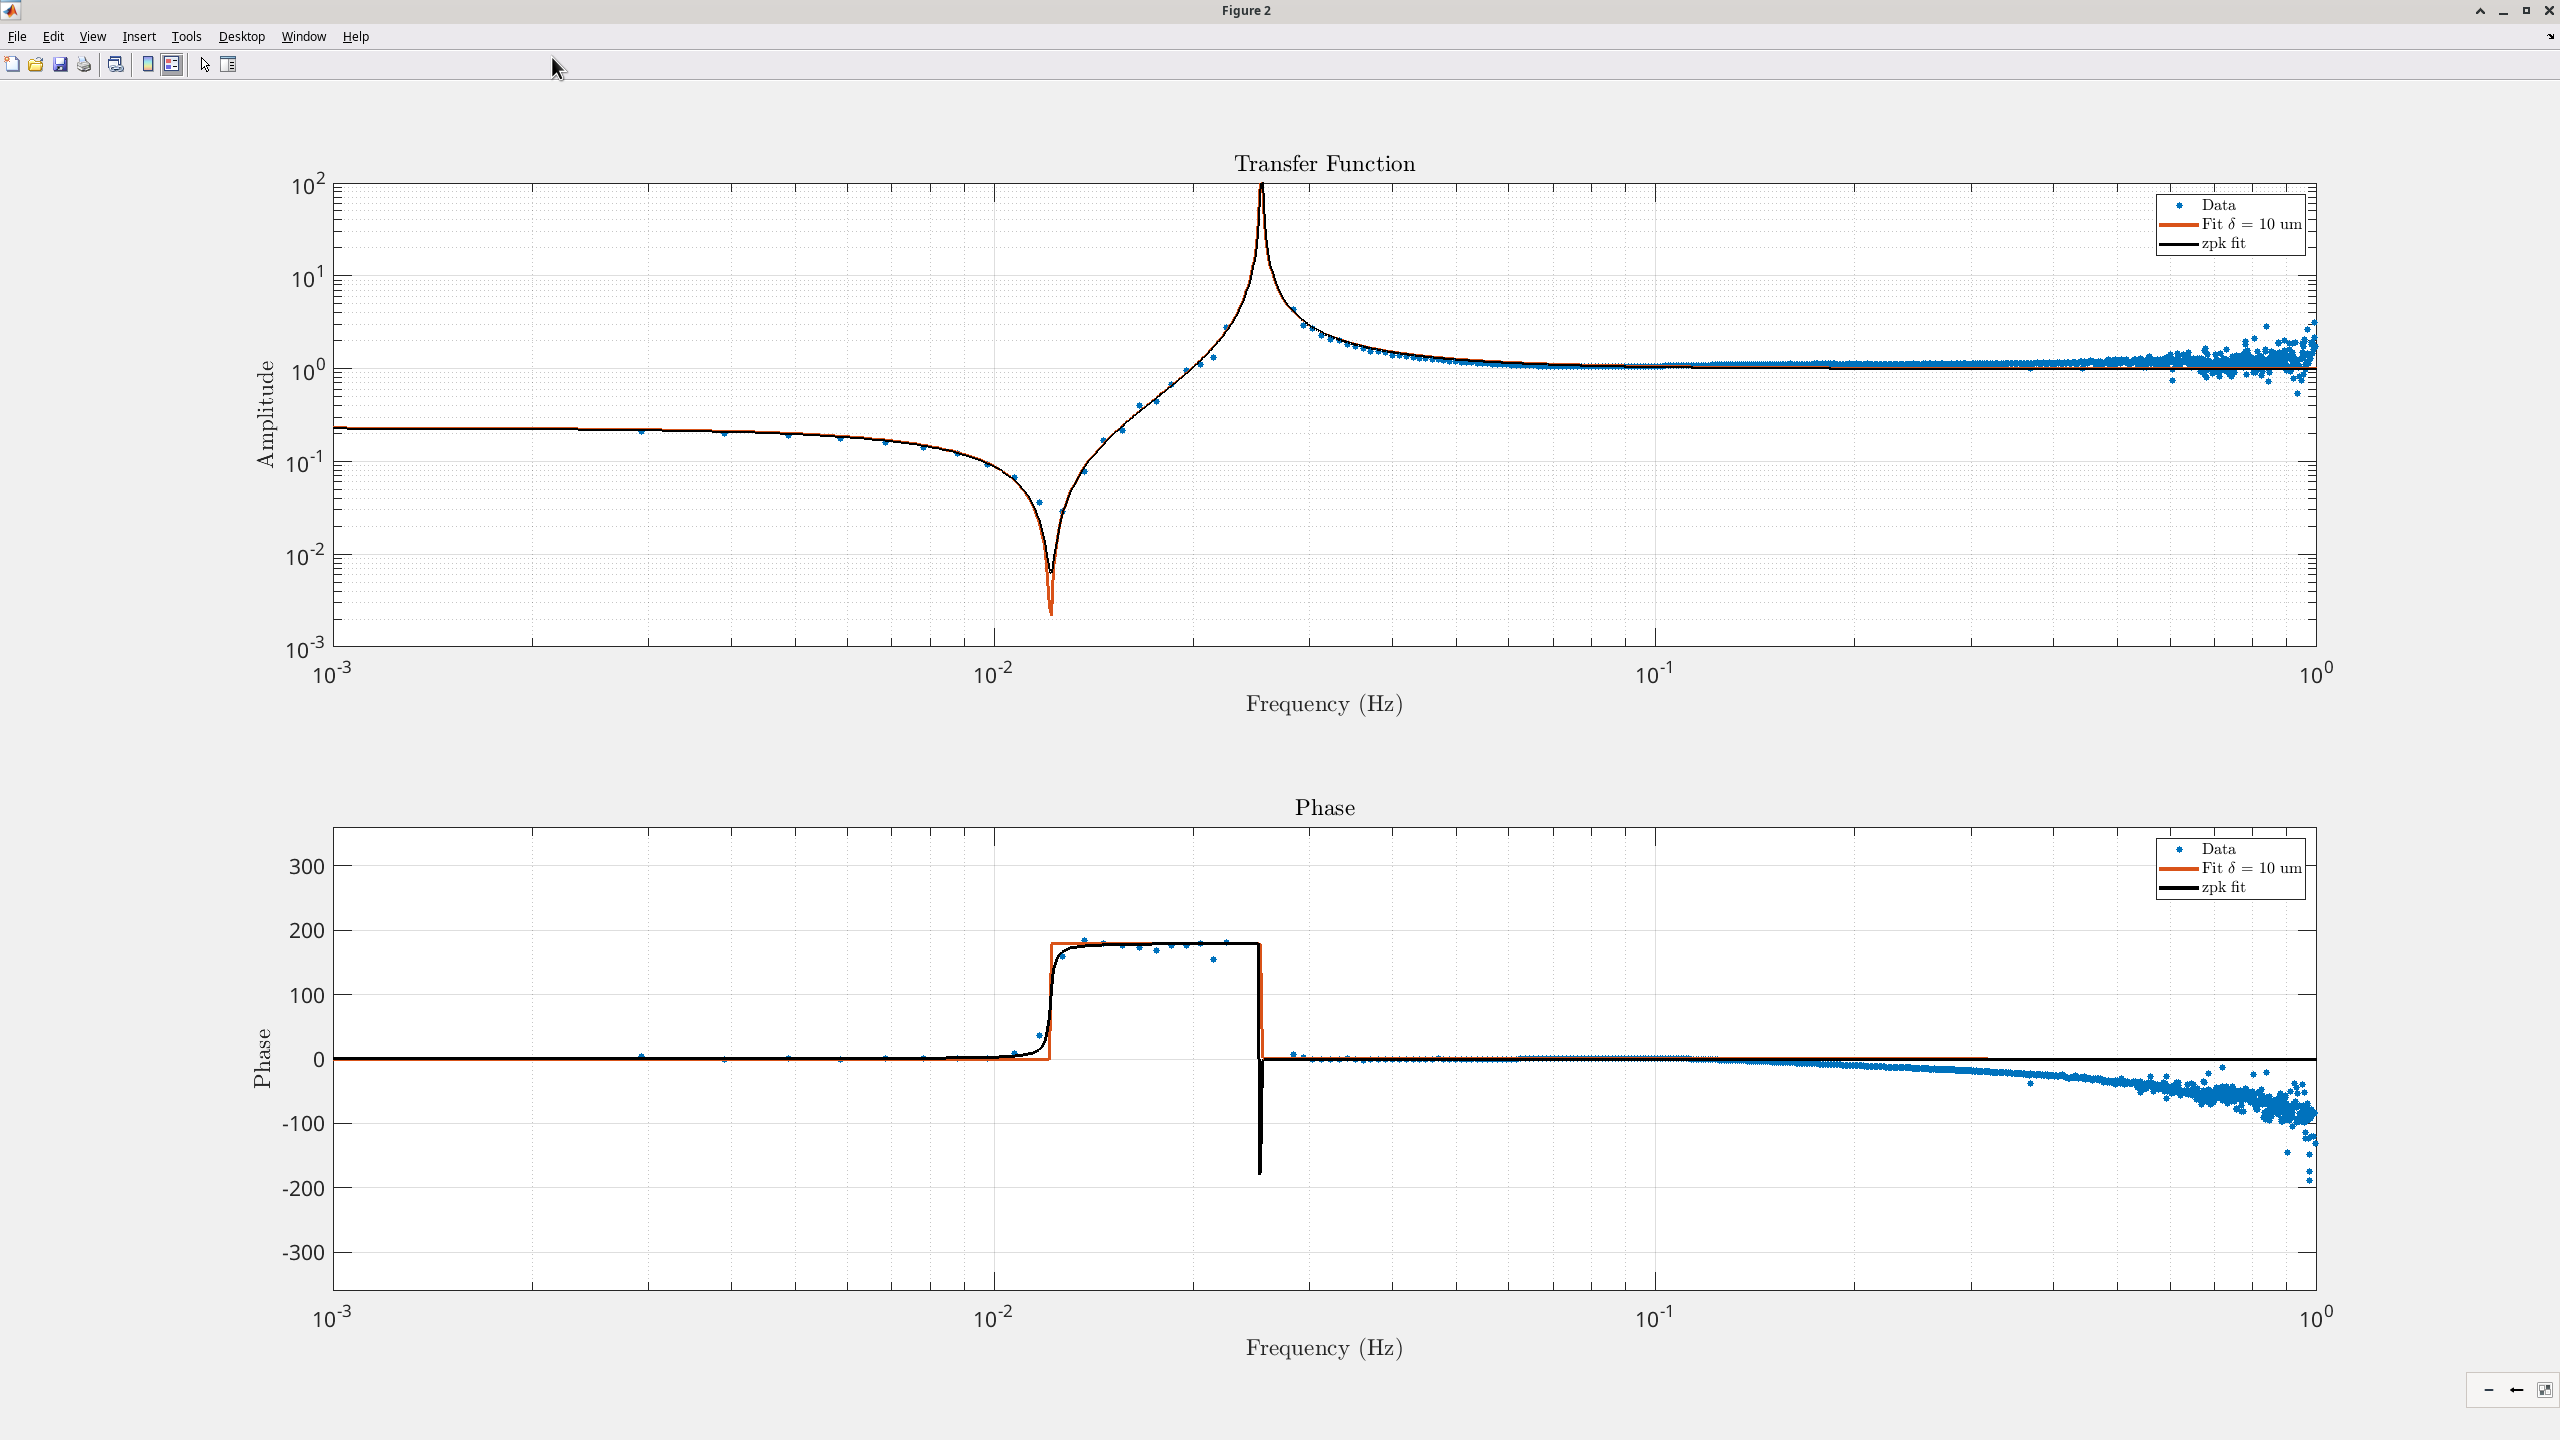
On Monday Shoshana and Jim took a low-resolution tilt Ry-Ry TF of HAM3 with the ISI in the damped state (Shoshana will post another alog focused on the CRS). We included the SPI QPDA PIT on this measurement to get a sense if it's measuring HAM3 pitch, as we expect.

After applying a calibration gain of 240urad/cts (and a minus sign, and the antiwhitening filter from 91157) on the oplev signal, the transfer function matches the one for the CPS and CRS well at low frequencies. This is a good first order validation that QPD A Pitch is sensing HAM3 Tilt. 

Non-image files attached to this report
Comments related to this report
arnaud.pele@LIGO.ORG - 16:27, Wednesday 22 July 2026 (91196)SPI

I also took a spectrum comparing the SPI QPD A (with applied calibration from above) and compared the ambiant spectra with the CRS and GS13 on HAM3. 

The time used for this analysis was during the SC test from this last weekend (91111), with both HAM2 and HAM3 ISI isolated, and after the beam was recentered on the QPD (91124).

The SPI spectra looks like it is not measuring the ISI ambient tilt. The spectra looks flat and there is little to no coherence with either the GS13 or the CPS from HAM3. Assuming this is noise, it seems 100x higher than the expected noise from p20 of G2301177 (few*1e-10rad/rtHz)

The template for this measurement lives under : /ligo/svncommon/SeiSVN/seismic/HAM-ISI/H1/HAM3/CRS/Templates/dtt/CRS_SPI_spectra_071826.xml

Non-image files attached to this comment
H1 SEI
shoshana.apple@LIGO.ORG - posted 15:16, Wednesday 22 July 2026 - last comment - 13:10, Monday 27 July 2026(91179)
CRS Commissioning Updates

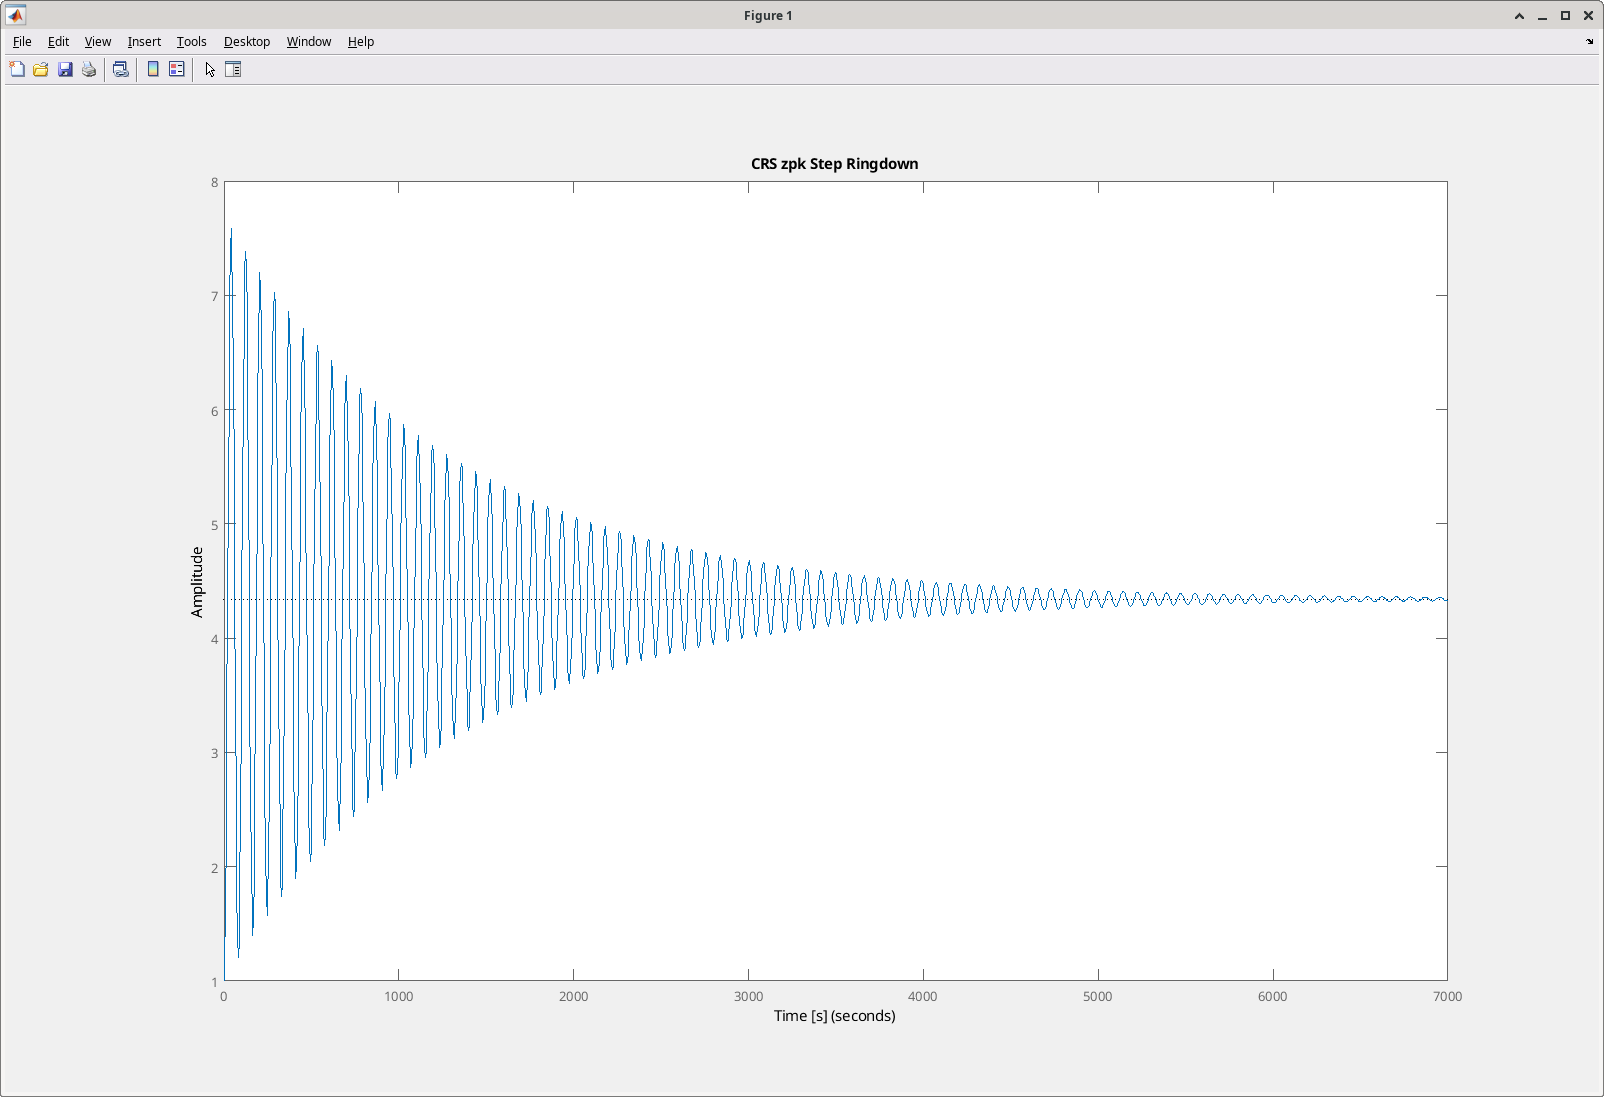
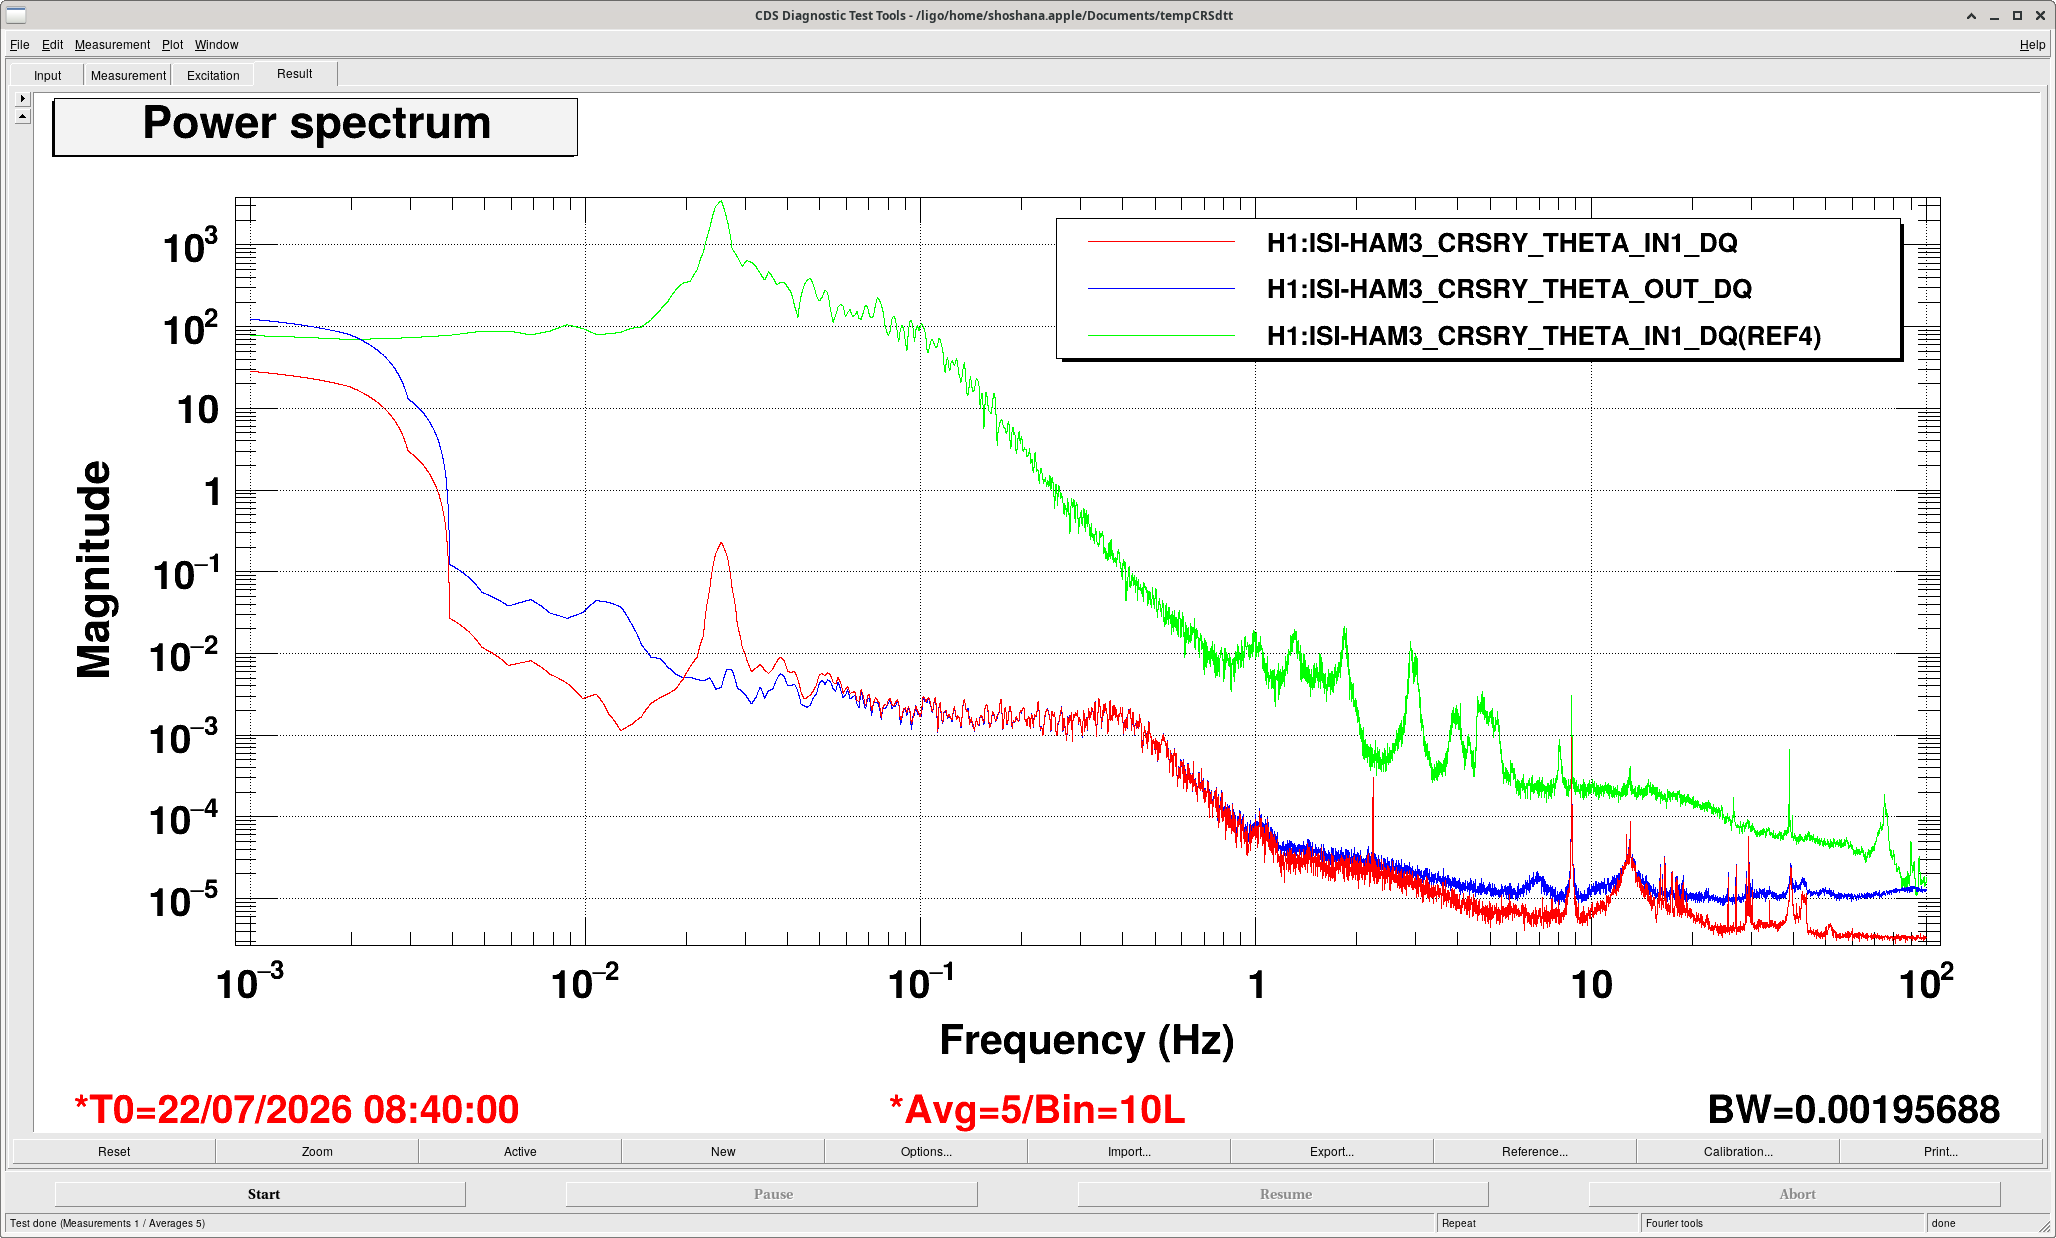
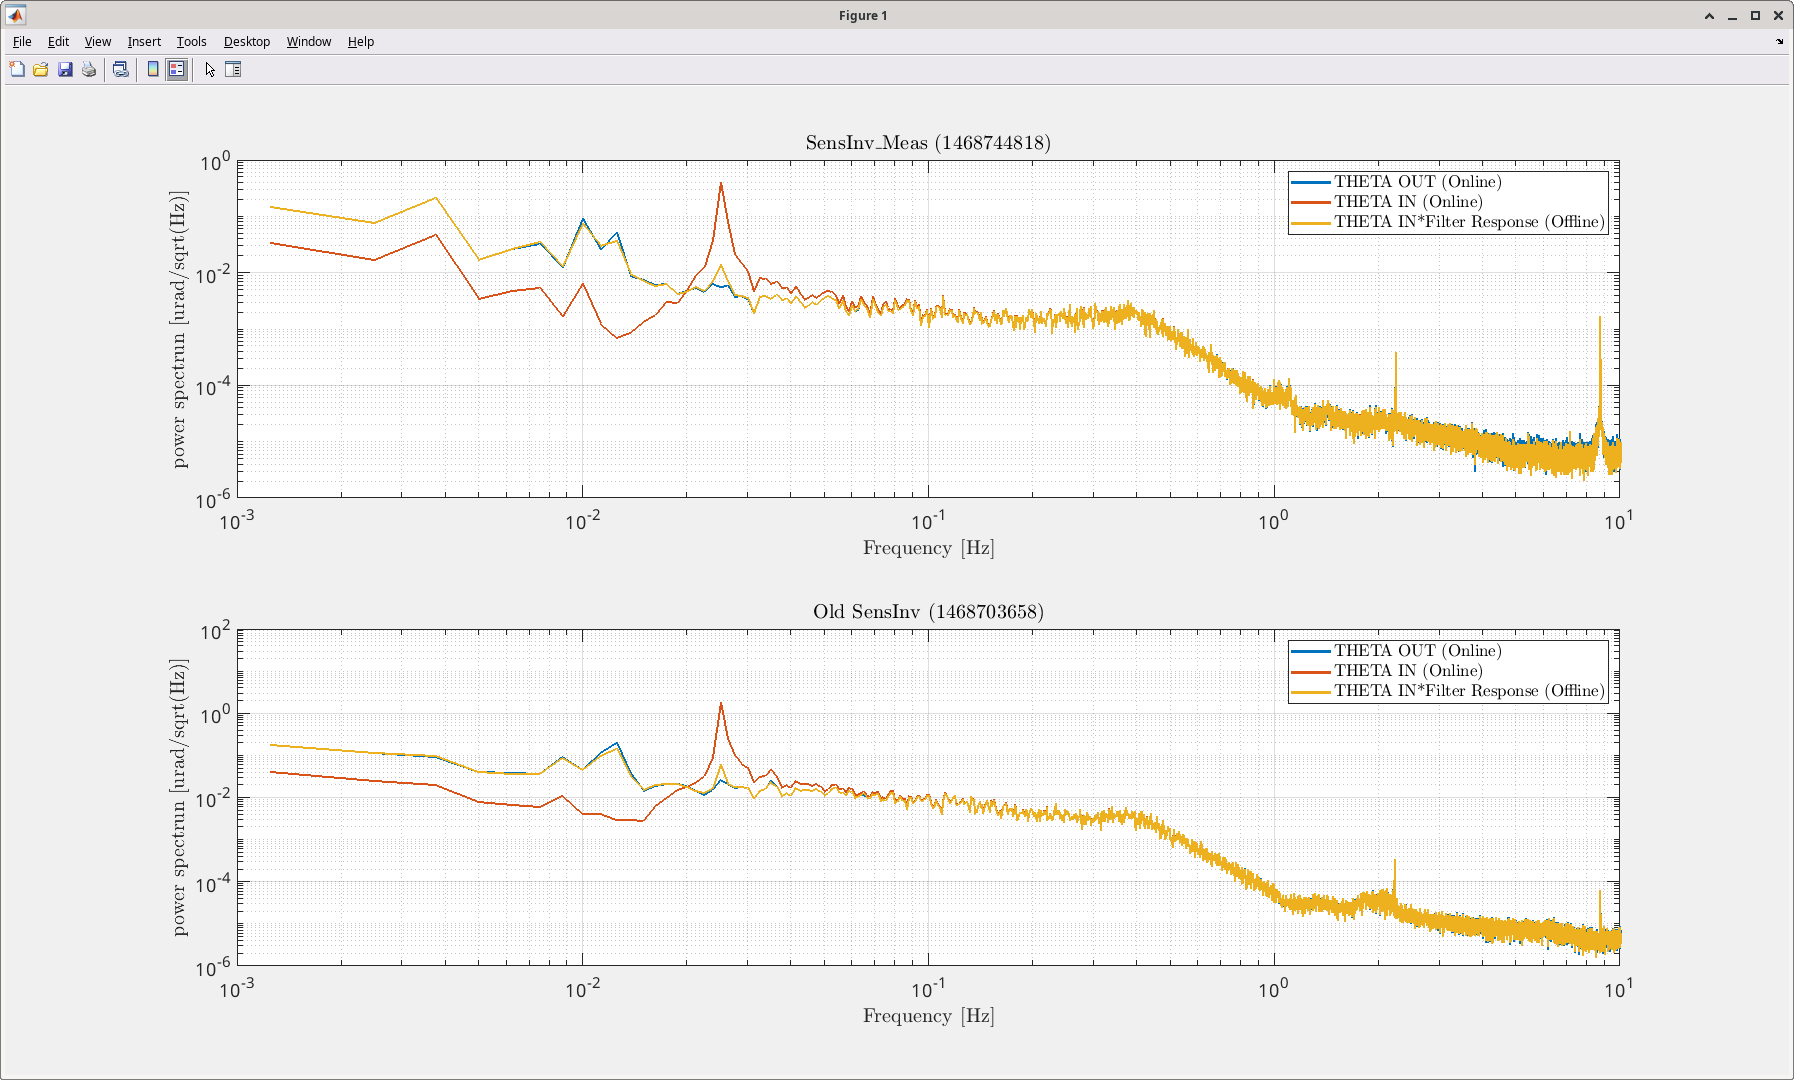
We been commissioning the CRS this week, so far we've done a tilt to tilt measurement:

Summary:

Images attached to this report
Comments related to this report
shoshana.apple@LIGO.ORG - 13:10, Monday 27 July 2026 (91257)

Made some adjustments to the CRS_TransferFunction code which generates the SensInv filter.

  • Changed zero Q 50-->30
  • Fixed an issue where we weren't normalizing the CRS TF data to the CPS TF data.
    • Removed a factor of 12.5 orignally used for calibration rather than normaizing to CPS
    • Paramter changes: delta= 1.04e-5m-->1.05528e-05m, w0= 0.0222Hz-->0.0222222Hz, wR/(2pi) = 0.0253Hz--> 0.0254Hz, wg=0.0764Hz-->0.0.0771
  • Put new filter in the 2nd spot in the bank, called SensInv_Meas


Filter is saved in : /ligo/svncommon/SeiSVN/seismic/HAM-ISI/H1/HAM3/CRS/Filters/ CRS_SensInv_Filter.mat


LHO General
ryan.short@LIGO.ORG - posted 15:12, Wednesday 22 July 2026 - last comment - 17:41, Wednesday 22 July 2026(91195)
Ops Day Shift Summary

TITLE: 07/22 Day Shift: 1430-2330 UTC (0730-1630 PST), all times posted in UTC
STATE of H1: Planned Engineering
INCOMING OPERATOR: Ibrahim
SHIFT SUMMARY: Work continued on aligning the IFO towards the goal of locking DRMI after a morning of running various SUS and SEI measurements. The LVEA remains Laser HAZARD and End X is also HAZARD for the afternoon.
LOG:

Start Time System Name Location Lazer_Haz Task Time End
14:42 FAC Kim LVEA - Technical cleaning 15:13
15:13 FAC Kim EX - Technical cleaning 16:31
16:23 PEM Robert, Miranda, Shrey Overpass - Seismometer tests 18:20
16:28 SEI Jim LVEA - HAM2 L4C cabling 17:10
16:28 VAC Jordan, Gerardo MY - Pumping on LN2 dewar 17:15
16:31 FAC Kim LVEA - Technical cleaning 17:11
16:35 TCS Madi OptLab - HWS lens testing 18:16
17:39 SUS Rahul LVEA - Unlocking ZM5 17:58
17:39 TCS Camilla OptLab - HWS lens testing 18:16
17:47 CDS Dave Remote - DAQ restart 18:00
18:00 SUS Rahul CR - ZM2 TFs 18:17
18:17 SEI Jim CR - HAM3 ISI measurements 19:05
18:21 VAC Jordan, Gerardo LVEA - Corner RGA work 18:58
18:51 TCS Camilla PrepLab - Cleaning up 19:51
19:07 EPO Robert +1 LVEA - EPO pictures 20:03
20:02 ISC Sheila LVEA Y ISCT1 alignment 20:50
20:03 CAL Tony EX - Grabbing something 20:32
20:16 ISC Jennie LVEA Y ISCT1 alignment 20:51
20:16 VAC Jordan MY - Checking pumps 20:36
20:32 SAF Fil LVEA - Checking interlock electronics 21:51
20:56 SUS Oli LVEA - Turning on BS sat amp whitening 21:02
21:16 TCS Madi OptLab - Packing things up 21:48
21:37 SQZ Camilla LVEA Y HAM7 alignment Ongoing
21:54 TCS Madi, TJ EX Y HWS table work Ongoing
22:03 SAF Richard CER - Checking electronics Ongoing
Comments related to this report
ibrahim.abouelfettouh@LIGO.ORG - 17:41, Wednesday 22 July 2026 (91201)CDS

TITLE: 07/23 Eve Shift: 2330-0500 UTC (1630-2200 PST), all times posted in UTC
STATE of H1: Planned Engineering
INCOMING OPERATOR: None
SHIFT SUMMARY:

IFO is in DOWN for PLANED ENGINEERING

Not much to update after Ryan S's shift other than:

alog 91199 - JAC Guardian work

alog 91197 - new ZM2 Alignment

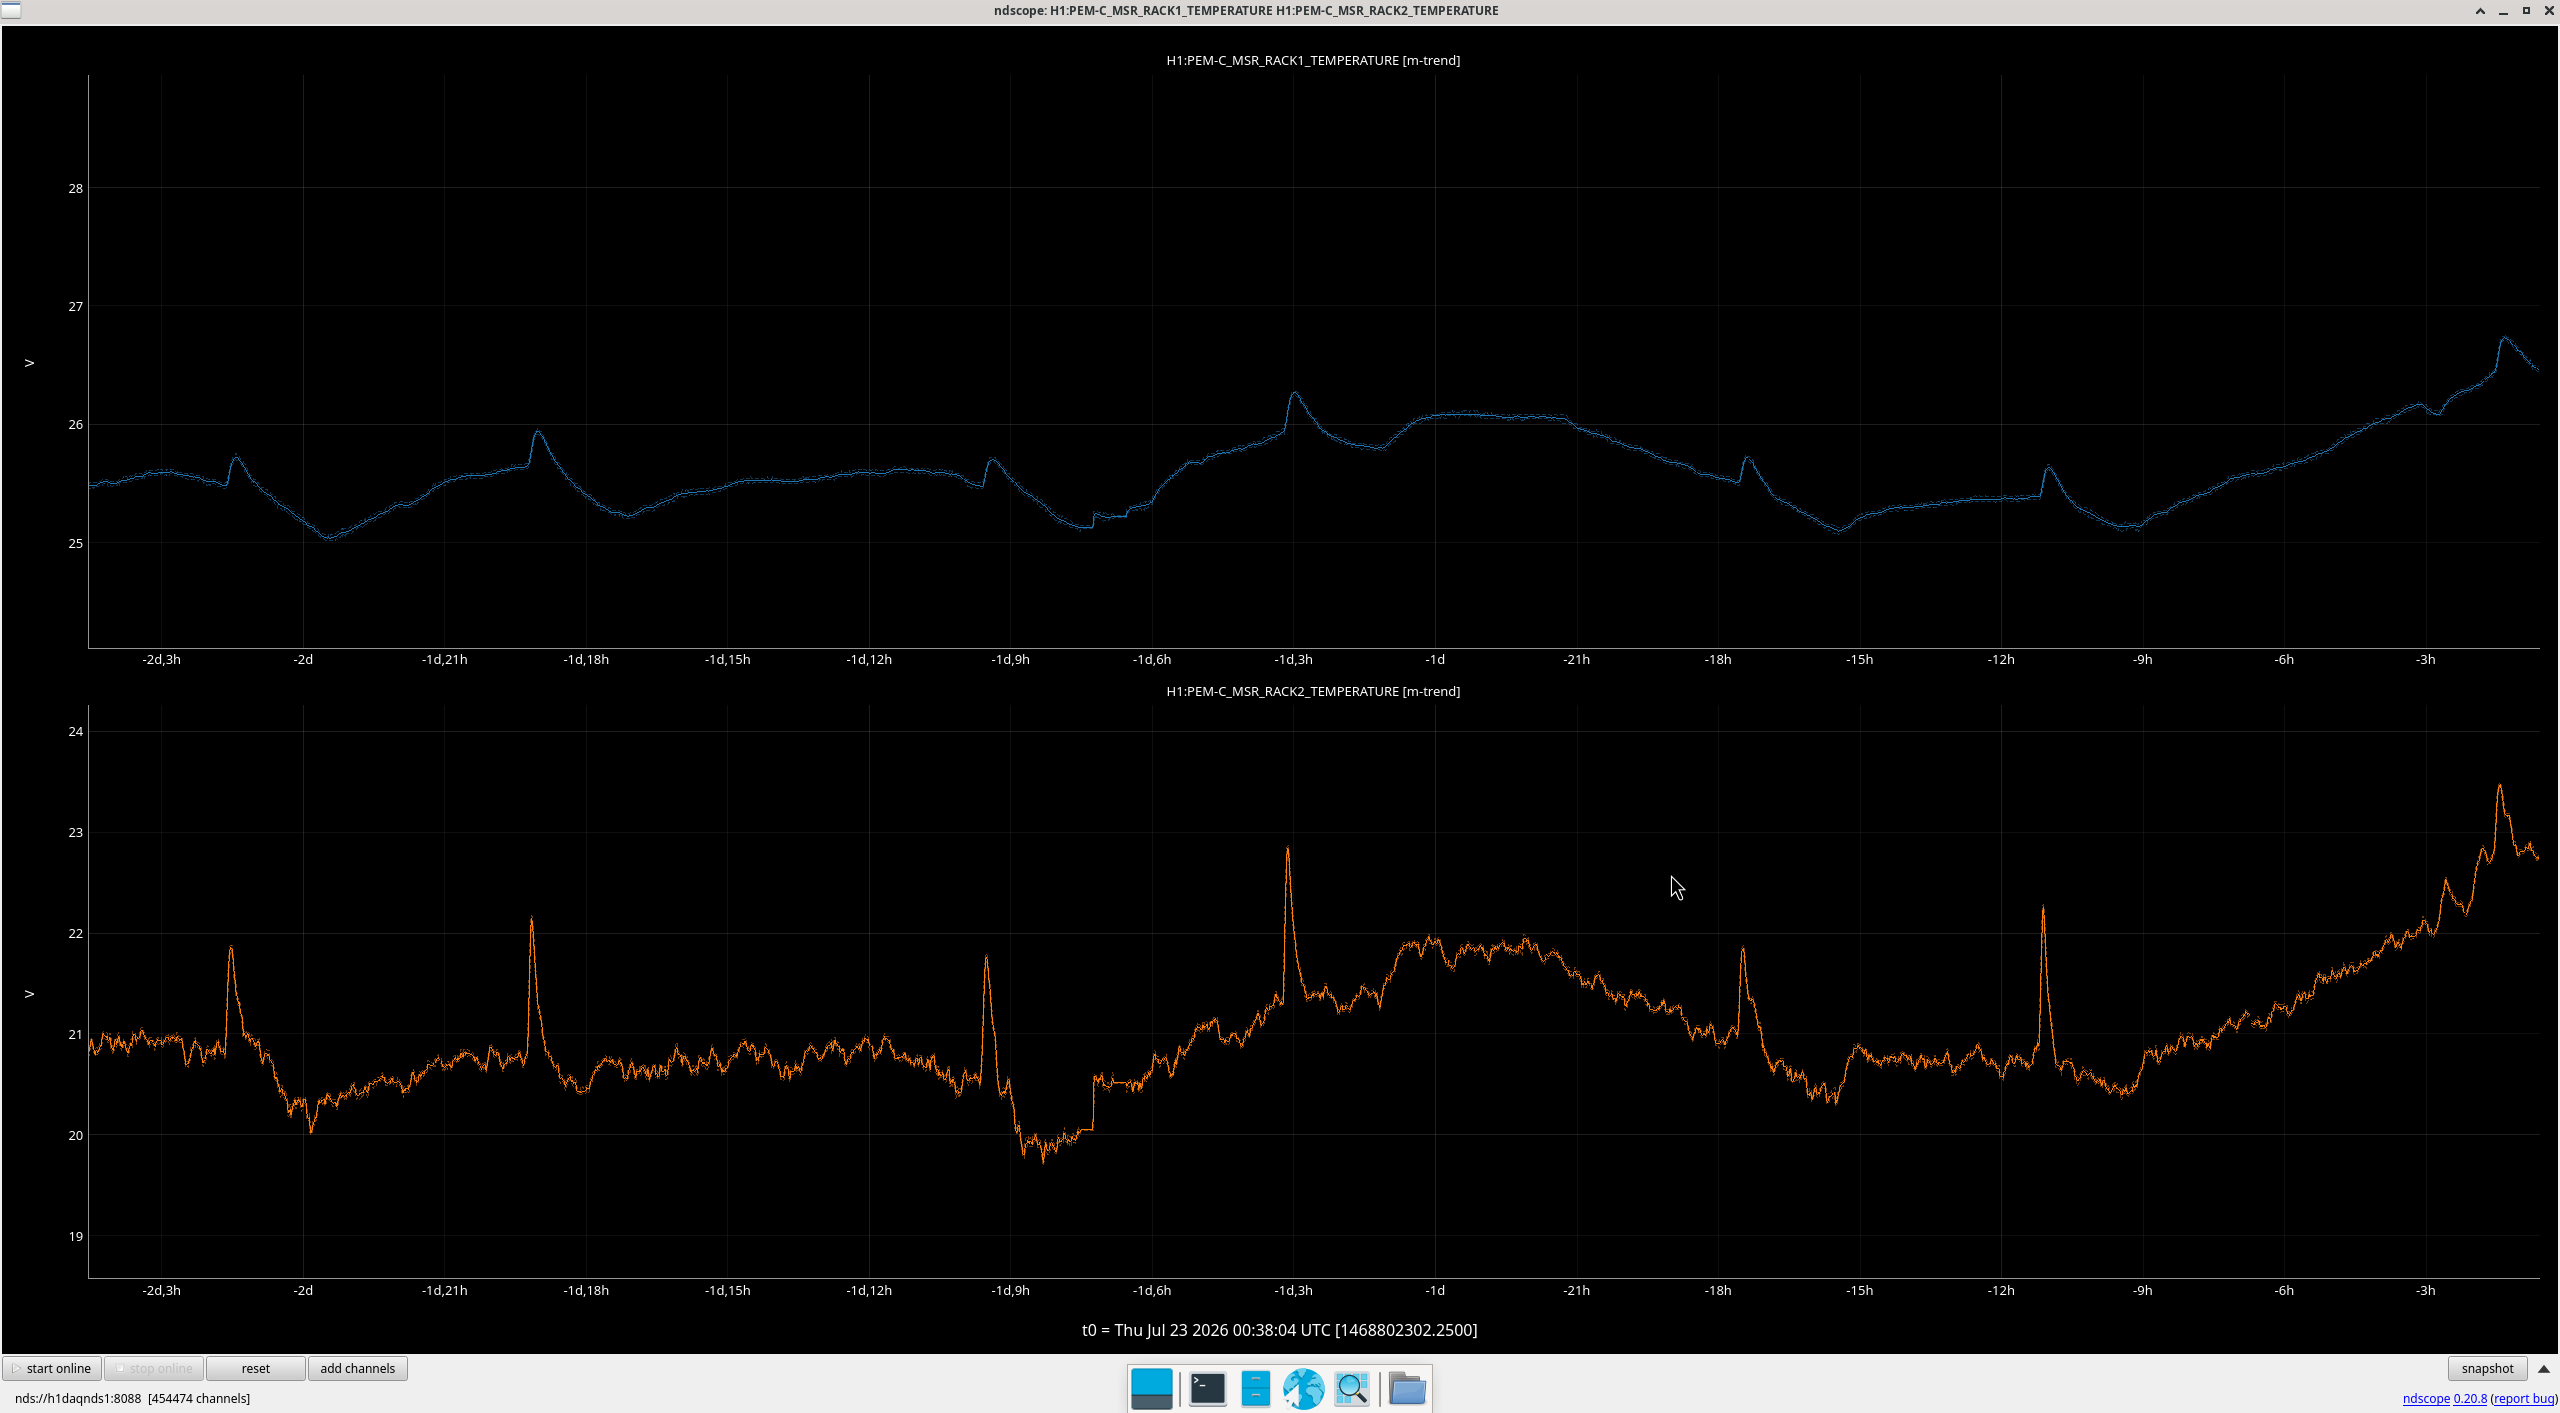
Additionally, Gerardo realized that MSR temperatures are spiking seemingly randomly. See attached. RACK2 is showing sharper peaks than RACK1, which implies that the heat source is near there? Tagging CDS in case it's an electronics issue.

LOG:

Start Time System Name Location Lazer_Haz Task Time End
14:42 FAC Kim LVEA - Technical cleaning 15:13
15:13 FAC Kim EX - Technical cleaning 16:31
16:23 PEM Robert, Miranda, Shrey Overpass - Seismometer tests 18:20
16:28 SEI Jim LVEA - HAM2 L4C cabling 17:10
16:28 VAC Jordan, Gerardo MY - Pumping on LN2 dewar 17:15
16:31 FAC Kim LVEA - Technical cleaning 17:11
16:35 TCS Madi OptLab - HWS lens testing 18:16
17:39 SUS Rahul LVEA - Unlocking ZM5 17:58
17:39 TCS Camilla OptLab - HWS lens testing 18:16
17:47 CDS Dave Remote - DAQ restart 18:00
18:00 SUS Rahul CR - ZM2 TFs 18:17
18:17 SEI Jim CR - HAM3 ISI measurements 19:05
18:21 VAC Jordan, Gerardo LVEA - Corner RGA work 18:58
18:51 TCS Camilla PrepLab - Cleaning up 19:51
19:07 EPO Robert +1 LVEA - EPO pictures 20:03
20:02 ISC Sheila LVEA Y ISCT1 alignment 20:50
20:03 CAL Tony EX - Grabbing something 20:32
20:16 ISC Jennie LVEA Y ISCT1 alignment 20:51
20:16 VAC Jordan MY - Checking pumps 20:36
20:32 SAF Fil LVEA - Checking interlock electronics 21:51
20:56 SUS Oli LVEA - Turning on BS sat amp whitening 21:02
21:16 TCS Madi OptLab - Packing things up 21:48
21:37 SQZ Camilla LVEA Y HAM7 alignment 23:27
21:54 TCS Madi, TJ EX Y HWS table work 23:28
22:03 SAF Richard CER - Checking electronics 22:16
22:25 TCS Ryan S LVEA Y HAM7 Alignment 23:27
22:34 VAC Jordan LVEA Y Corner RGA Work 23:46
22:38 VAC Gerardo LVEA Y Moving Pumping Equipment 23:46
22:38 ISC Sheila, Elenna LVEA Y ISCT1 Alignment, Sheila out at 22:57 UTC 23:09
23:27 PEM Robert, Volt EX, Roof N Videography 00:05
23:34 SEI Miranda Mechanical Room N Turning off seismometers 23:46
23:51 VAC Jordan MY N Turning off outdoor pump 00:05
Images attached to this comment
H1 AOS (IOO)
khanh.vu@LIGO.ORG - posted 15:00, Wednesday 22 July 2026 (91189)
Input Matrix Measurement on PZT and JM1
Jennie Wright, Khanh Vu

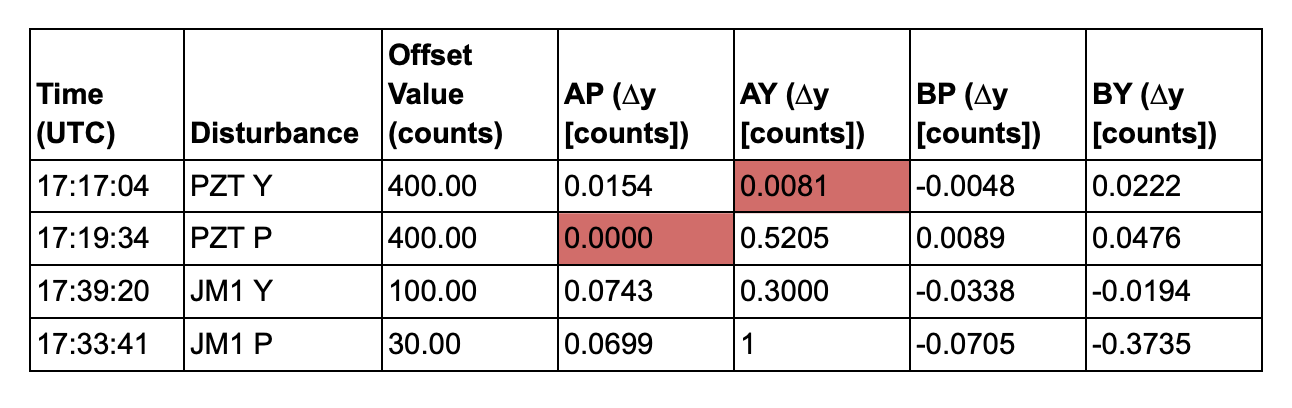
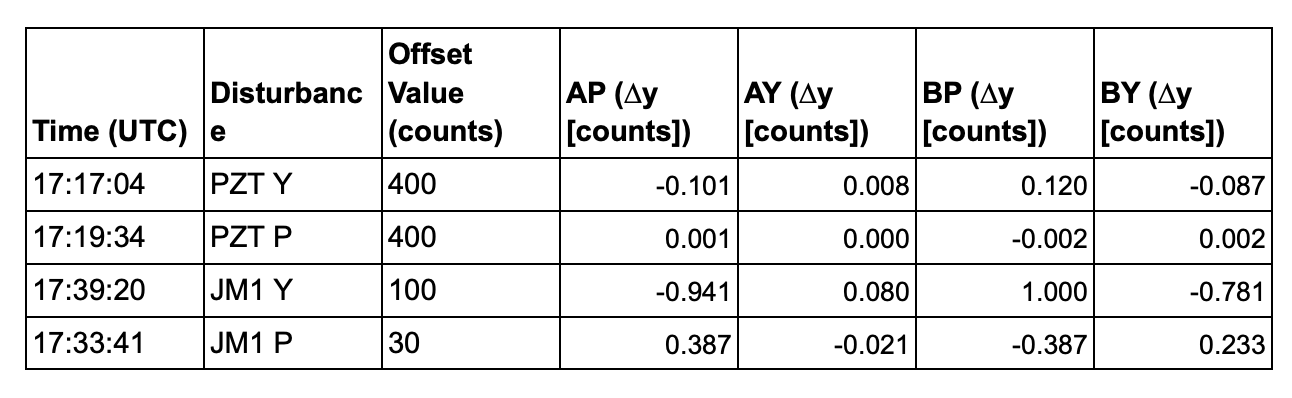
This morning, July 22, we measured the input matrix of the wavefront sensors using step responses applied to the PZT and JM1. The collected data are attached below.

We turned on the offsets of the PZT and JM1 for both pitch and yaw, adjusted each offset, and measured the corresponding responses in the pitch and yaw channels of wavefront sensors A and B. For PZT yaw and pitch, we increased the offset by 400. We used smaller increments of 100 for JM1 yaw and 30 for JM1 pitch. The JM1 lock filters contained integrators and were not enabled in the actuator path, so we used the test filters to introduce the disturbances. After each measurement, we returned the offset to its original value so that the measurements were applied evenly.

The collected data matrix is attached below. The two values highlighted in red were obtained from noisy data and therefore have high uncertainty. However, both values are very close to zero.

We then calculated the inverse matrix. Because the measurements were made using different offset values, we normalized the data by first dividing each response by its corresponding offset value and then dividing all values by the largest resulting value.
Images attached to this report
H1 SUS
oli.patane@LIGO.ORG - posted 14:44, Wednesday 22 July 2026 (91193)
BBSS M1 QOSEM Satamp Whitening turned on

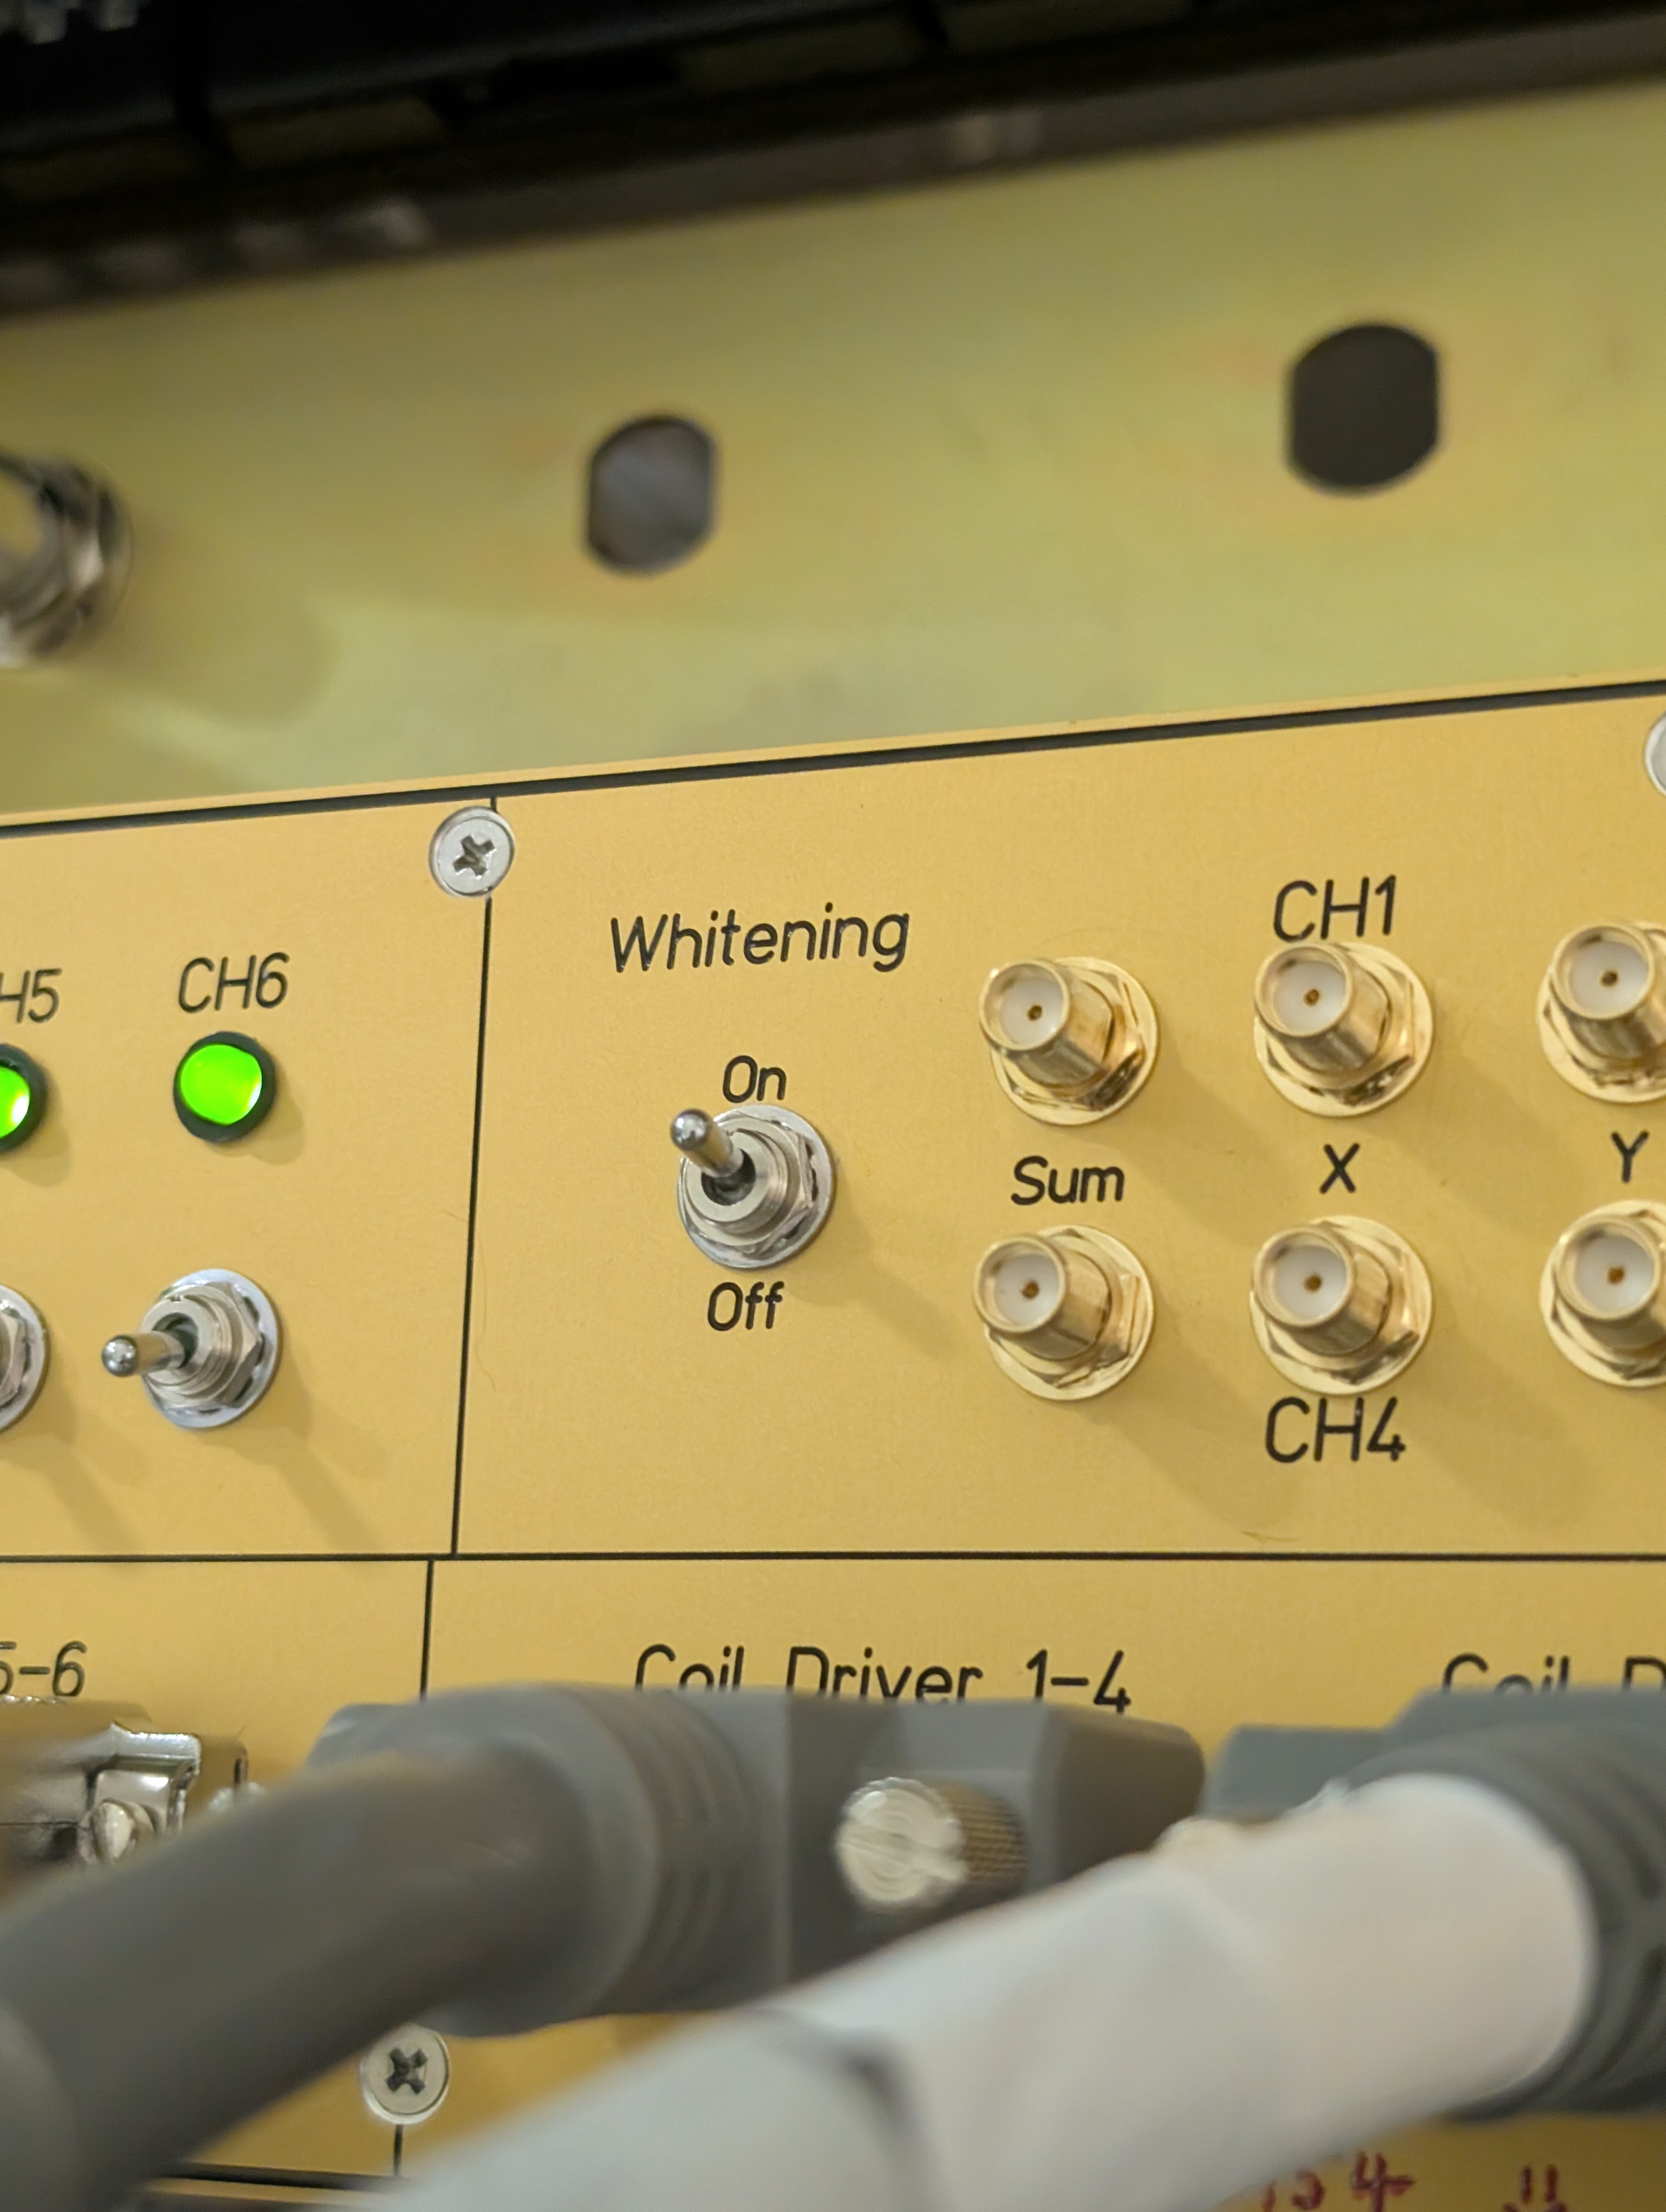
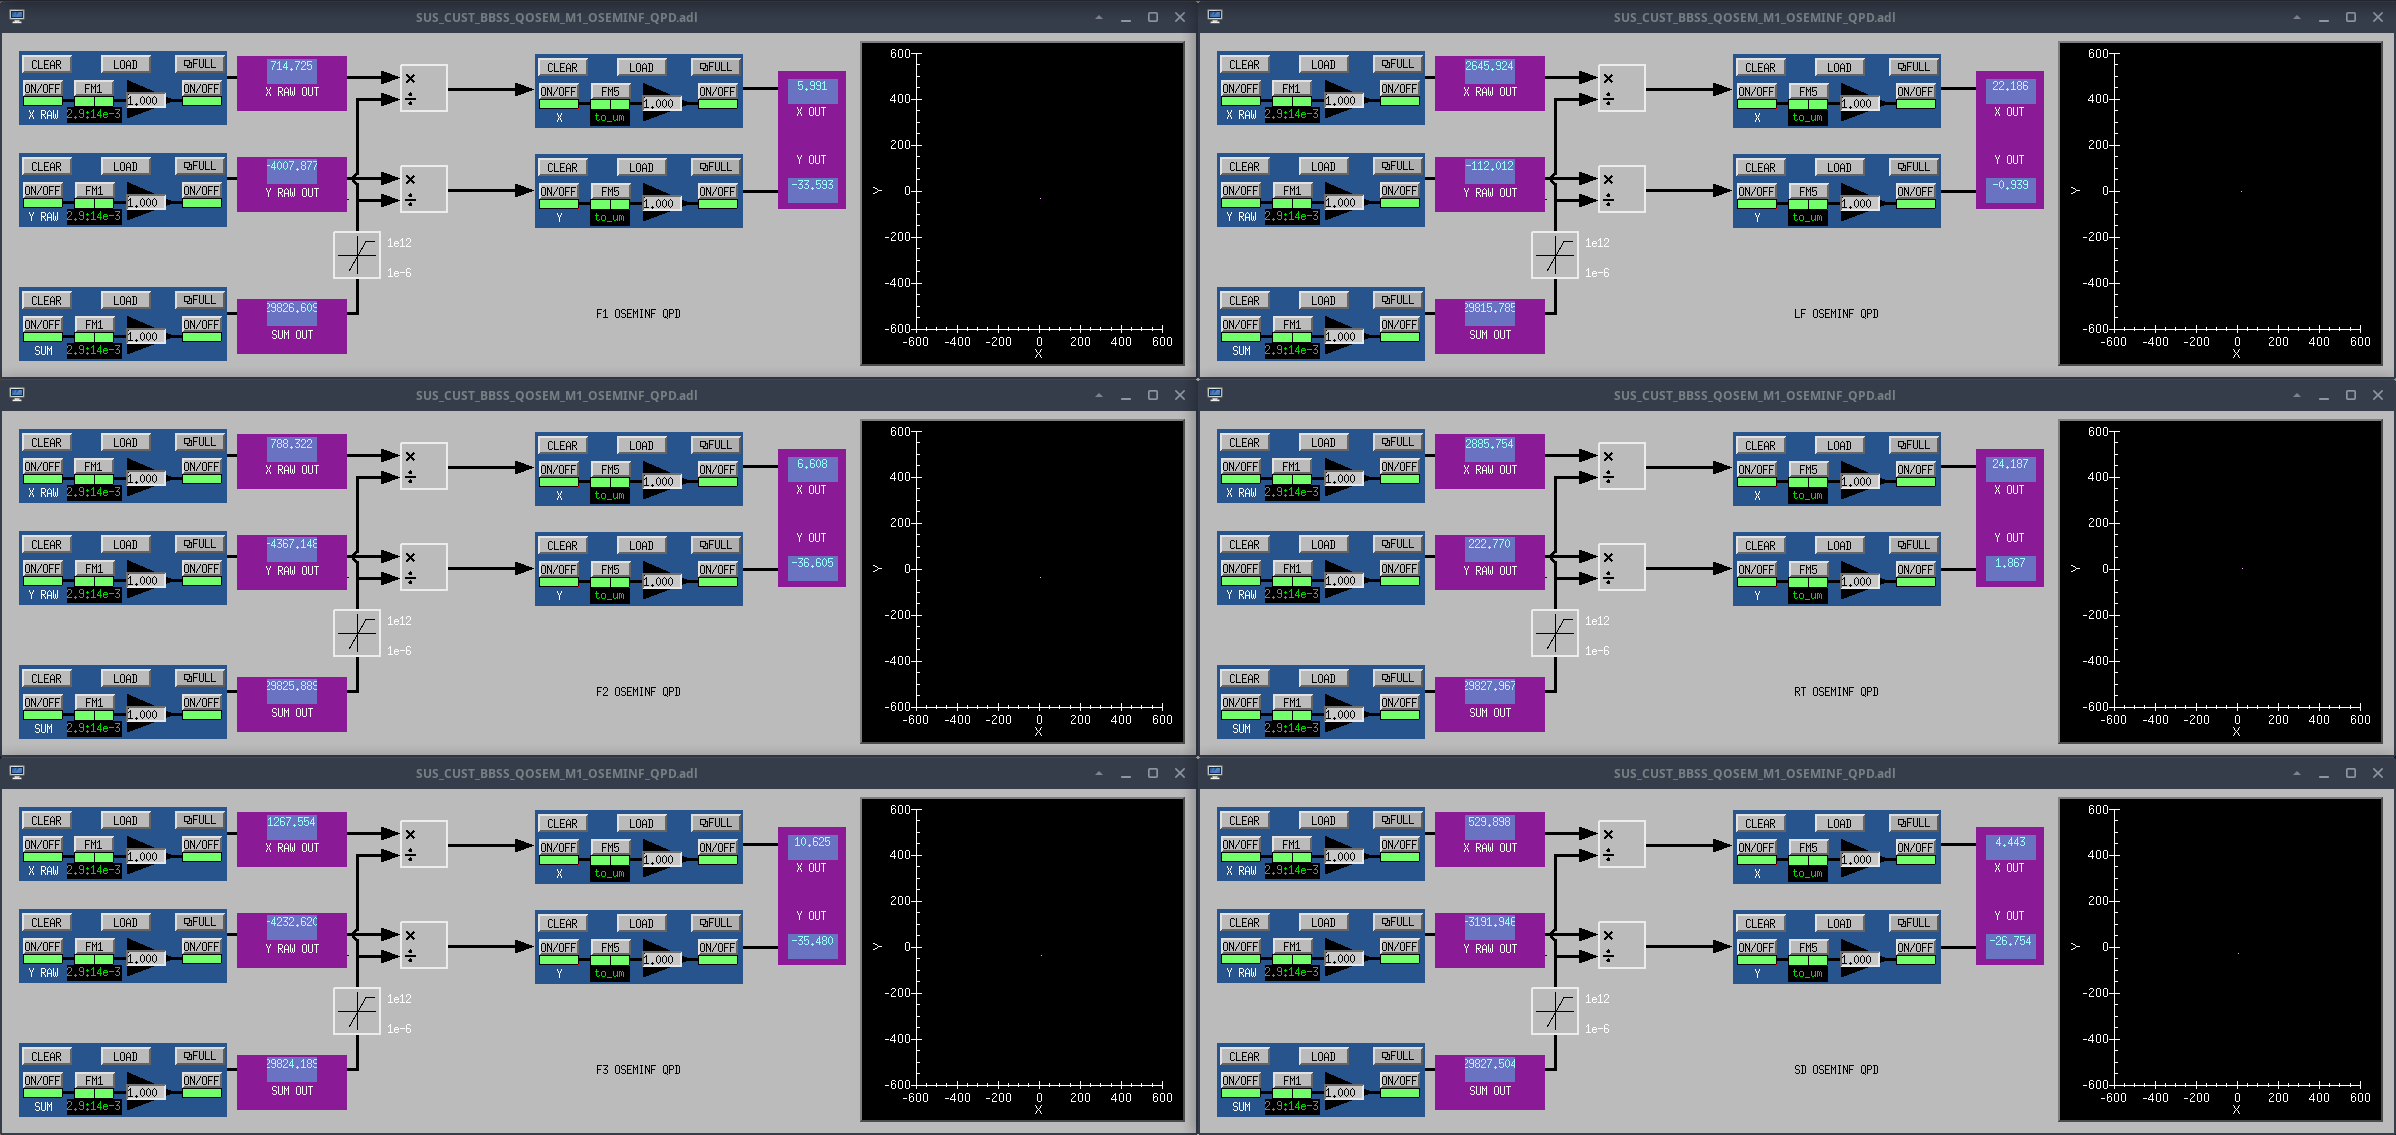
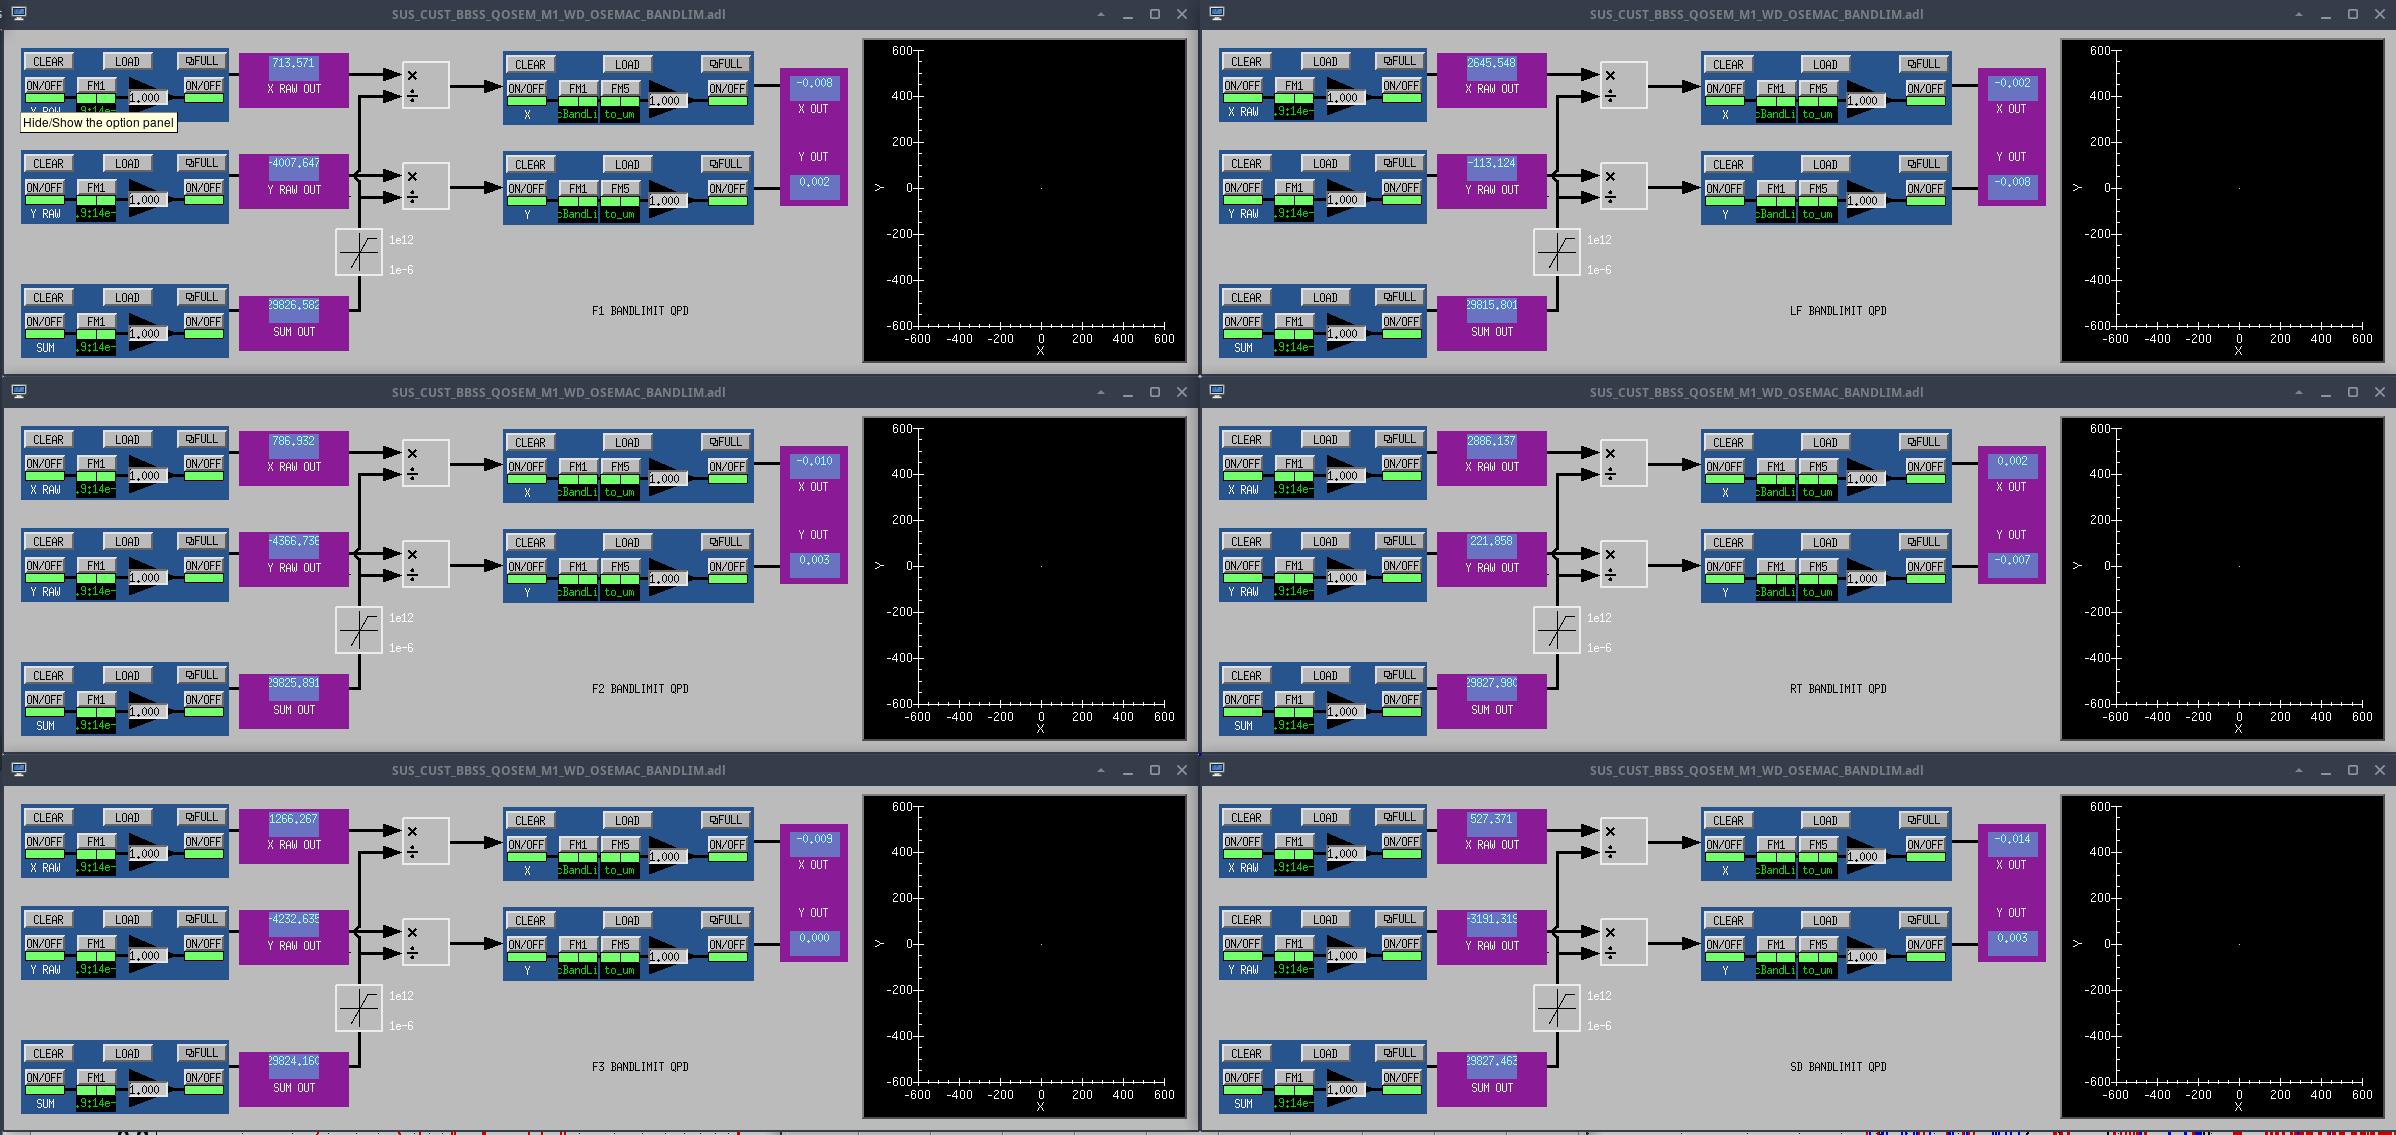
The BBSS M1 now has its satellite amplifier whitening on as well as now having digital filters on that compensate for the satamp whitening. So far the BBSS is damping well.

After lunch I finally had time to go out and turn on the whitening on the BBSS M1 Satellite Amplifier. I put the BBSS in SAFE and then went out to SUS-R2 and flipped the whitening switch from OFF to ON. Once I came back, I turned on the anti-whitening compensation filters on H1:SUS-BS_M1_OSEMINF_{F1,F2,F3,LF,RT,SD}_{X_RAW,Y_RAW,SUM} and H1:SUS-BS_M1_WD_OSEMAC_BANDLIM_{F1,F2,F3,LF,RT,SD}_{X_RAW,Y_RAW,SUM}. The compensation filters are all in FM1 in their respective filter banks and are called 2.9:14e-3. The full compensation filter is zpk([2.89],[14.4e-3],1,"n").

These filters being on were accepted in SDF.

Images attached to this report
H1 ISC
sheila.dwyer@LIGO.ORG - posted 13:58, Wednesday 22 July 2026 - last comment - 17:10, Wednesday 22 July 2026(91192)
PRMI flashes roughly aligned to POPAIR

Ryan S, Sheila, Jennie W, Elenna

Using PR2_SPOT_MOVE, I moved PR3 to increase the flashes on LSC POP LF, with 10W input we are getting flashes of up to 400 counts on POP LF (compared to 2-3 counts yesterday).  To do this I had to iterate between PR2_SPOT_MOVE and using PRX to touch up the PRMI flashes (I also adjusted for MICH DARK, but the main thing that was getting misaligned was PRX).

After that the flashes were hitting the top periscope mirror on the very edge on ISCT1, I moved the mirror about an inch in the -X direction, and also moved the bottom mirror also in the -X direction.  I then adjusted the alignment of the periscope mirrors to get a beam to POPAIR B, this was difficult with flashes and we may still be clipping.  There are flashes on POPAIR 18, much lower than normal, but they could be used to try to lock PRMI.  It would be easier to align this path with a locked PRMI.  


Images attached to this report
Comments related to this report
elenna.capote@LIGO.ORG - 17:10, Wednesday 22 July 2026 (91198)

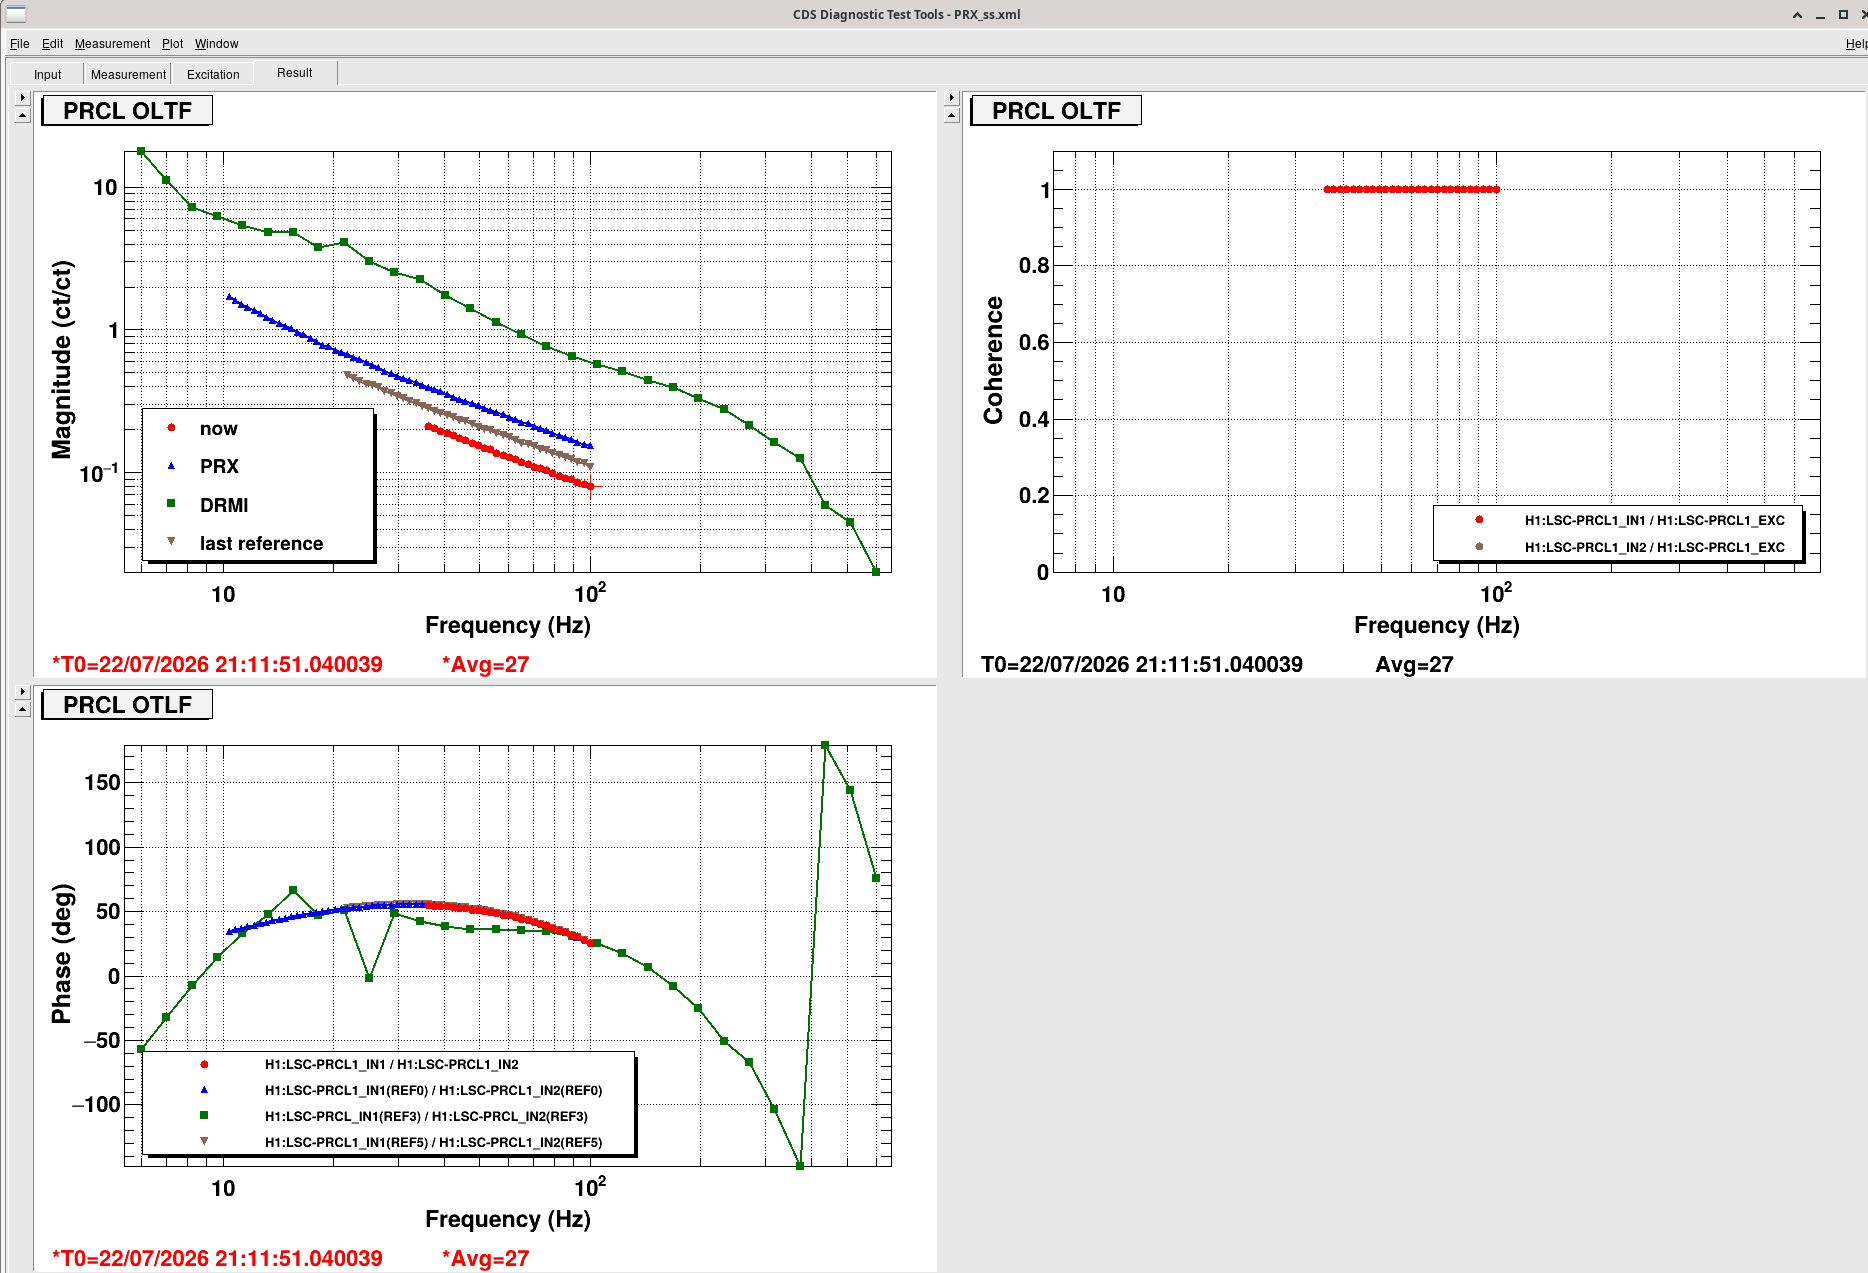
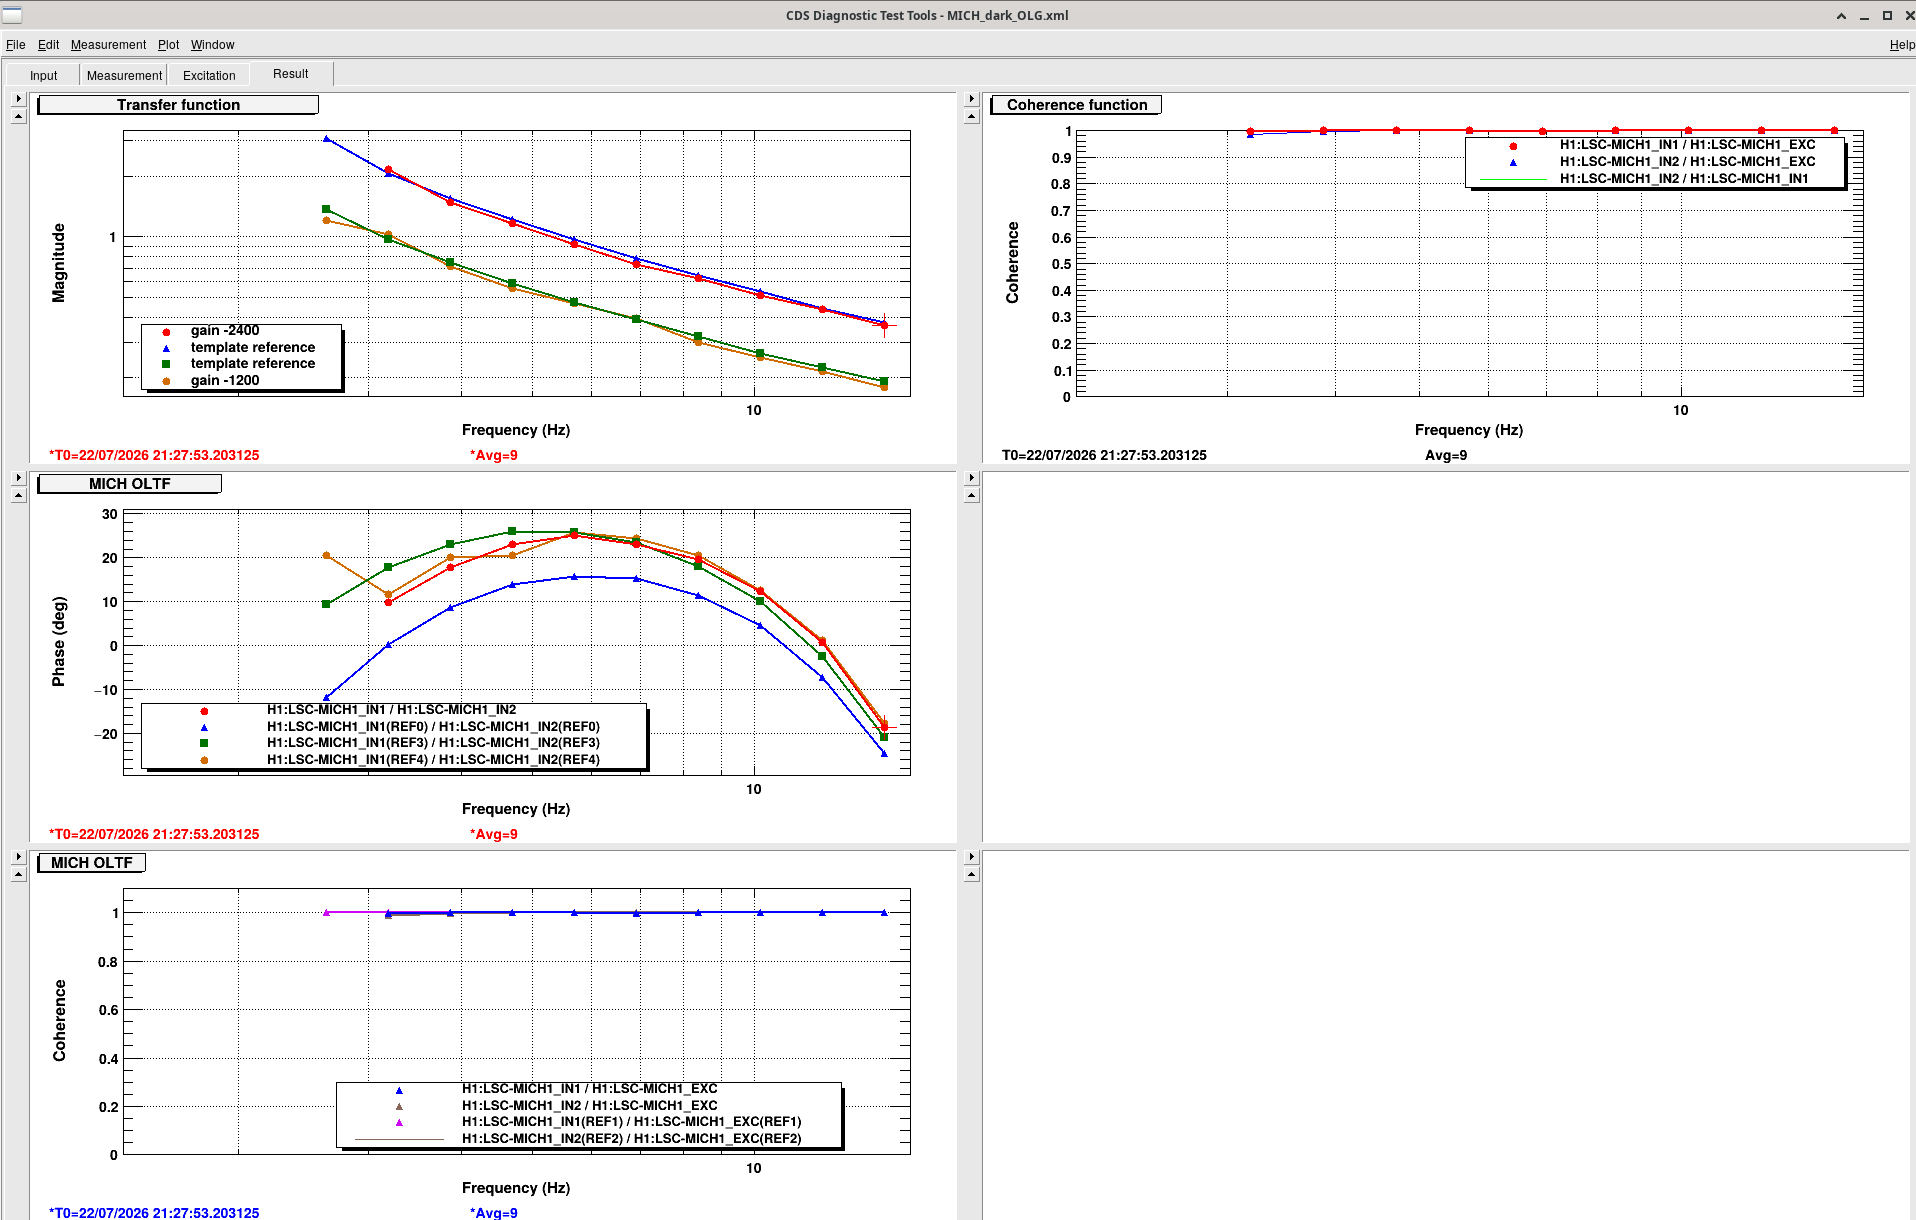
After Sheila performed this realignment, I locked PRX and MICH to check how things looked. The PRX swept sine measurement shows that the PRX gain is about 30% too low compared to the template. I didn't make any changes.

The MICH template showed that the MICH gain is now a factor of 2 too low- remember yesterday we had to drop this gain by a factor of 6.7. I increased the MICH gain to 2400 in both bright and dark align in the ALIGN IFO guardian. I don't understand this change.

Sheila and I tried further moving the PR2 spot around. There are some alignments that give decent flashes on POP A LF and some small flashes on POPAIR B. However, at 2 W these flashes are too small to trigger a PRMI lock.

I briefly went to the table- it looks like maybe the beam is in danger of clipping in yaw on the shutter as it comes of the periscope, but I'm not sure.

We can see beam flashes on both POP A LF and on POP X WFS DC. Seg 3 of the WFS is much larger than the other three segments, but I haven't been able to improve the centering with PM1 scanning.

Jennie, Ryan, and I took the power to 10 W, where the flashes on POPAIR B around between 10 and 20. However, we couldn't figure out how to trick the trigger matrix into locking PRMI.

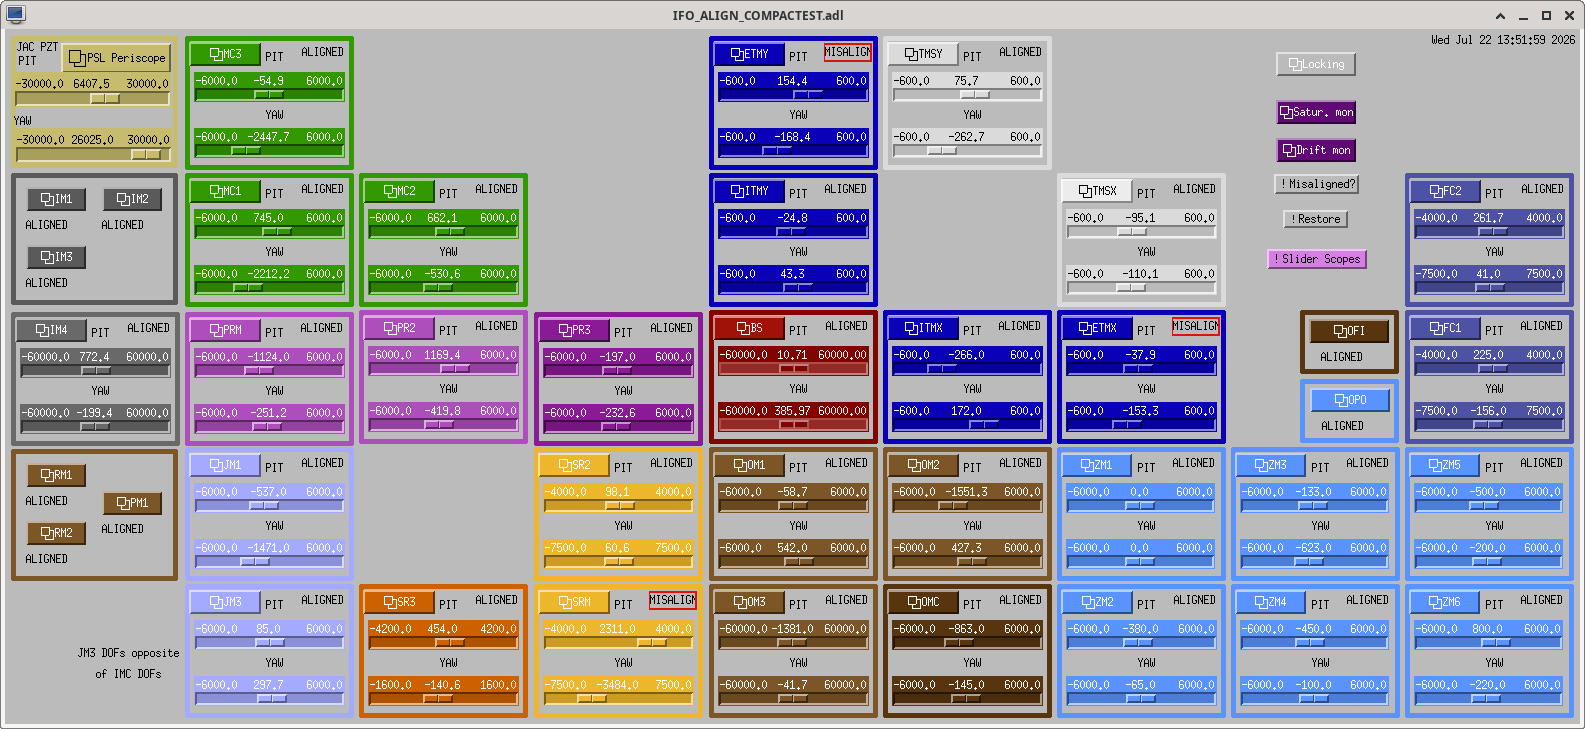
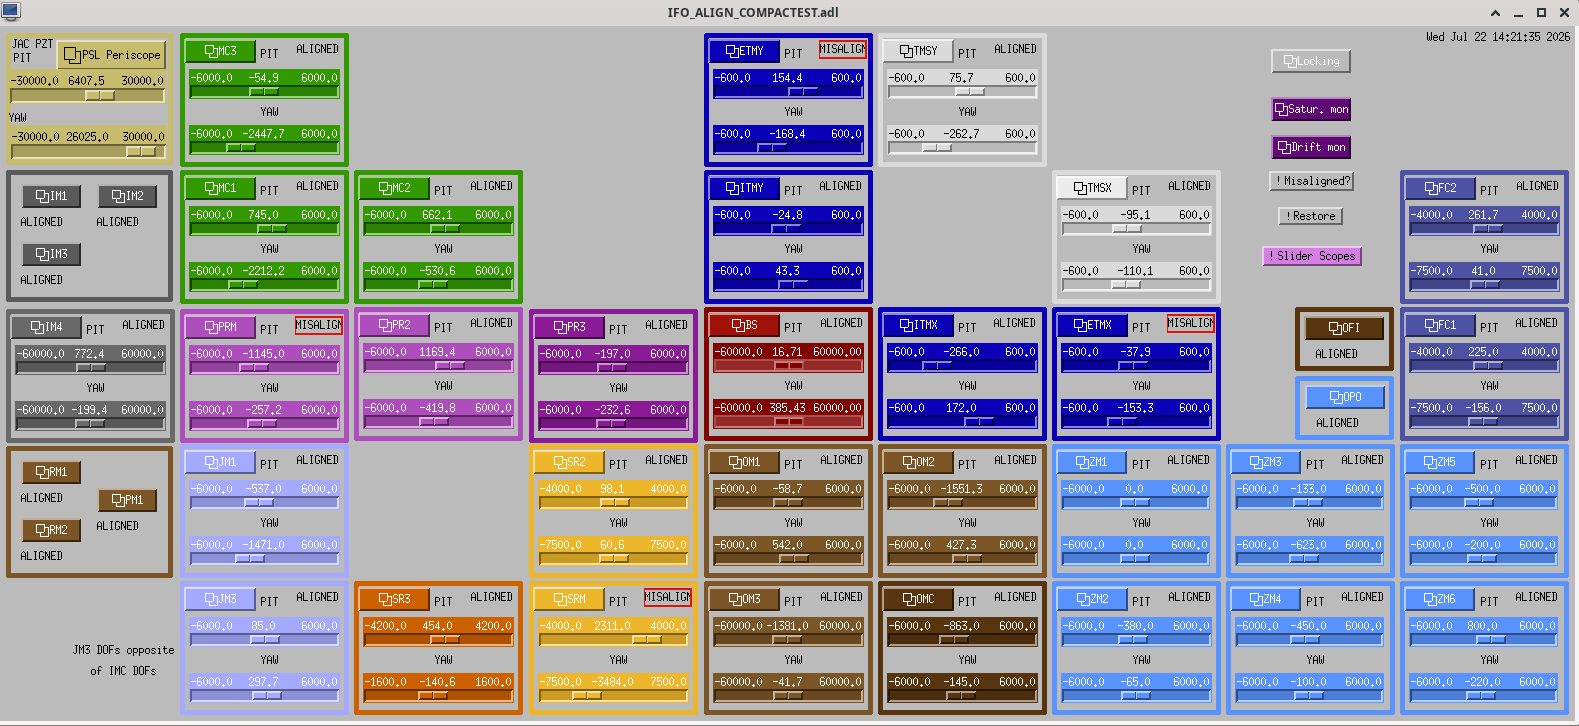
Attached are screenshots of the swept sine results and the alignment sliders after PRX and MICH locking.

Images attached to this comment
H1 CDS (SEI)
filiberto.clara@LIGO.ORG - posted 12:30, Wednesday 22 July 2026 (91190)
HAM2 L4C Interface Chassis Installed

WP 13447

A L4C Interface Chassis was installed in the CER rack SEI-C2, slot U10. Output signals connected to both HAM ISI Anti-Alias Interface Chassis on slots U39 and U38. Part of HAM2 L4C upgrade.

AA Chassis Slot U39: Channels 25-28
AA Chassis Slot U38: Channels 25-28 and channels 29-32

Serial Number of Chassis: S2501278

H1 SQZ
eric.oelker@LIGO.ORG - posted 12:09, Wednesday 22 July 2026 (91185)
Astigmatism and Mode Matching sensitivity on the FC path

Measured Astigmatism due to ZM2

We've been investigating astigmatism in HAM 7 recently, and have found that ZM2 seems to be a prime suspect.  The actuation strength of the PSAMs depends sensitively on the beam spot size, so any astigmatism in the ZM2 optic will couple strongly to the optical beam due to its large beam size (w = 2.5 mm).

In 90815 we measured the beam profile before ZM4 and found that the astigmatism at that point does depend sensitively on the strain gauge setting for ZM4.  Below I compute the astigmatism in terms of the 1D overlap integral between the X and Y beam parameters.  This is a useful metric, since it tells us roughly what the maximum mode overlap we can achieve with another stigmatic mode (eg the SQZ-OMC mode overlap). 

ZM2 SG (V) X/Y 1D Overlap
1.3 0.98
3.15 0.993
3.8 0.98
4.5 0.955
6.0 0.96

Here, we notice that the overlap depends strongly on the ZM2 settings.  It can be quite bad for some strain gauge settings, but actually doesn't look too bad at the nominal operating point for O4 (3.15 V).  From the characterization data at Caltech, we know that the PSAM astigmatism can vary significantly with different settings, so this isn't surprising.  See this analysis from Lee:  Google Slides

The value for 3.15 V is roughly consistant with the recent measurement of the mode between ZM2 and ZM3.  I did a fit of the measurements in aLog 91142 and found that, at the nominal strain gauge setting, the XY overlap after ZM2 is 0.997.  Since ZM2 is double passed and actuates primarily on the beam defocus at FC1, we naively expect its contribution to the XY overlap right before ZM4 to be ~0.994.  This assumption doesn't alwasy hold, particularly if the beam is poorly mode matched to the FC and the retro beam at ZM2 has a very different spot size.

See the attached zip file for further analysis of the data from aLog 91142.  The data from this aLog also suggests that centering the beam better on ZM2 would reduce the astigmatism after ZM2 by about 50% at the nominal strain gauge setting.  This data doesnt appear to show a significant change in astigmatism for smaller offsets in the strain gauge setting, though the lack of data at the waist might be impacting the fit somewhat.


ZM2 SG (V) Old Pos New Pos
2.65 .998 .998
3.15 .997 .9988
3.65 .9975 .998


It seems that the severity of our astigmatism issue with ZM2 will depend on whether our mode matching to the FC has changed significantly when we replaced the VOPO in December.  If we need to change the ZM2 setting significantly to fix the mode matching to the filter cavity, astigmatism will start to limit our matching to the OMC.  


Sensitivity of the FC path

This raises an interesting question:  Why have ZM2 be a PSAM in the first place?  In principle, we are just mode matching between two static cavity modes.  We should be able to do this with a ZM2 optic with a fixed RoC.  In practice, the need for tunability is dictated by how sensitive the mode matching solution is and how well we know the various parameters. 

In order to mode match between the OPO (waist size < 100 um) to the filter cavity (waist size ~ 1cm) over a path of < 5 m in length, we require the beam to be diverging rapidly past ZM2.  See the attached Wield plots for the telescope:  Tangential and Saggital

This results in the mode matching solution being quite sensitive to the following parameters:  The ZM2 ROC,  the ZM2 - to - FC1 distance, and the RoC of the FC1 AR surface.

I made wS plots using Finesse which show how the mode at the HR surface of FC1 depends on the following parameters.  I made some assumptions about what the nominal values are for the FC AR and ZM2 RoCs which I'm sure aren't 100% accurate.  I think that's fine for now: we just want to see how offsets in the parameter values impact the mode matching to help us gain intuition:

These plots show the 2D overlap for both the horizontal (plotted with X markers) and vertical (plotted with * markers) q parameters (this analysis includes only the astigmatism from the OPO and ZM2 AOI).  We see that all three DoFs are fairly degenerate, primarily impacting the beam defocus at FC1.  

The original design for the optical path was to use a variable ZM2 to compensate for the manufacturing tolerences of the ZM2 and FC1 RoC's.  

However, these plots suggest that one could also compensate for this by moving the position of ZM3 instead of changing the ZM2 RoC.  It looks like LLO has actually played around with this degeneracy in the past (59774).  One can also translate L2 to fix these issues, but this can only compensate for small mismatches.


Upshot

In summary, I hope we find that the current PSAM setting for ZM2 gives us good SQZ-FC mode matching and we don't have any urgent reason to make significant changes to the FC path to address astigmatism issues.  If this does end up being an issue, or if we decide to revisit this for A#, it looks like there might be a way to make the FC path work without a PSAM, though it would take a fair amount of effort to implement.  

Non-image files attached to this report
H1 SQZ
camilla.compton@LIGO.ORG - posted 11:42, Wednesday 22 July 2026 (91183)
ZM2 Bumped on Monday during Beam Profile Measurements: now alignment for same sliders changed.

Camilla, Ryan S, Rachel.

We went into HAM7 with the aim of check the power budget through the OPOS with ZM1,2,3 in the settings for a lower beam on ZM2 and also setting irises after ZM5 in preparation for the repeat ZM5 swap. However the beam alignment was bad so we didn't compete any of these tasks.

Red and green co-alignment still good, OPO REFL and green pump REFL still in nominal location so OPOS hadn't moved. However the beam was low and to +X on the ZM2 iris and the retroreflective off FC1 was ~4mm off at the ZM1 iris, no light was getting though the OPOS. This was true in both the old and new ZM2 beam height (ZM1,2,3) alignments. From the control room Ryan found that on Monday ZM2 moved a large amount. He undid this. Then Rachel and I worked to improve the retro-alignment with ZM2. We then got beam through OPOs to ZM4 but still no light on the IR PD. This was confusing so we stopped. Today we found out this was because Rahul had locked ZM5 while troubleshooting it. Once he unlocked ZM5 we had some light on SQZT7 PD. 
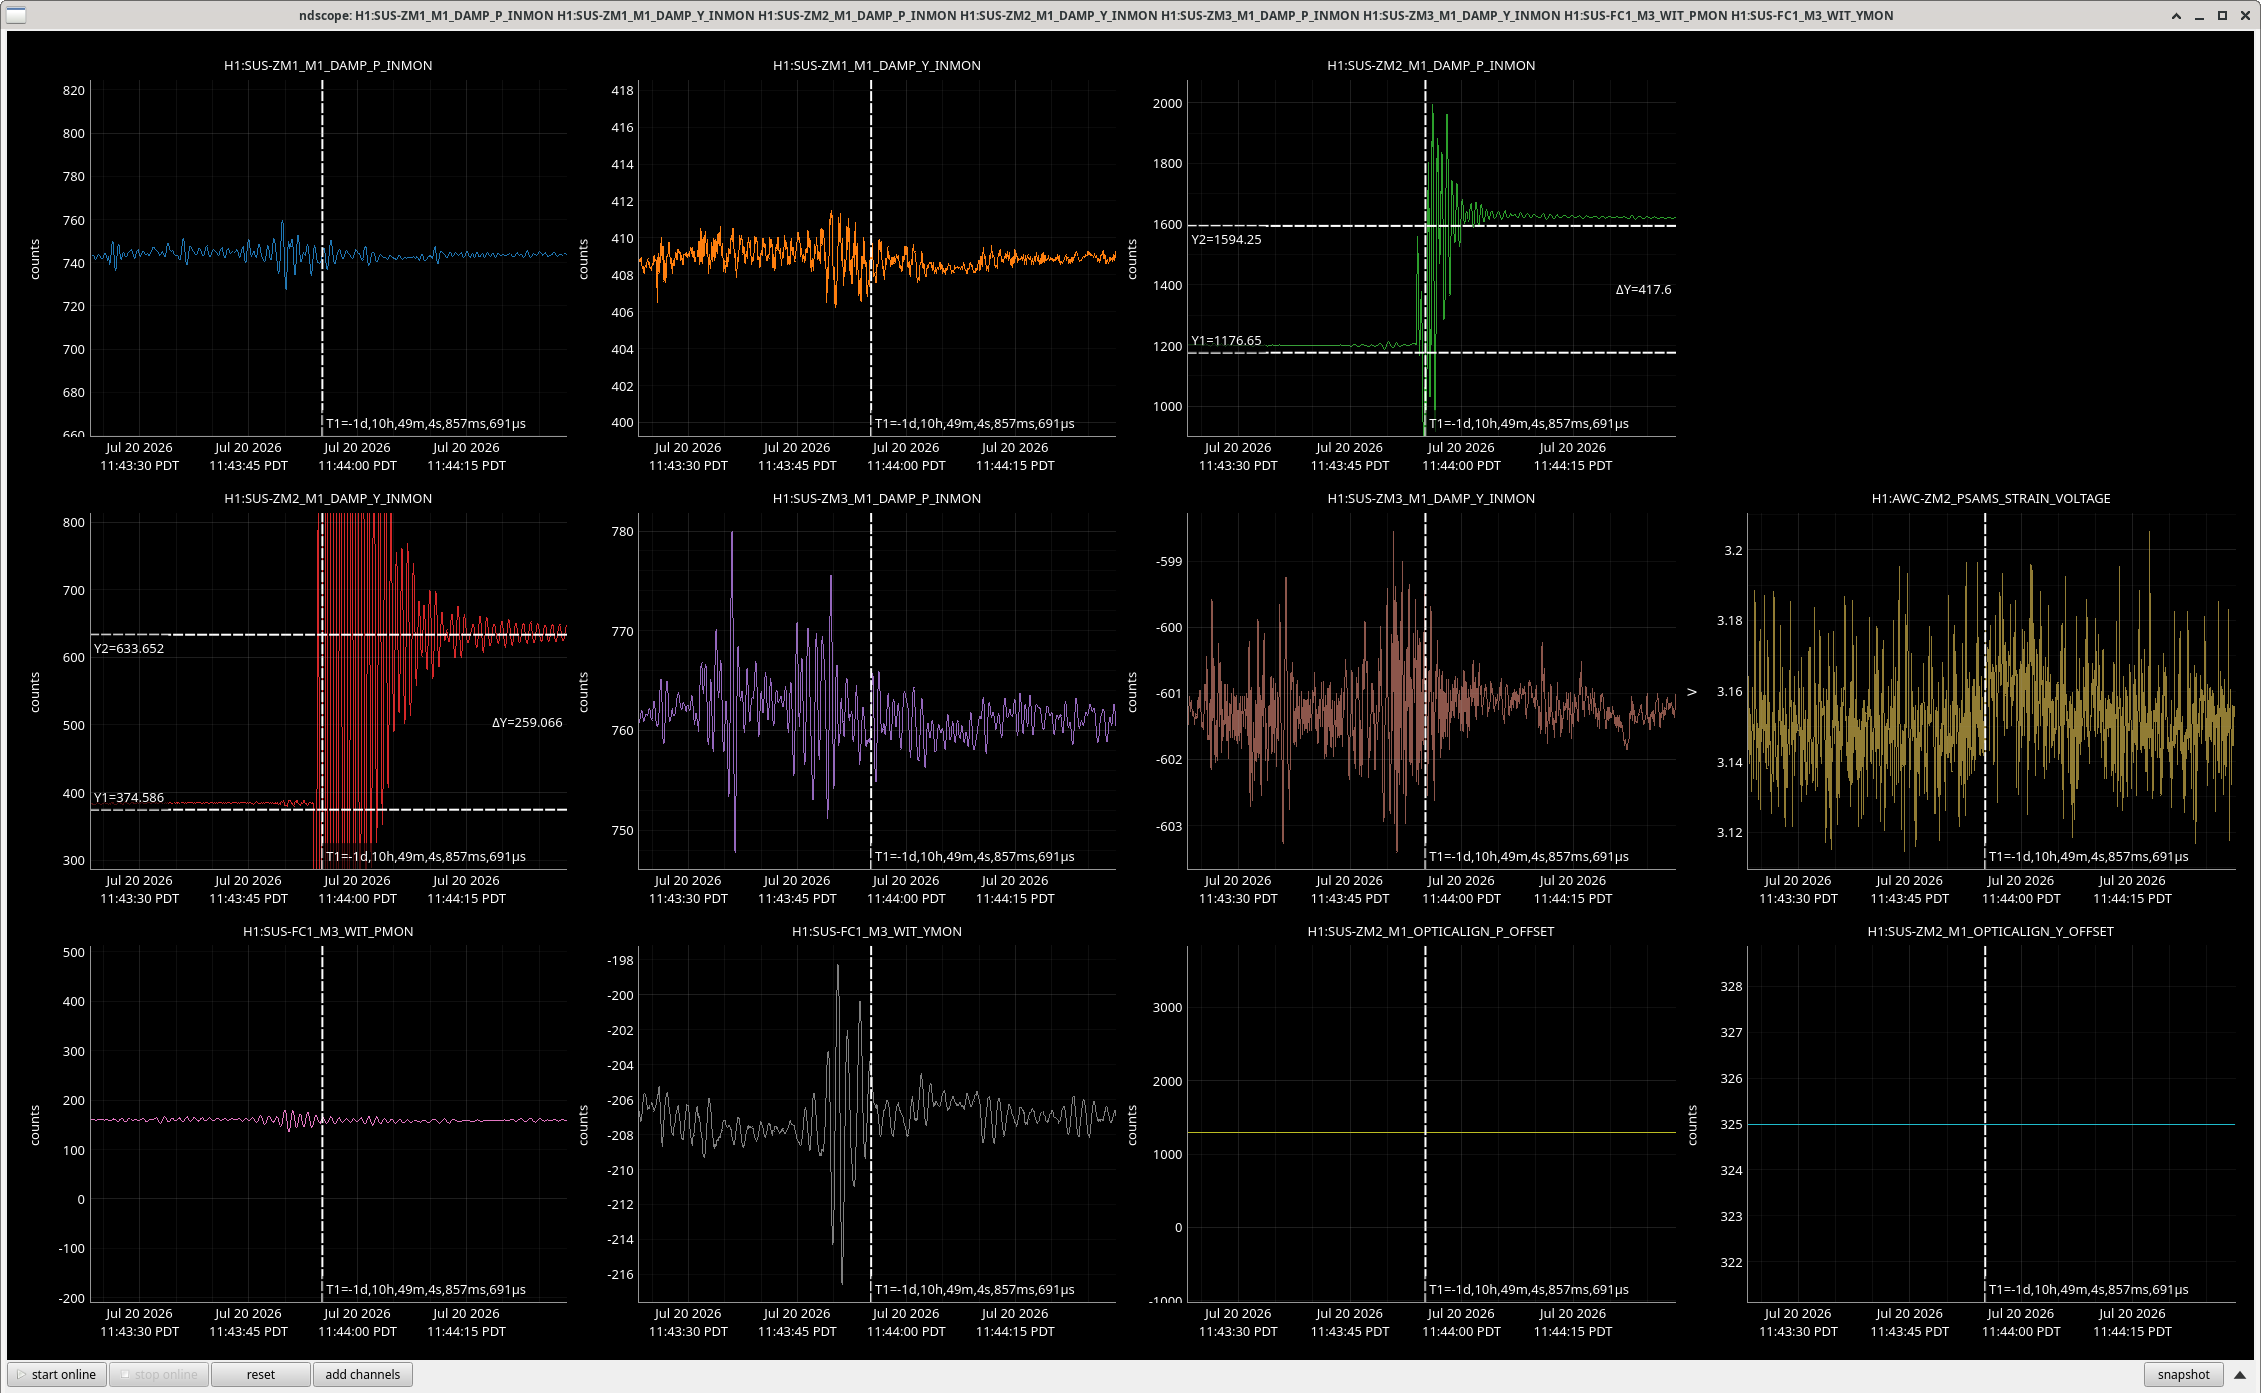
I think ZM2 must have been bumped when I was measuring the distances between ZM2 and the nanoscan. See bump in ndscope.  There is cable in the front of ZM2 that if I moved could change the hanging of ZM2.

Rahul confirmed that ZM2 is heathy 91186, just it appears that now the alignment sliders need to be in a different location for the same pointing

Images attached to this report
H1 SUS (IOO)
elenna.capote@LIGO.ORG - posted 11:54, Tuesday 21 July 2026 - last comment - 11:21, Wednesday 22 July 2026(91155)
MC2 M3 to M3 transfer function

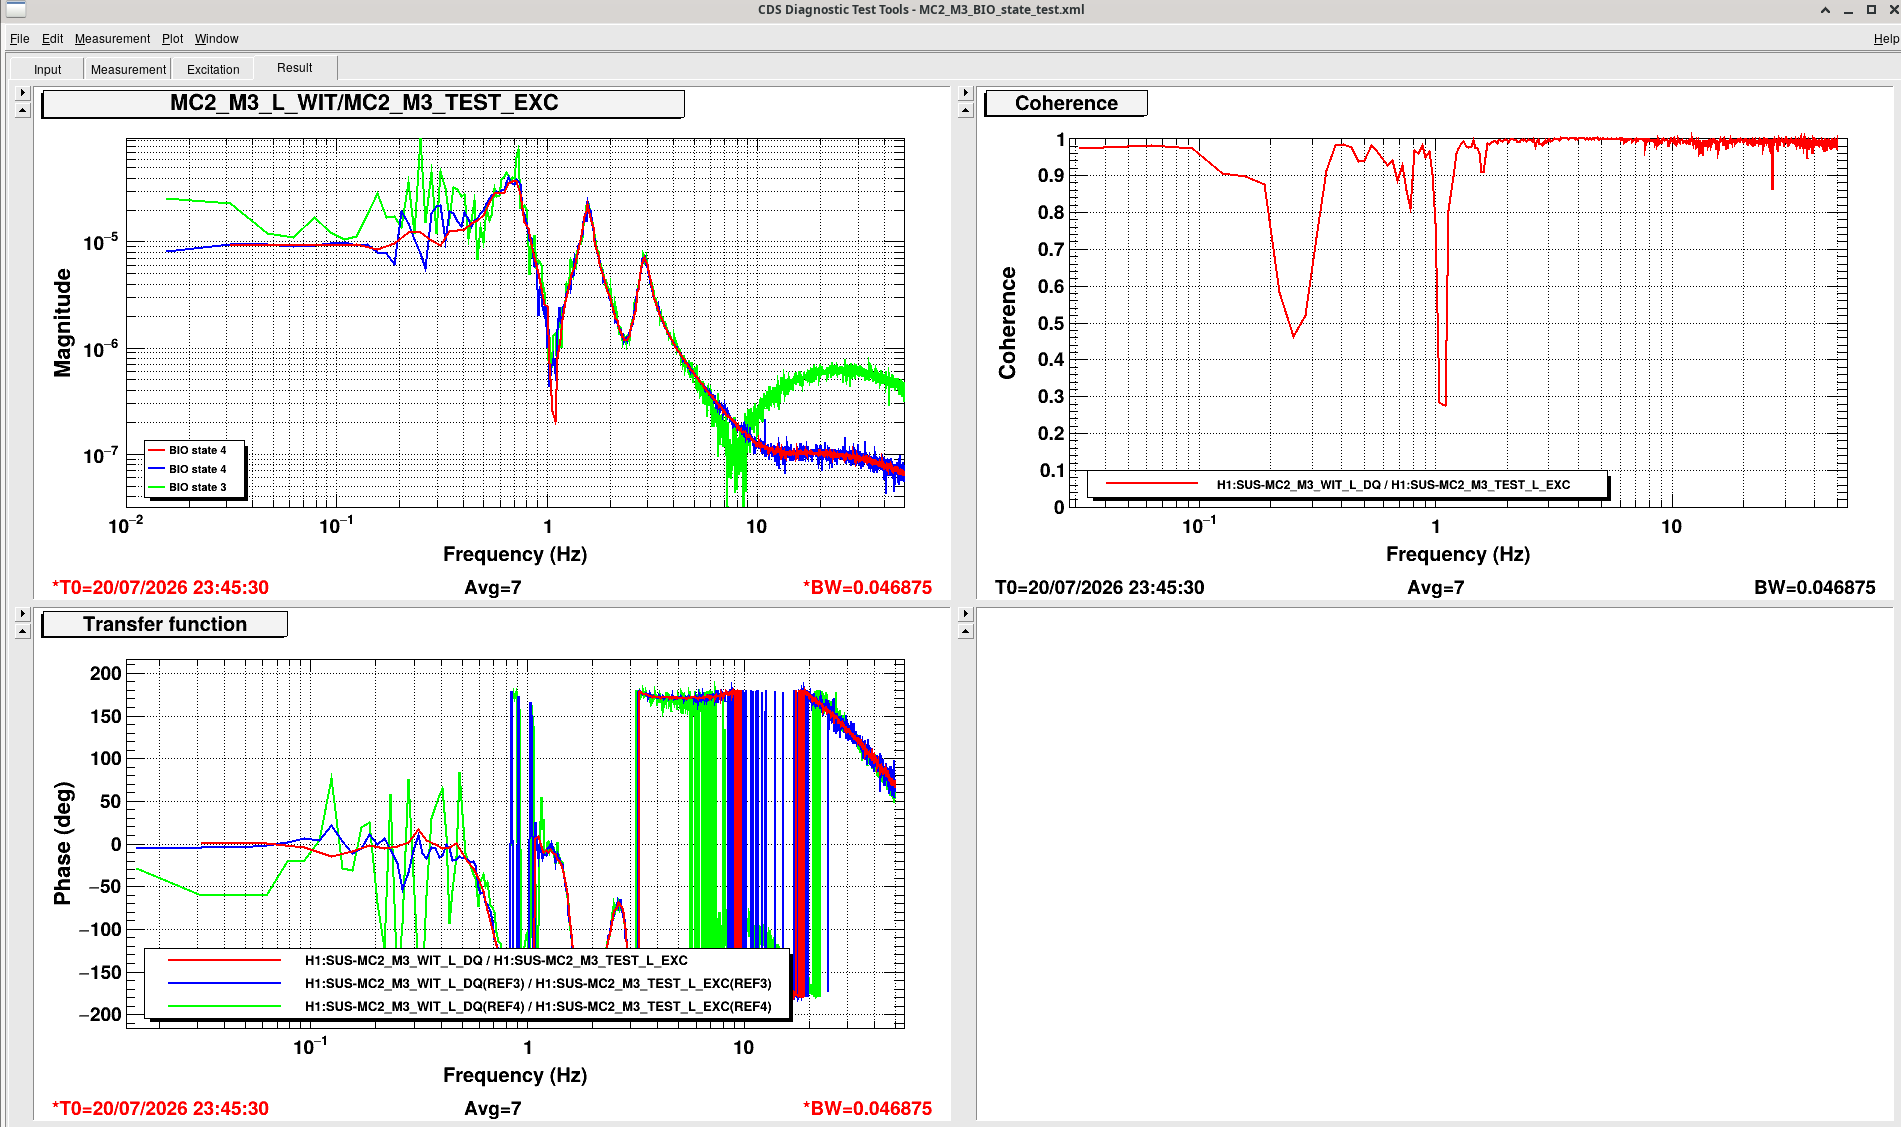
As a part of trying to diagnose the mode cleaner locking issues, I ran a transfer function of MC2 M3 to M3 to see if everything looked normal. Unfortunately, there is nothing in the sus svn to provide a reference, so we don't know what it is supposed to look like.

I immediately noticed strange behavior above 10 Hz that is related to the BIO state. I thought I was on to something, however, I found out that this is a long known problem that comes from coil driver coupling to the osem. Nonetheless, here is a measurement, in case anything else jumps out as strange to anyone.

I took two transfer functions in BIO state 4 - Acq On LP On, and one in BIO state 3 (nominal)- Acq Off LP On.

Images attached to this report
Comments related to this report
elenna.capote@LIGO.ORG - 11:21, Wednesday 22 July 2026 (91188)

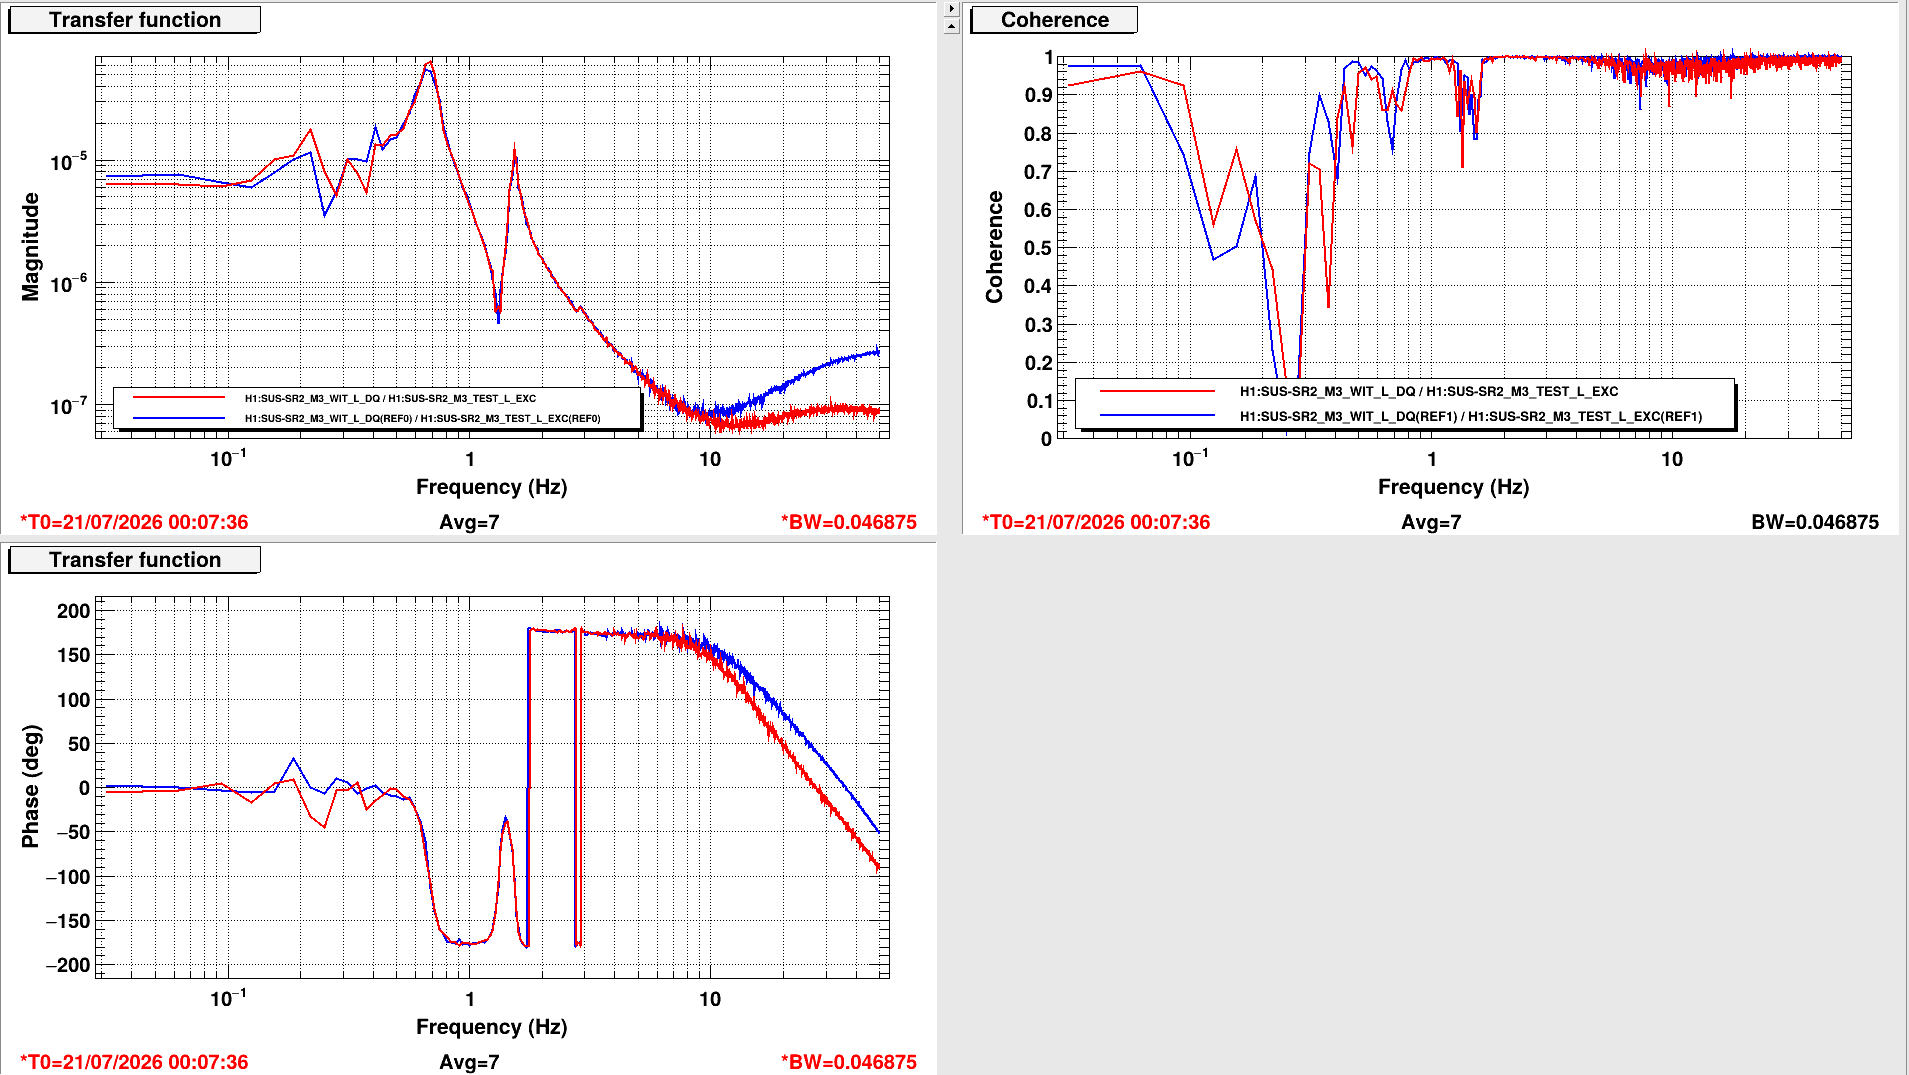
I also measured SR2 when I was investigating the BIO state issue. I toggled between state 3 and four. I noticed that the high frequency response changes like MC2 M3, but much less so.

Images attached to this comment
H1 ISC (SUS)
elenna.capote@LIGO.ORG - posted 14:55, Tuesday 14 July 2026 - last comment - 17:55, Wednesday 22 July 2026(91028)
Comparing BBSS and BSFM models for DRMI locking

Inventory of DRMI locking data in 87768. By eye (someone overwrote the data in the MICH xml since it was taken), the MICH UGF is roughly 15 Hz when we achieve DRMI 1f lock.

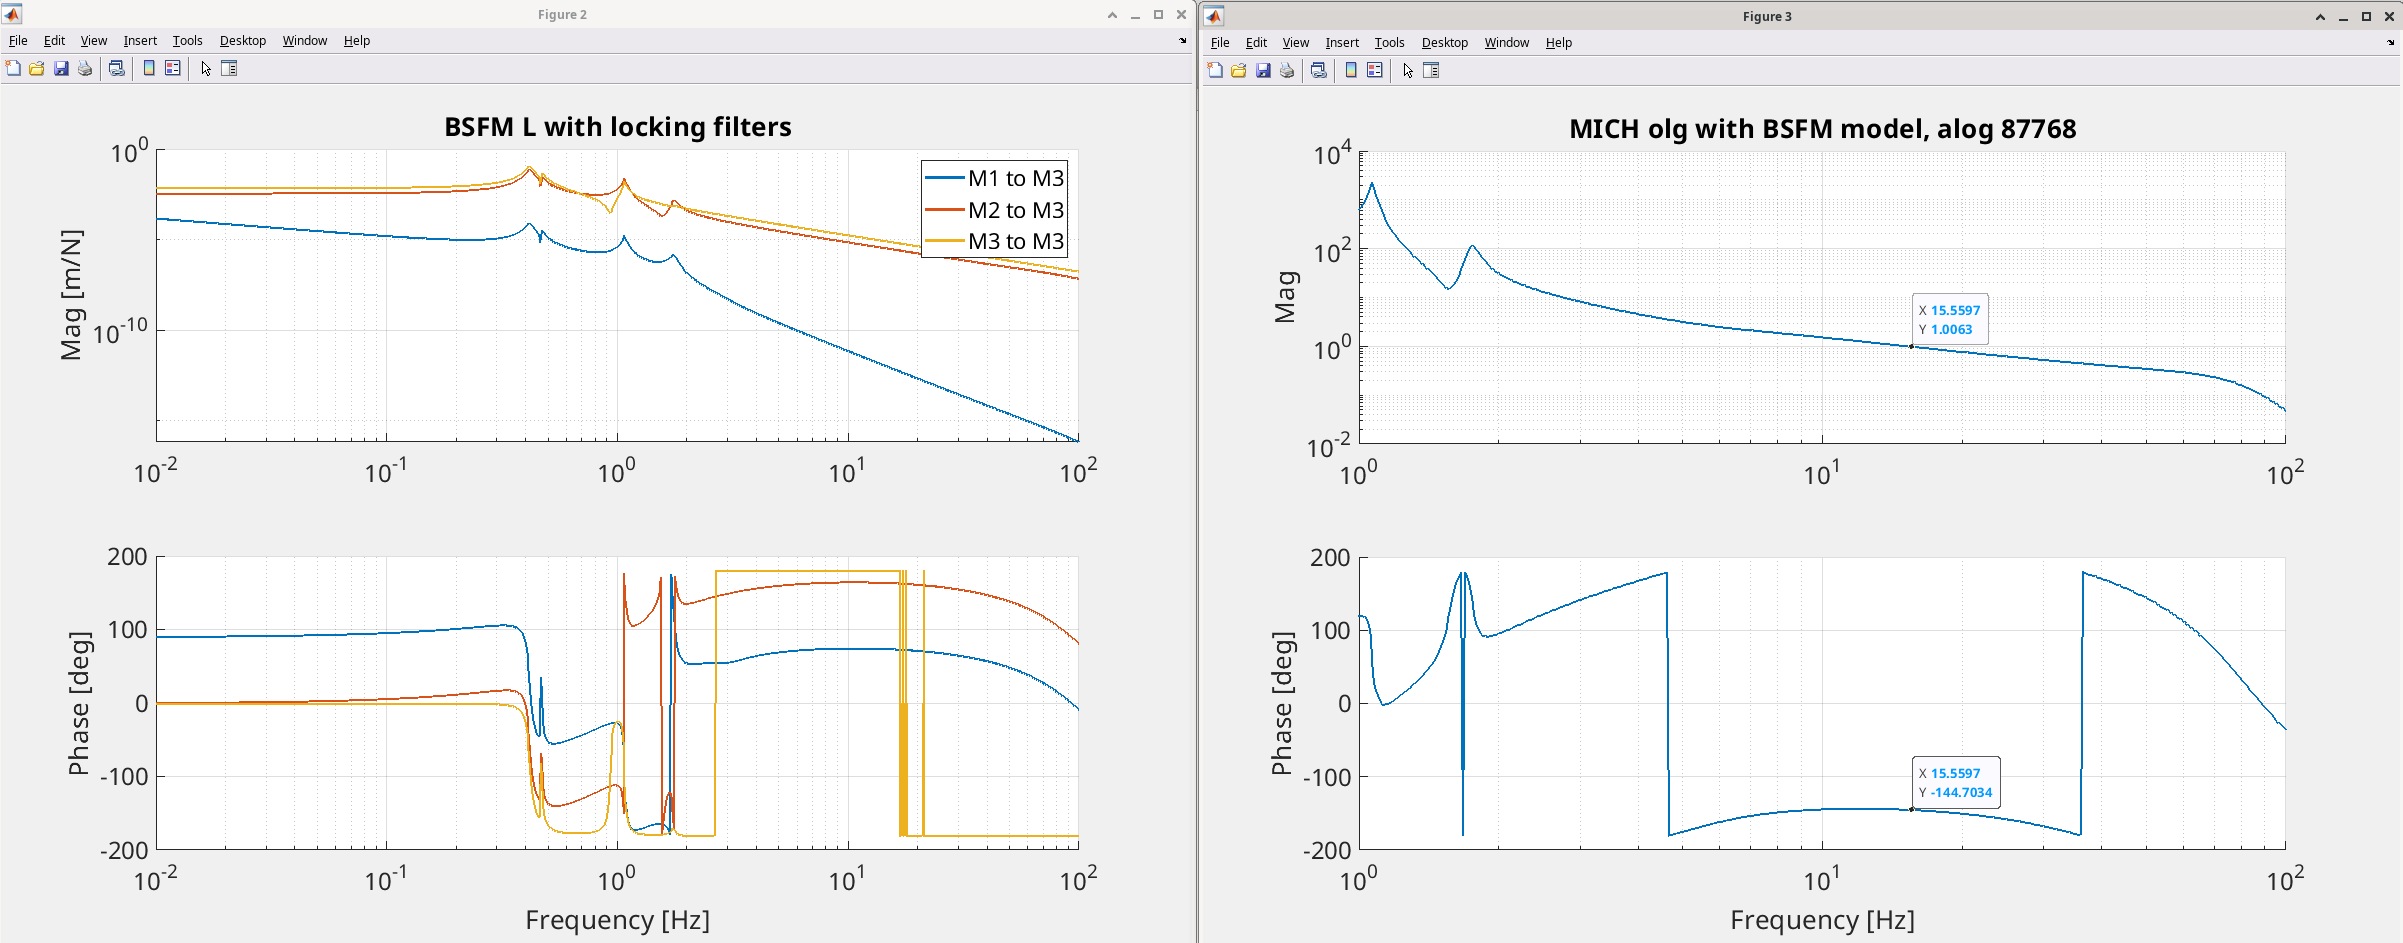
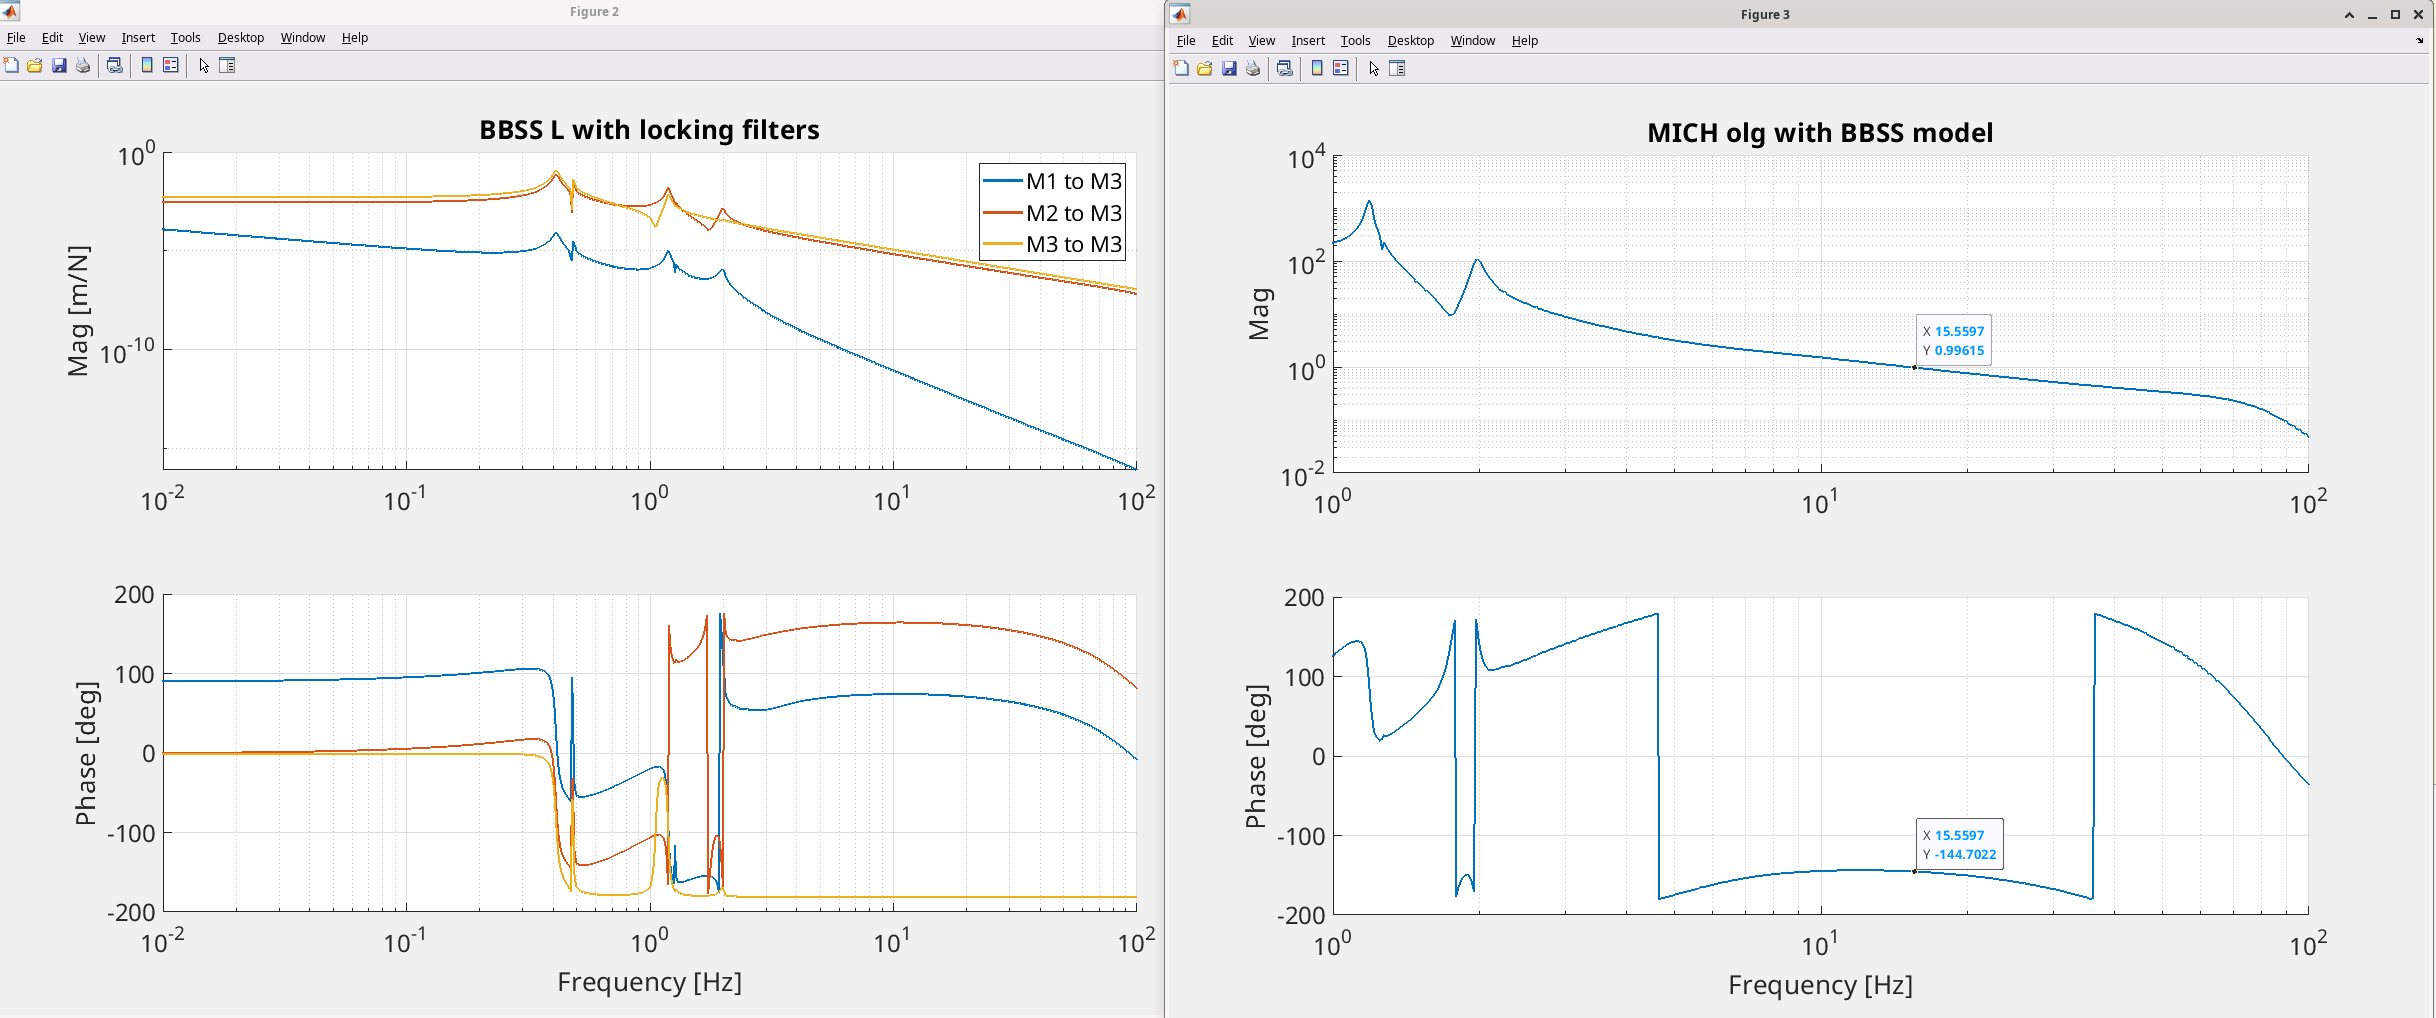
I used the BSFM model in /ligo/svncommon/SusSVN/sus/trunk/Common/MatlabTools/TripleModel_Production (bsfmopt_metal) to generate a model of the MICH loop using the MICH control filters and BSFM locking filters. I applied a fudge factor to generate a loop with a 15 Hz UGF, which I then used to estimate the m/ct calibration required to generate a BBSS model, assuming we have the same optical gain when locking with the new beamsplitter. (suspension calibration table is G1100968). This model indicates that the MICH L M1/M2 crossover is 30 mHz, which agrees with the data in the table in Evan Hall's thesis, Table 2.4 page 33. See first attachment for BSFM model

Then, I generated a BBSS model in the same triple model directory using bbssopt. I applied the same beamsplitter locking filters and MICH control.

Overall, it shows us that if we use the same feedback design with M1/M2 control, we should end up with a MICH loop that is almost the same as the one we have now in DRMI 1f lock- 15 Hz UGF, 30 mHz crossover between M1 and M2. See second attachment for BBSS model

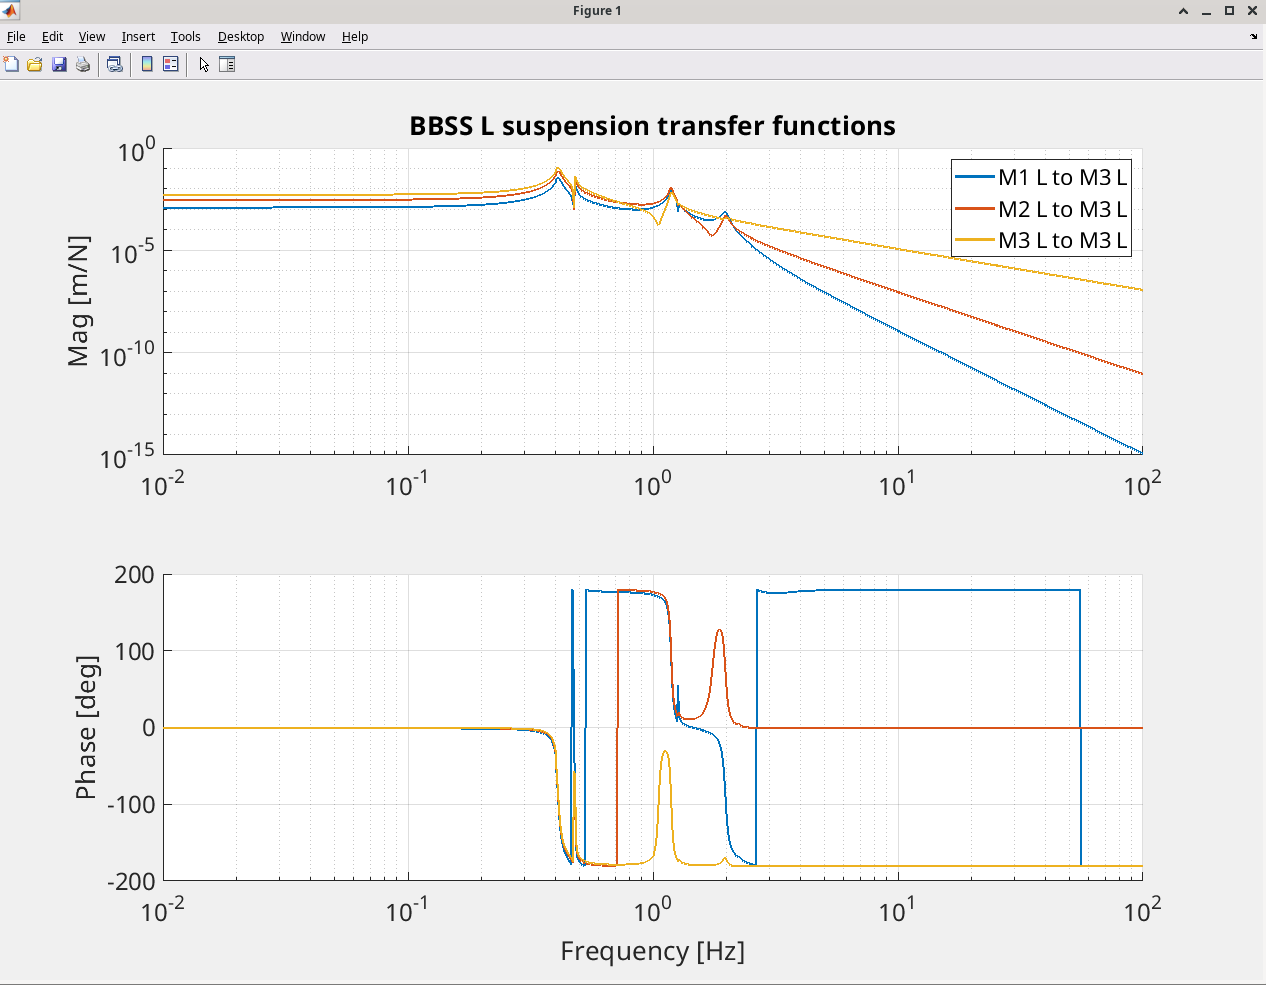
It also seems to me that it should be fairly straightforward to move the MICH length control from M2 to M3, although we will likely need to adjust the locking filters to achieve the same crossover frequency. See third attachment of the comparison of each stage sus transfer function to M3.

I have not been able to generate a model of the oplev damping that looks reasonable, so I will poke around the alog to see if I can figure out what the design is supposed to be.

Executive summary: we should have no problem locking DRMI with the current MICH and BS control scheme, and it shouldn't take that much effort to move BS feedback from M2 to M3 if we so choose.

Images attached to this report
Comments related to this report
elenna.capote@LIGO.ORG - 17:55, Wednesday 22 July 2026 (91203)

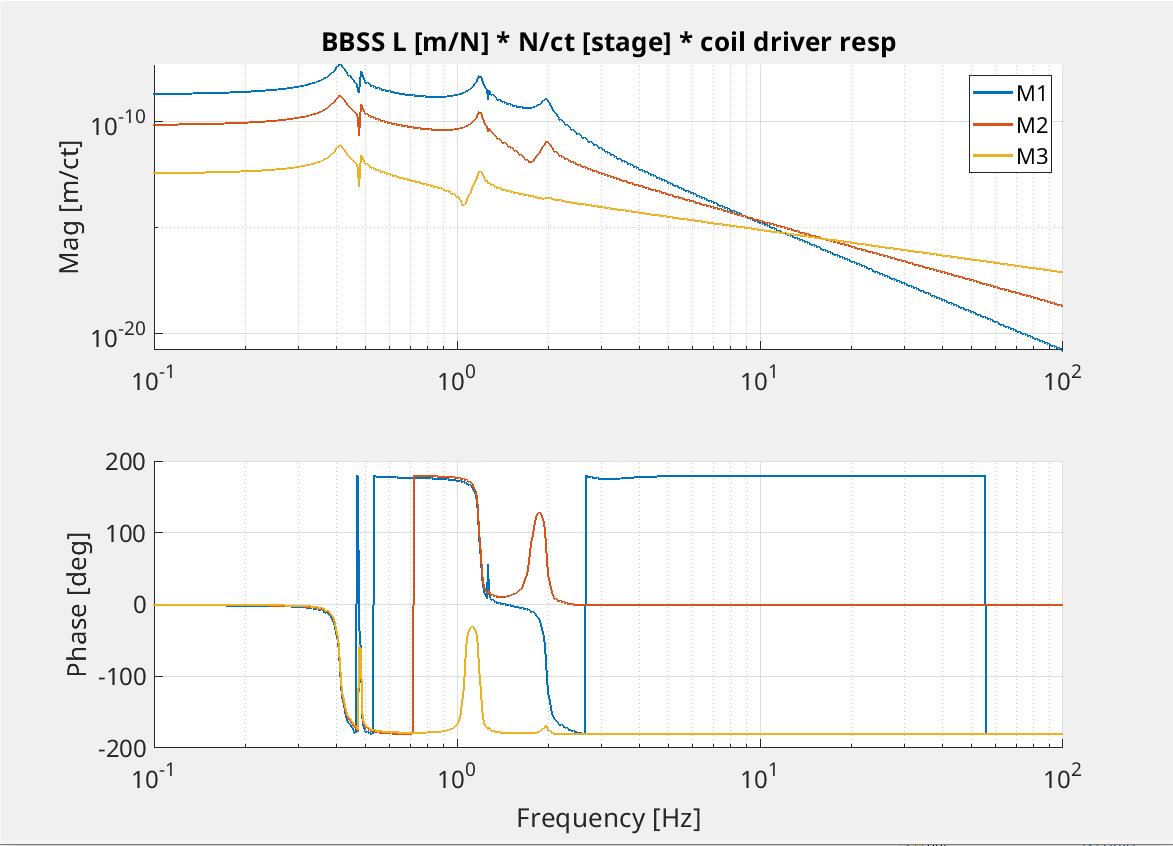
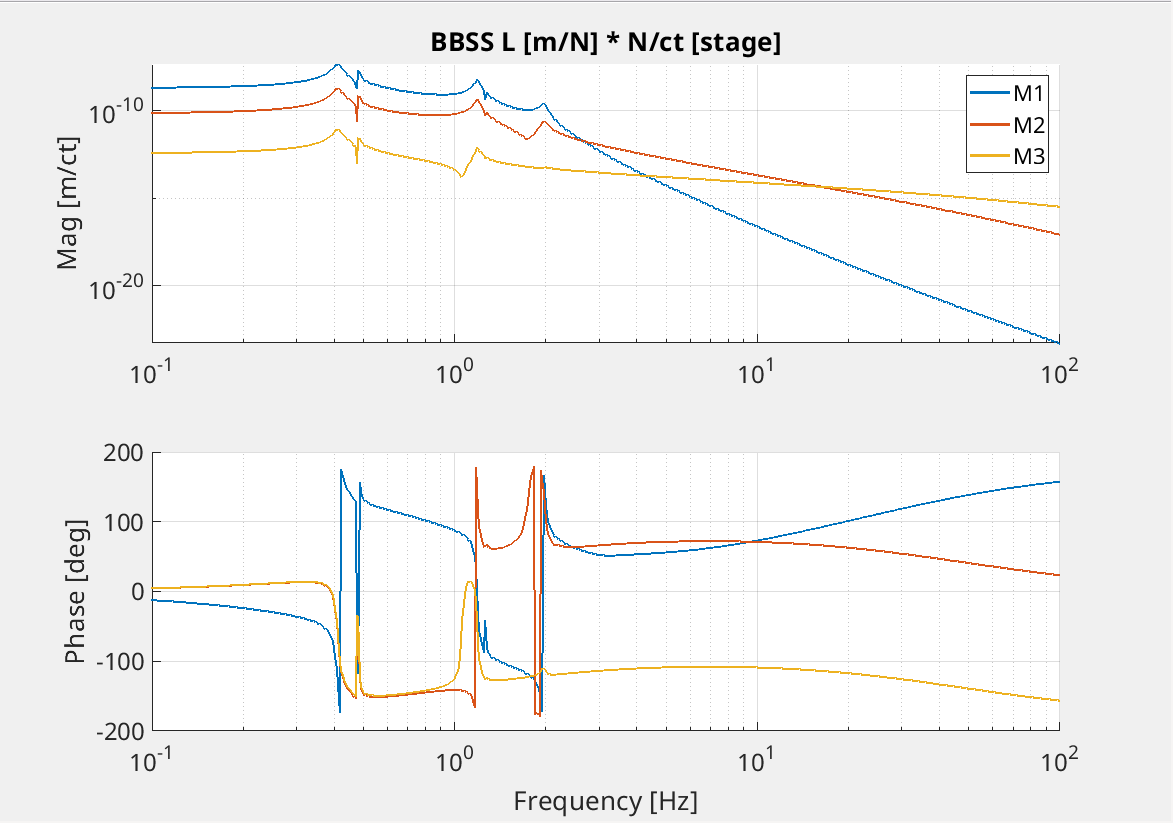
Here are a few additional plots that also describe the actuation authority of the BBSS in length. Thanks to Jeff for encouraging me to make these plots!

The first plot shows the resulting displacement in m you get from each BBSS stage drive request in counts. This drive request assumes you have properly compensated for the coil driver frequency response. This plot shows that below 3 Hz, the top stage is the strongest actuator, whereas M2 is best for the region between 3-15 Hz, and we will get the best response from M3 above 15 Hz.

Next, I made a variation of the plot without compensating for the coil driver response. I still don't fully appreciate the significance of this plot, but I will quote Jeff calling this the "maximum possible range plot" in a given coil driver state.

Finally, I applied our digital offloading filters. Right now, because we always drove the BSFM from M2, the M2 locking bank includes a filter that is essentially an inversion of the M2 to M3 response. I decided to neglect the inclusion of that filter here. I also don't have any of the usual notching that's present, since we still have to determine the appropriate notches for the BBSS. All that really leaves is the top stage integrator and gain factor, which currently sets the M1/M2 crossover frequency to 30 mHz.

Images attached to this comment
LHO VE (VE)
travis.sadecki@LIGO.ORG - posted 16:01, Monday 06 July 2026 - last comment - 17:42, Wednesday 22 July 2026(90907)
HAM2 East door A2F4 viewport swapped, BSC3/FCT bellows reconnected

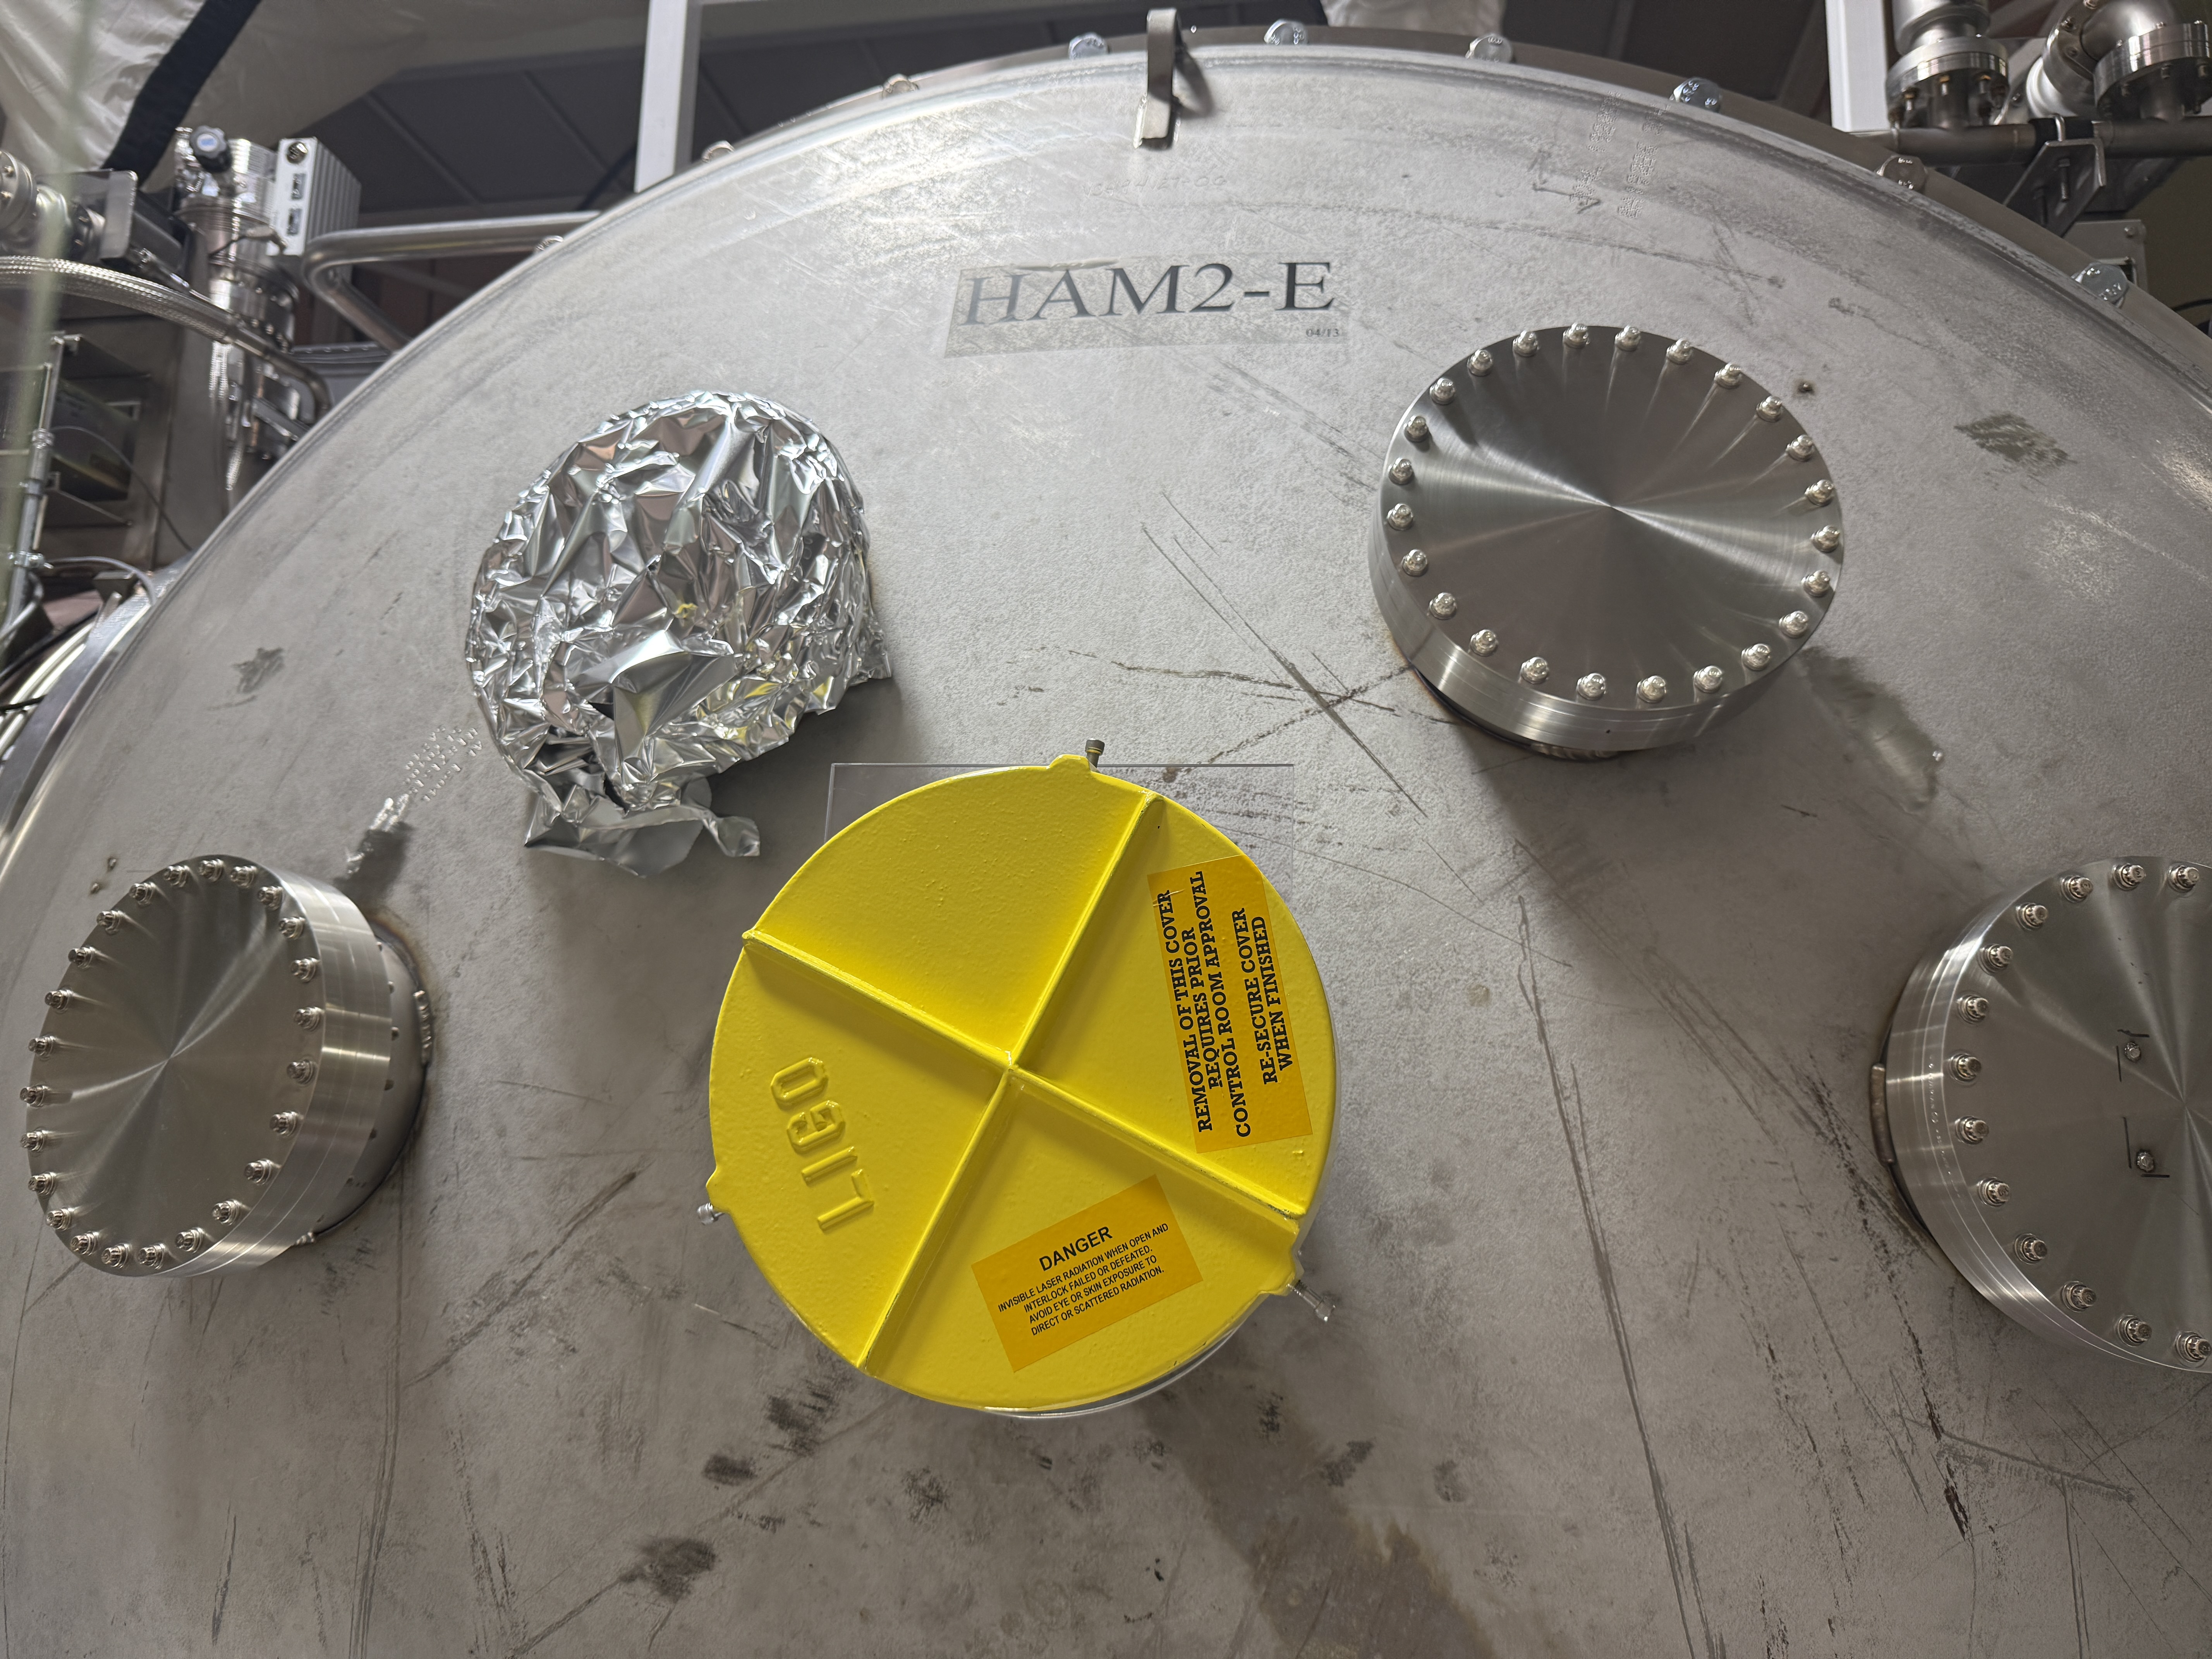
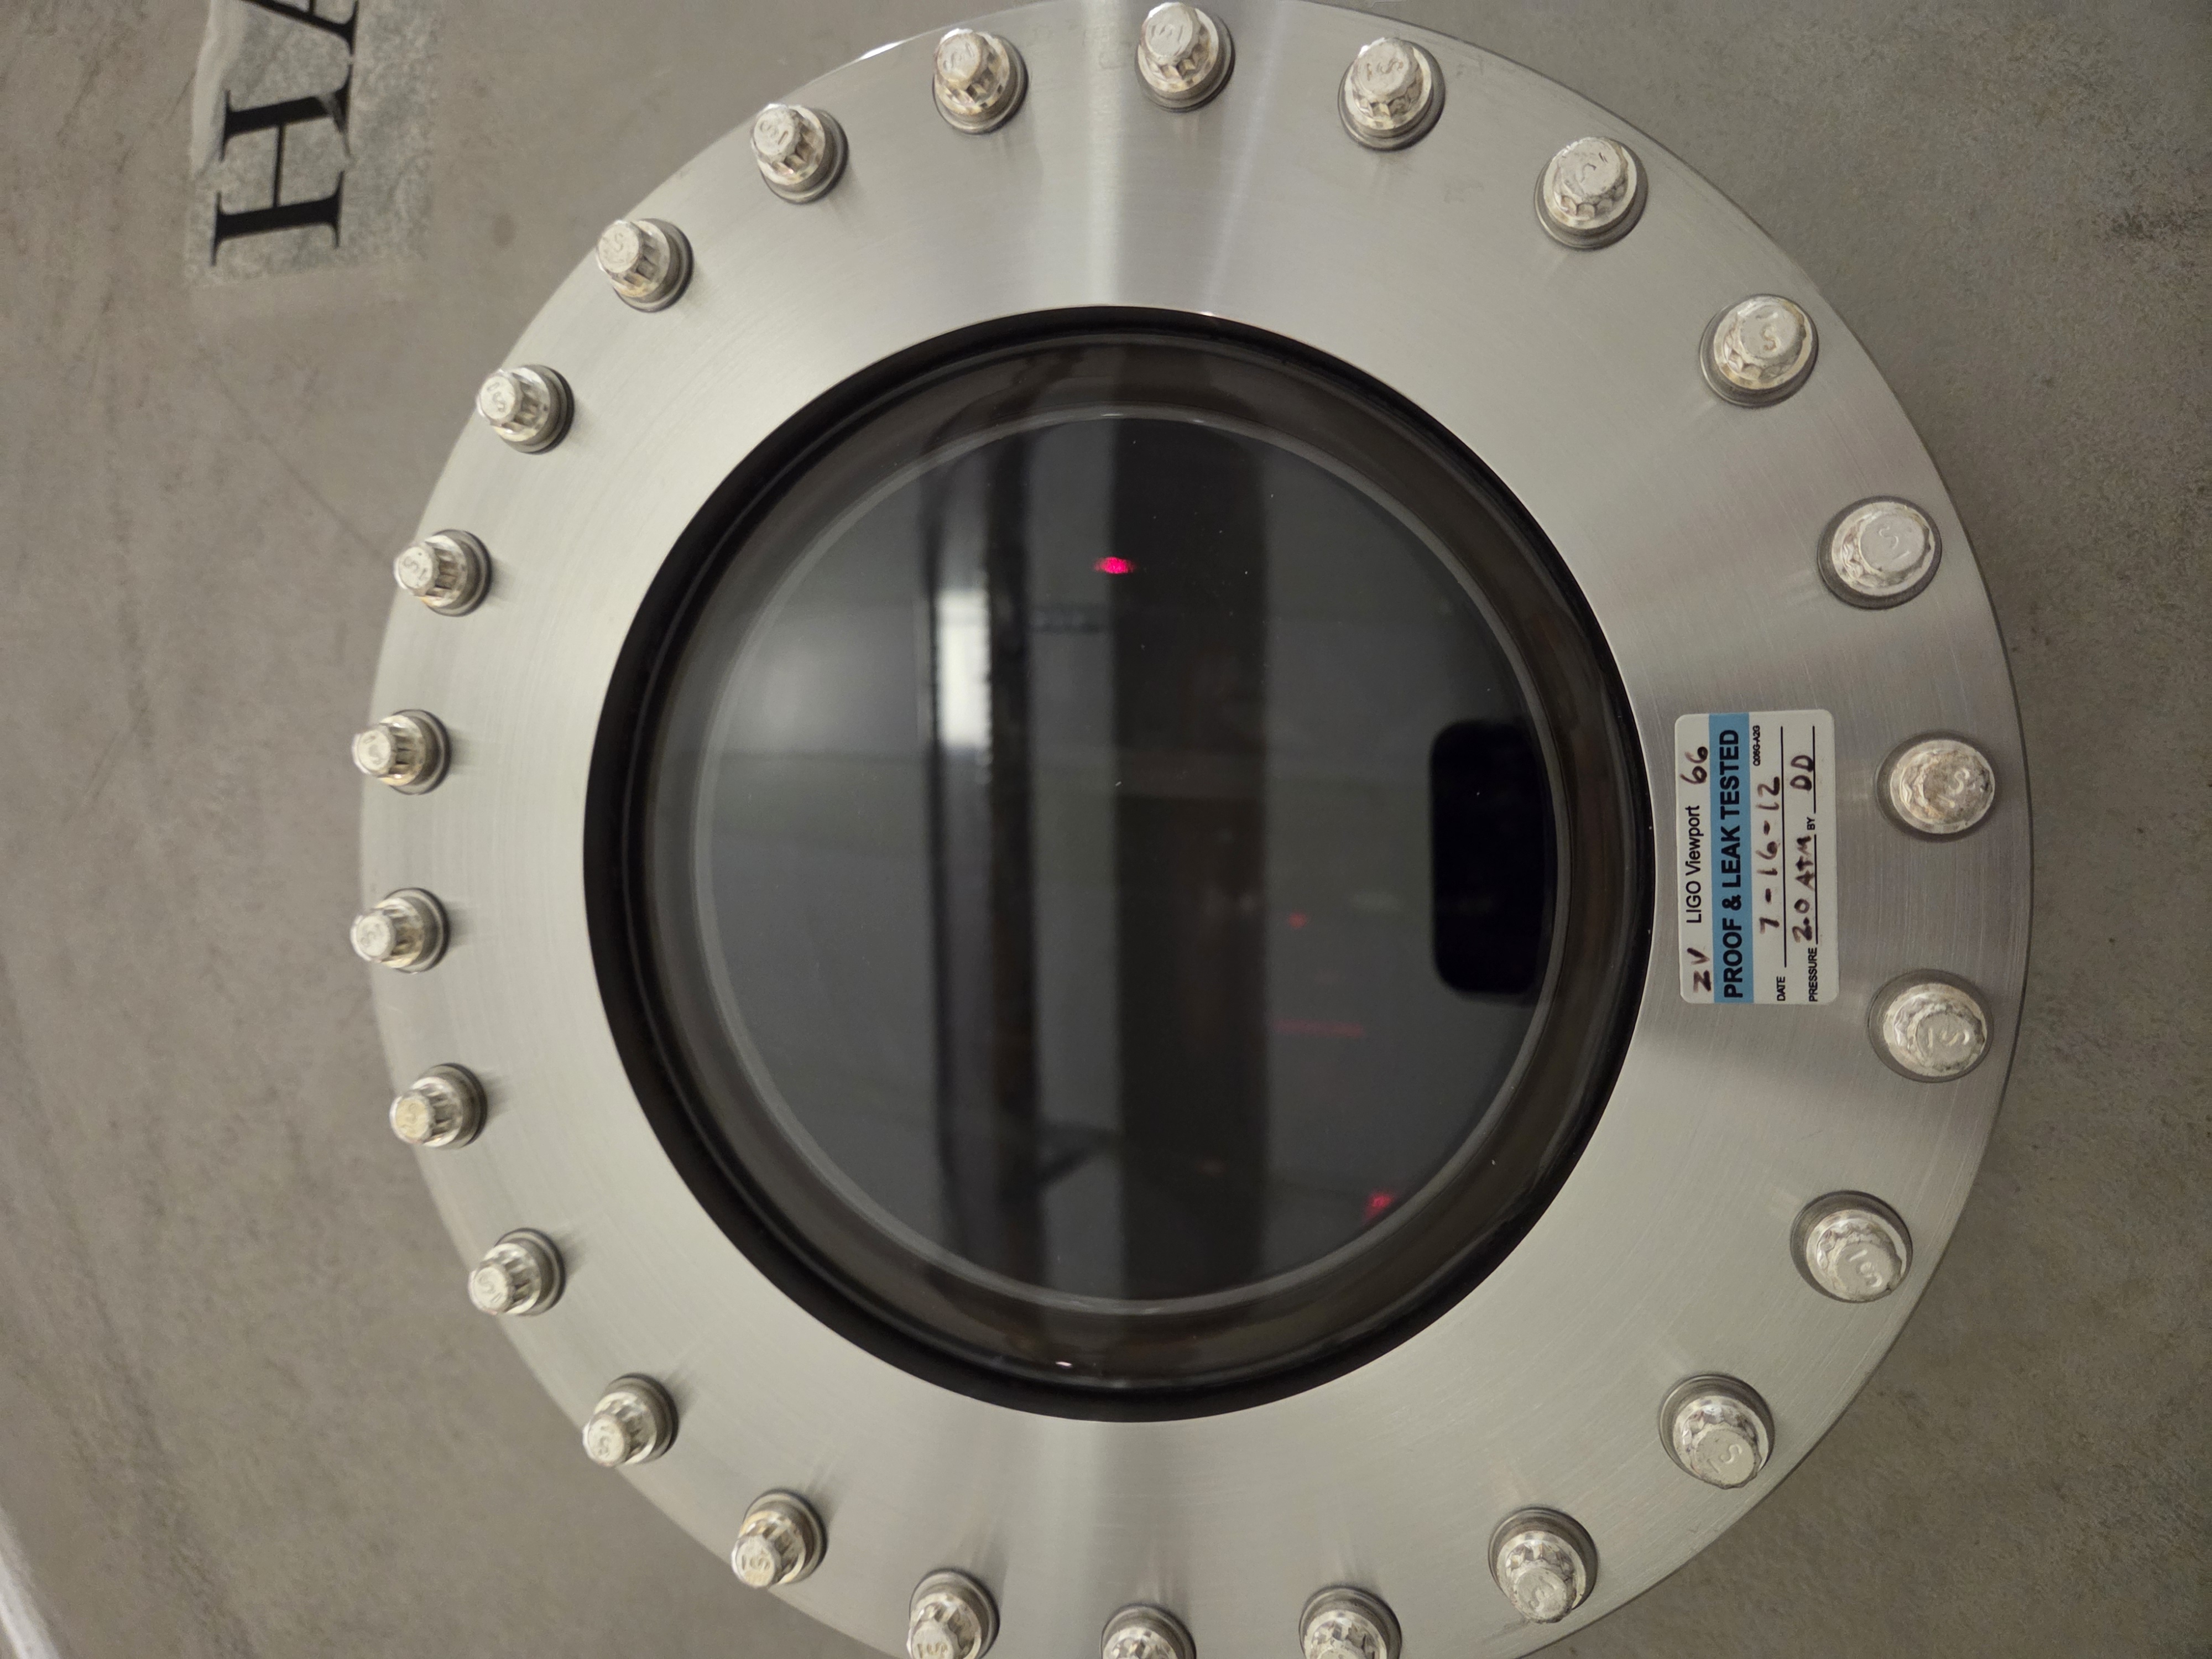
The HAM2 East door A2F4 viewport failed inspection last week and was removed.  It was replaced with a re-inspected ZV-800 that was removed from HAM5 earlier this month.  See pics for SN, etc. 

The FCT bellows that was disconnected at the beginning of the vent was reattached to BSC3 port.

Images attached to this report
Comments related to this report
jordan.vanosky@LIGO.ORG - 15:50, Tuesday 07 July 2026 (90931)

Today we also installed a viewport on the A2F1 port of HAM2, this viewport (ZV-800 Uncoated SN66) was removed from the west door of HAM2 (see alog 90780) and re-inspected on the bench. No issues found.

Images attached to this comment
melina.fuentes-garcia@LIGO.ORG - 17:42, Wednesday 22 July 2026 (91202)

Small correction: Viewport SN 66 came off of HAM2 A2F2 East door (same door as where it ended up). This follows with FRS 38164 and inventory lists.

HAM2 A2F2 SN 66 →  removed, inspected, moved to → HAM2 A2F1

H1 SQZ
begum.kabagoz@LIGO.ORG - posted 17:36, Sunday 14 June 2026 - last comment - 12:56, Wednesday 22 July 2026(90613)
HAM7 - FC path mode matching projections from beam profile data

Below is the analysis for data taken on the FC path: between ZM1 and ZM2 and between ZM2 and ZM3, with Nanoscan, see Camilla's log 90573. As a reminder, ZM1 are flat optics, ZM2 is a PSAM with variable curvature, FC1 HR side is flat, AR side is curved with RoC ~1m. 

The data suggest that the OPO mode is slightly different from O4 OPO, and also strongly suggest a new optimal ZM2 PSAM voltage can be found within the range. 

We measured the beam profile at 5 different points after ZM1 with A:L2 lens at its nominal 0 position (sled that the lens lives on is flush to its translation stage on both front and back edges). At the last point with A:L2 at 0, we realized it would be pertinent to measure beam profiles for the two extremities of the A:L2 translation stage: -13 mm, which is closer to ZM1 by 13 mm and +17 mm, which is 17 mm further from ZM1. We then proceeded to take 5 measurements (again downstream from ZM1) for each of these lens positions. The nanoscan screenshots for each measurement are attached in the .zip folder. 

The attached gif shows the beam waist position estimation extracted from the beam profile scans downstream ZM1, for all three A:L2 positions. The "target" and "O4 x/y" come from Keita's log 59515The overlap plot attached shows the field overlap in percentage for all three A:L2 positions, with target and O4 beam parameters. With A:L2@0, the overlaps are above 99%, which bodes well for the FC mode matching prospects. There could potentially be a better mode matching solution to the "target" or "O4" for A:L2 between 0 pos and -13mm pos. However, the following measurements betwen ZM2 and ZM3 suggest fine-tuning of A:L2 position will not be necessary. 

We also measured beam profile between ZM2 and ZM3 for three different points, setting ZM2 PSAM voltage to 4 different values at each point. The "nominal" O4 strain gauge (S.G.) for ZM2 has been 3.15 V, which corresponds to ~ 60 or 90 V pzt supply voltage depending on which direction one scans from. The edges of the psam range are 0 V and 196 V, which corresponds to ~1.2-1.3 V and ~6.04 V S.G. respectively. In the interest of more uniform sampling of the available psam curvatures, we also chose to sample 4.5 V S.G. (~120 V or 150 V). 

This table shows experimental data mapped to radii of curvature of the ZM2 mirror, using Camille's E2100298. The exact PZT strain gauge/ PZT supply voltage that gives a certain RoC is affected by the hysteresis curve i.e. sweep direction.

Strain Gauge (V) PZT Supply Voltage (V) RoC (m) with increasing scan RoC (m) with decreasing scan
1.3 V 0 0.8211 0.82202
6.0x V 196 0.8911 0.89114
3.1x V 60 (d) or 90 (i) V 0.8523 0.85025
4.4x V 120 or 150 V 0.87534 0.87242

Attached gif for propagation between FC1 and ZM2 show esimated beam parameters for all four SG cases: 1.3, 3.1x, 4.4x and 6.0x V. The exact values for the strain gauge varied from one beam profile position to the next, however it should be good enough to tell if we have enough range on ZM2 or not.

The gif switches between different SG values once every 2 second, the lefthand plot is useful in looking at the beam divergence near FC1 while the righthand plot is a zoom-in around the beam waist. Looking at the estimated beam waist position for 1.3 V and 3.1x V cases switching across the "FC x/y waist", "VOPO target waist", ''O4 x/y waist", we can guess there could be a better mode matching solution between these two SG values. "FC x/y waist" comes from the Finesse eigenmode solution for the FC path (thanks Kevin Kuns!), target and O4 values are the same from the above-mentioned Keita log, assuming ZM2 curvature to be 0.85025 m (3.15V SG), and the following distances between the optics: A:M3 --> ZM1: 158.2 mm, ZM1--> ZM2: 1498.625 mm, ZM2 --> ZM3: 1821.497 mm, ZM3--> FC1: 1000.261 mm. Camilla extracted these distance values from D1900365-v1.

Knowing the applied PZT voltage and the corresponding RoC, we can use the measurements at 3.1x V and 1.3 V to estimate the mode matching we would obtain if we swept the RoC between that of these strain gauge values. The attached FC mode matching projection plot is computed by taking beam parameter estimated from the beam size measurements for 3.1x V, propagates the beam back to ZM2, unapplies the estimated RoC (decreasing RoC value was used informed by data, indicated in bold in the above table), then reapplies the RoC between these two values, after the overlap with the FC eigenmode is calculated. This projection suggests that mode-matching points with >99% overlap for both x and y axes are accessible. Clearly, there is varying astigmatism with strain gauge setting, see beam profile plots where 3.1x and 6.0x V shows beams with smaller astig. than the other two points. Since the PSAM characterization data gives only a single RoC number rather than separate x/y effective curvatures, the projection should be interpreted as approximate. In practice, the final optimization should be done empirically.

The effect of the astigmatism is also apparent in this defocus vs beam size at FC1 plot that shows mode matching contours. The calculation is made at the FC1.p2.o plane in Finesse.


Images attached to this report
Non-image files attached to this report
Comments related to this report
begum.kabagoz@LIGO.ORG - 14:06, Wednesday 24 June 2026 (90744)

The beam width data kindly tabulated by Camilla, the R(V) data from Camille's dcc E2100298, and the analysis code .py are attached, in the .zip. Fair warning, the analysis code also makes a bunch of plots I find useful to look at but another user may find irritating :)

Non-image files attached to this comment
begum.kabagoz@LIGO.ORG - 16:03, Wednesday 24 June 2026 (90746)

Code for the data points upstream of ZM2 attached. The measured beam widths and their corresponding position are listed in the script. The real raw data with the screenshots from the beam profiler UI is attached to the main log. 

Non-image files attached to this comment
eric.oelker@LIGO.ORG - 16:48, Friday 26 June 2026 (90781)

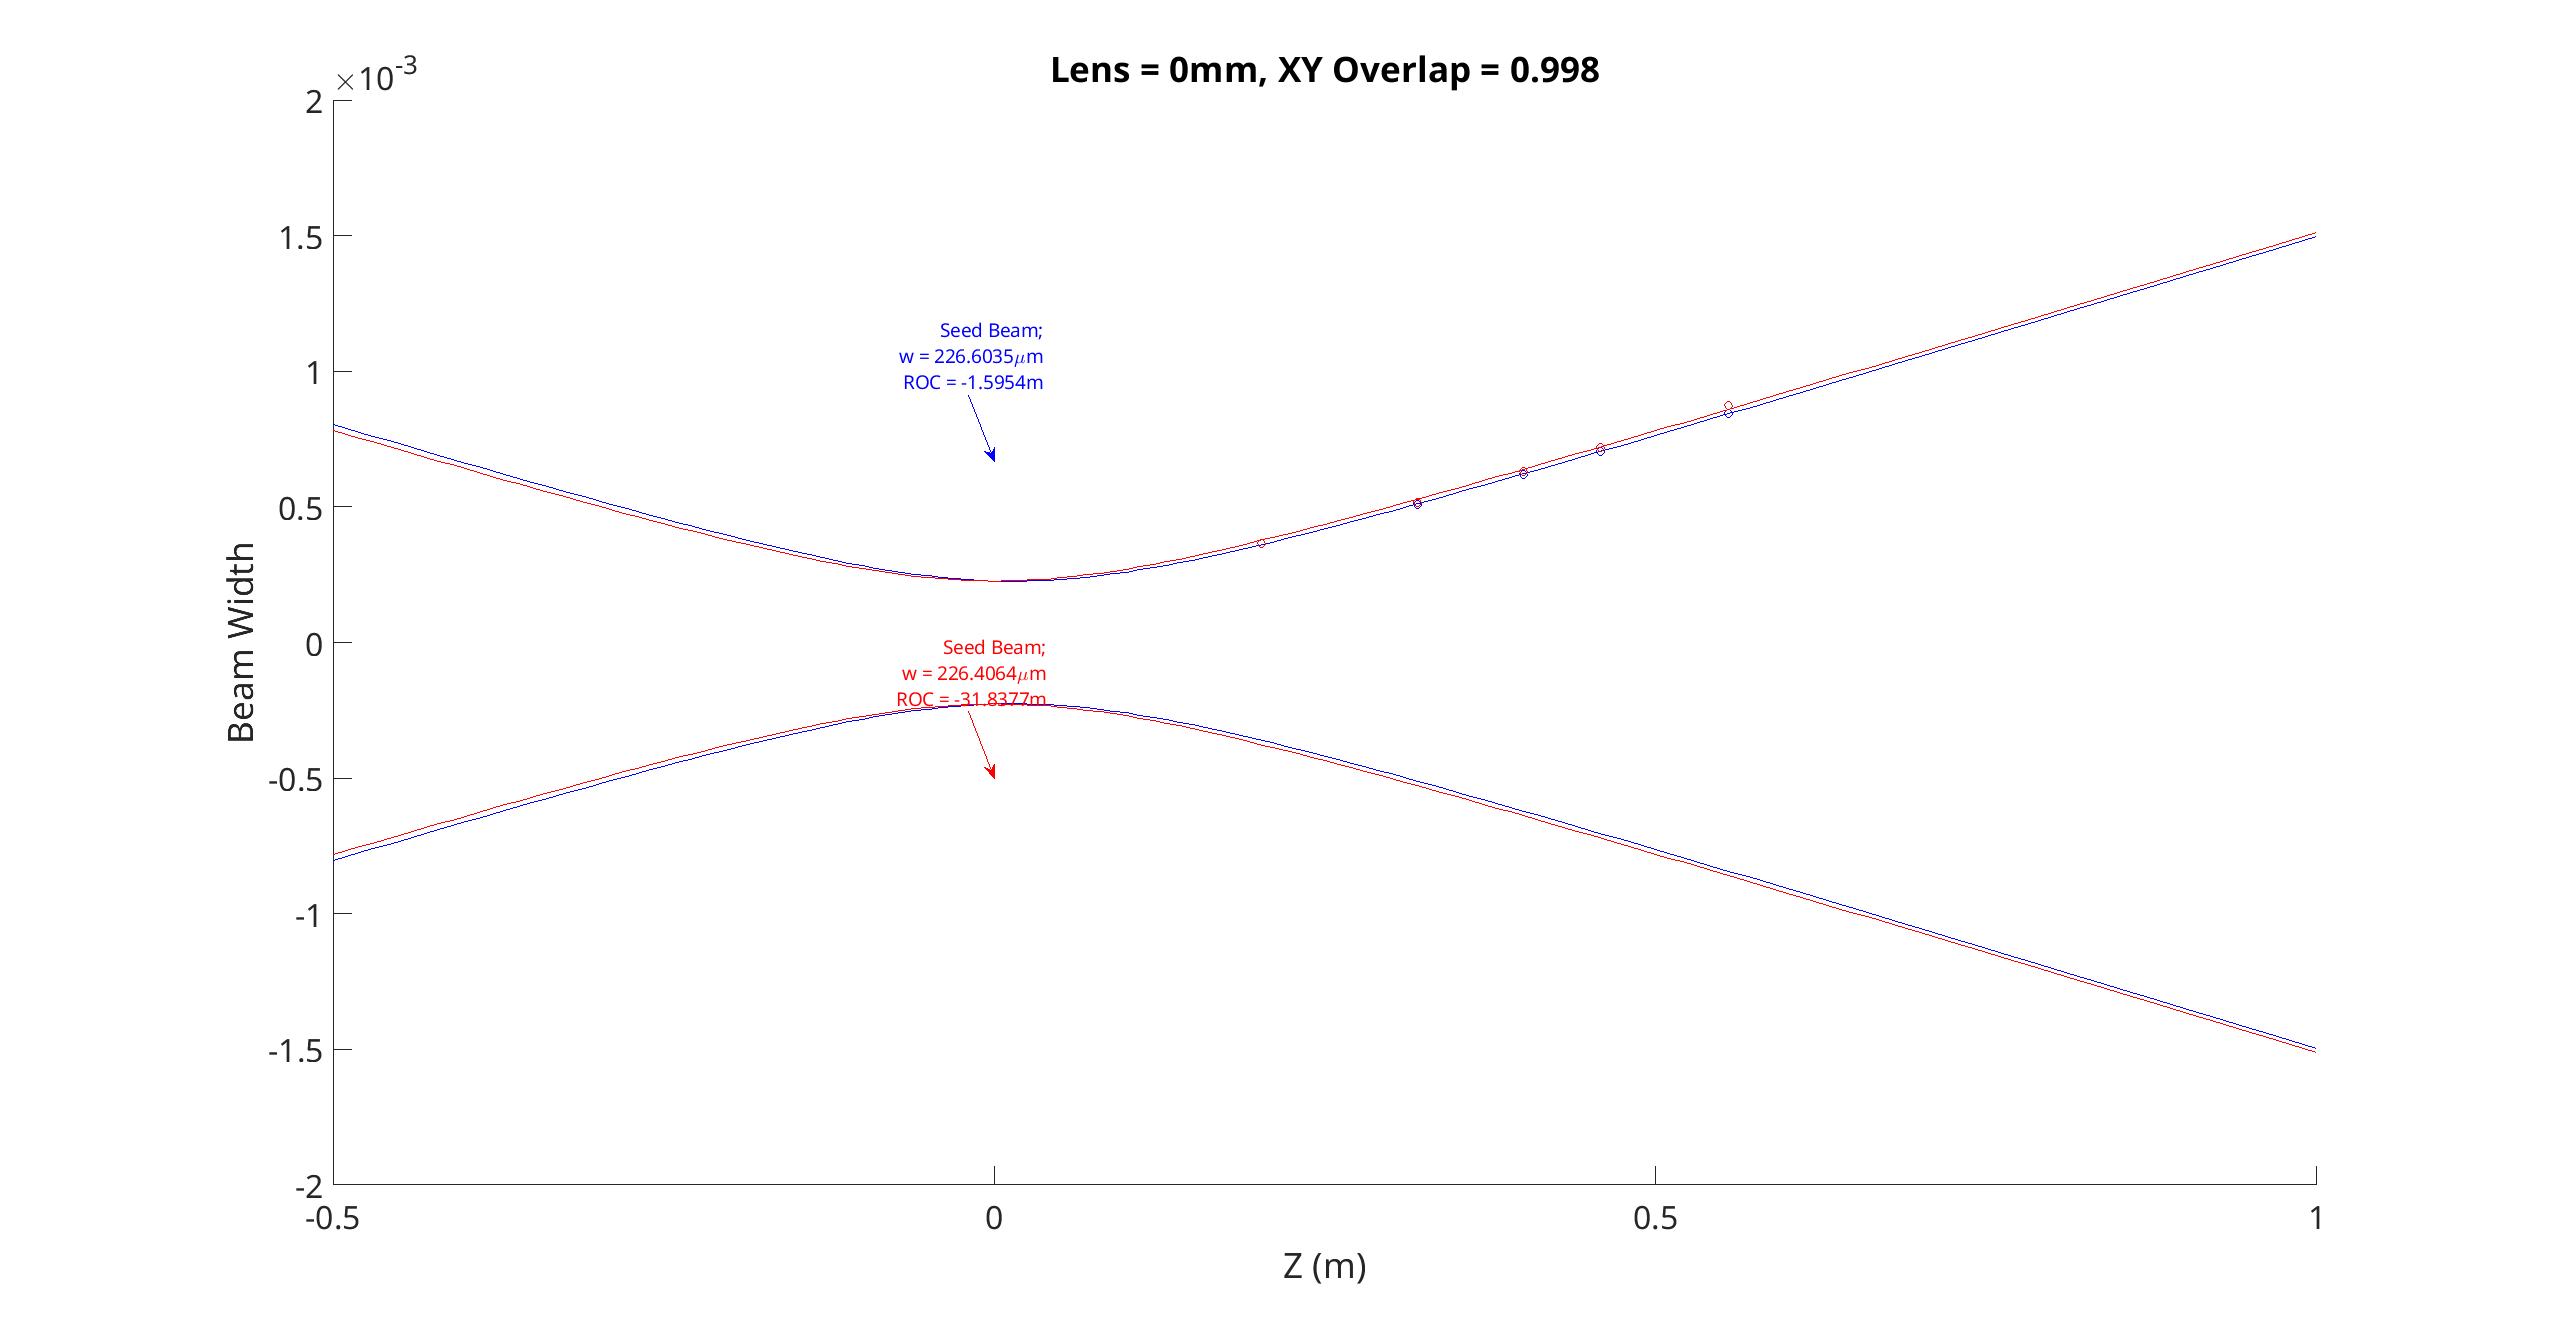
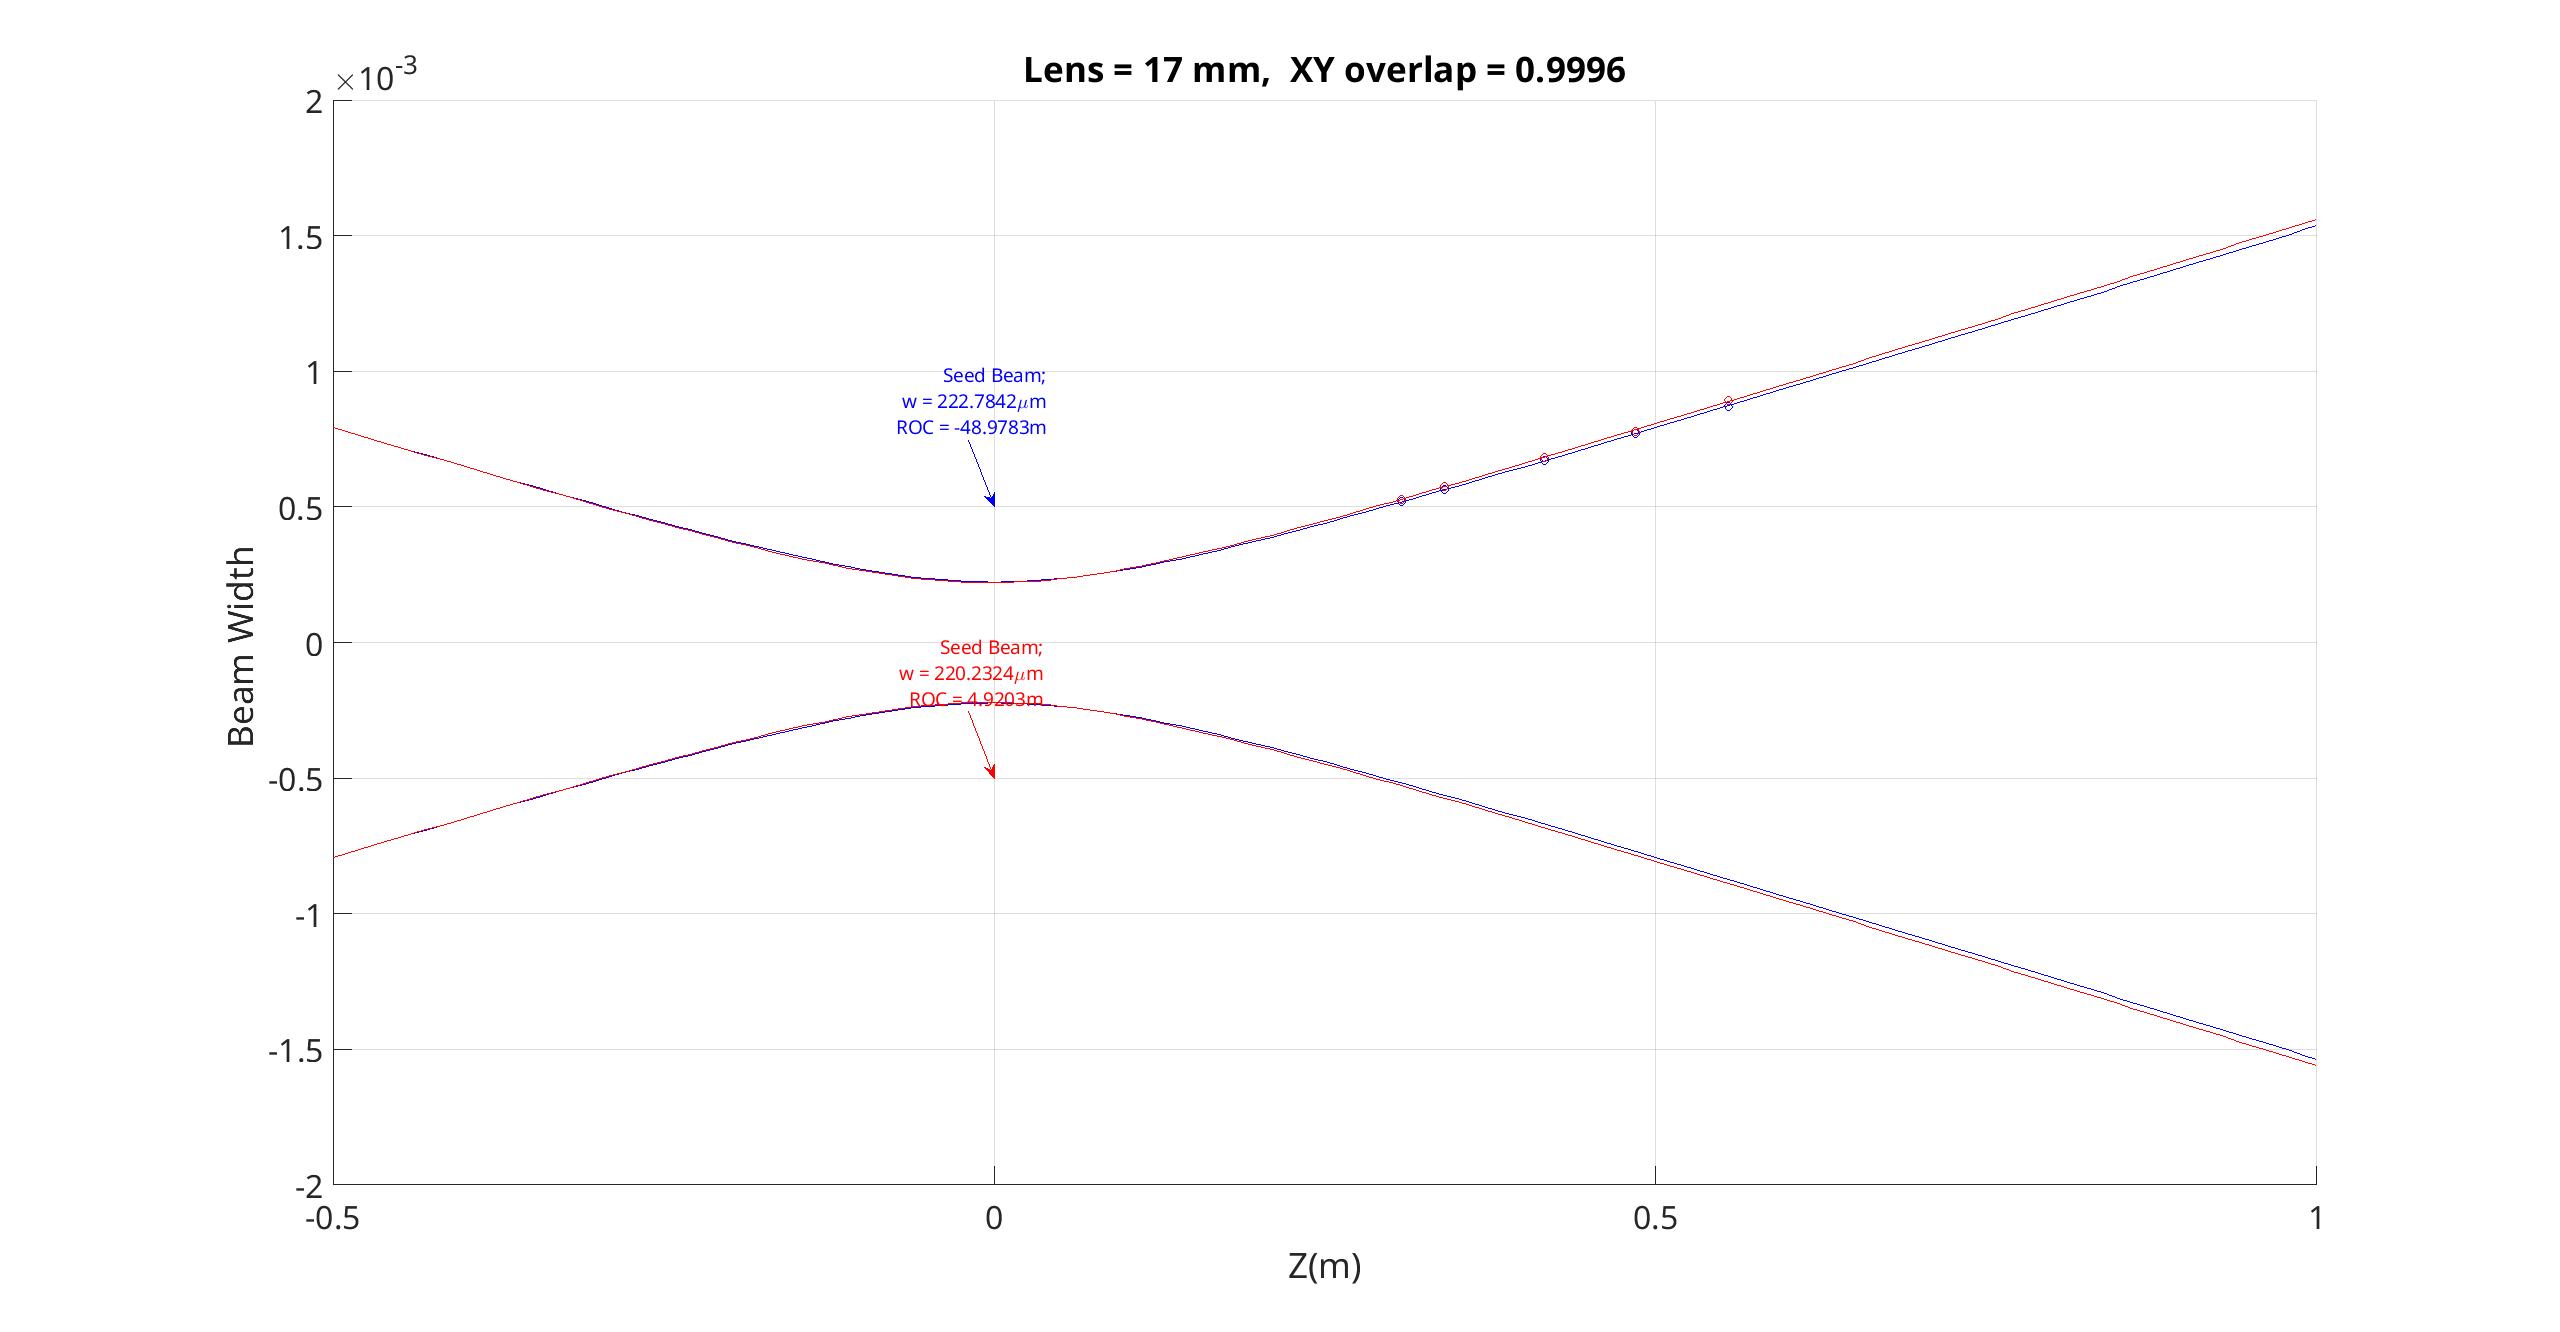
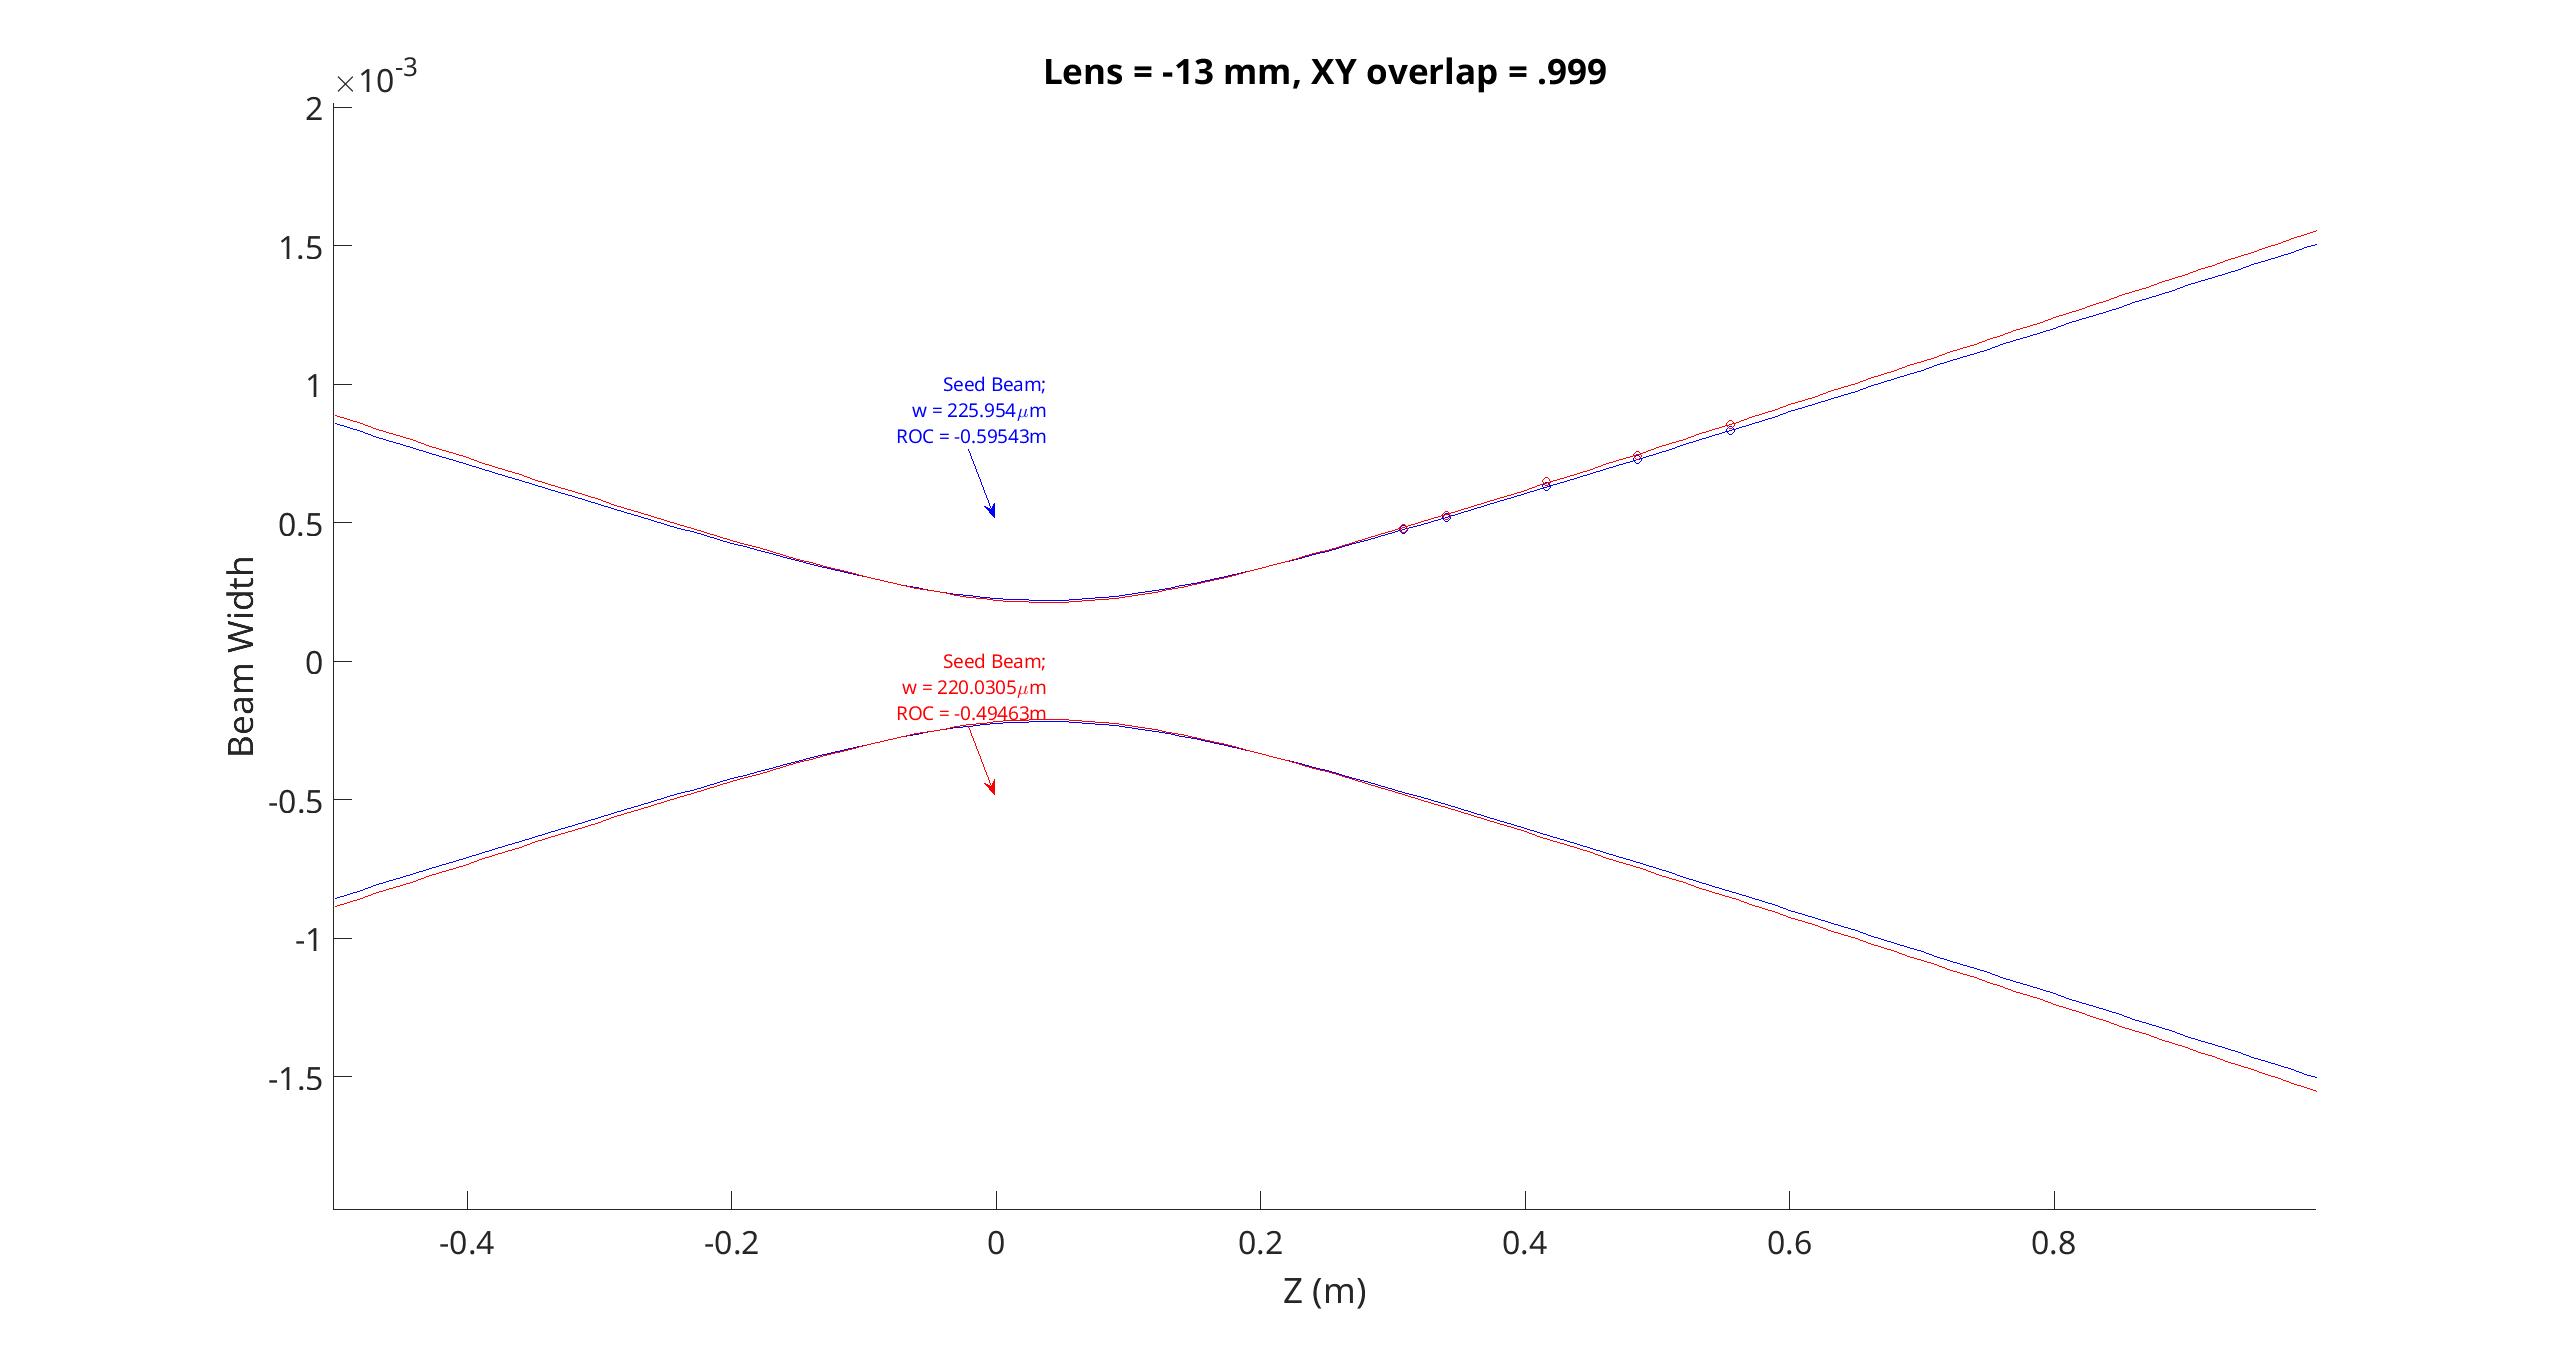
I wanted to try to get an idea of what sort of astigmatism we're seeing on the FC path.  I was able to get good fits of Begum's data right after ZM1.  This indicates that the astigmatism coming right off of the VIP looks quite good ( 99.9 +/- 0.1% overlap between X and Y).  Plots of the fits are attached for each lens position.


I wasn't able to get particularly convincing fits of the data after ZM2.  The points are several Rayliegh ranges away from the waist and I found that the fits were quite sensitive.  I could get answers anywhere between 98%-100% mode overlap between X and Y depending on what parameters I used in a la mode for the seed waist.  Someone might be able to do a more sophistocated fit of the data, but I think one would want to measure closer to the waist to better constrain the fit and get a more precise estimate of the astigmatism added by ZM2.  

Images attached to this comment
Non-image files attached to this comment
eric.oelker@LIGO.ORG - 12:09, Wednesday 01 July 2026 (90853)

I've been reading through the design document about the FC path and ZM2.  One thing imay be important to note when making projections about the correct strain gauge setting for ZM2:  According to the design document the mode matching is quite sensitive to the exact value of the FC1 AR surface ROC.  One might find that, if we change our assumption about the ROC for S2 of FC1, our target strain gauge setting for ZM2 changes significantly.  In fact, the discussion makes it sound like most of the point of having ZM2 be adjustable was to compensate for our uncertainty in the ROC of S2 for FC1. 


See LIGO-T1900649 and the discussion on Page 18 as well as Figure 10.

begum.kabagoz@LIGO.ORG - 11:55, Thursday 02 July 2026 (90879)

A note on the FC1 ROC sensitivity question: a scalar FC1 ROC sweep alone would be only partially informative, because the projection also depends on the FC-path distances and the voltage-dependent x/y astigmatism of ZM2 (see plots for the mode space and projected overlap with eigenmode from the original log). This is why the original log interpreted the projection as approximate and stated that the final optimization should be done empirically.

The more meaningful check right now is therefore a return-beam measurement between ZM1 and ZM2 while stepping the ZM2 strain-gauge setting. This can be done by placing a beam splitter between ZM1 and ZM2 and matching the return beam to the input beam by varying ZM2 curvature. 

The modeling exercise could be a nice little real life vs model analysis later on. 

begum.kabagoz@LIGO.ORG - 12:56, Wednesday 22 July 2026 (91191)

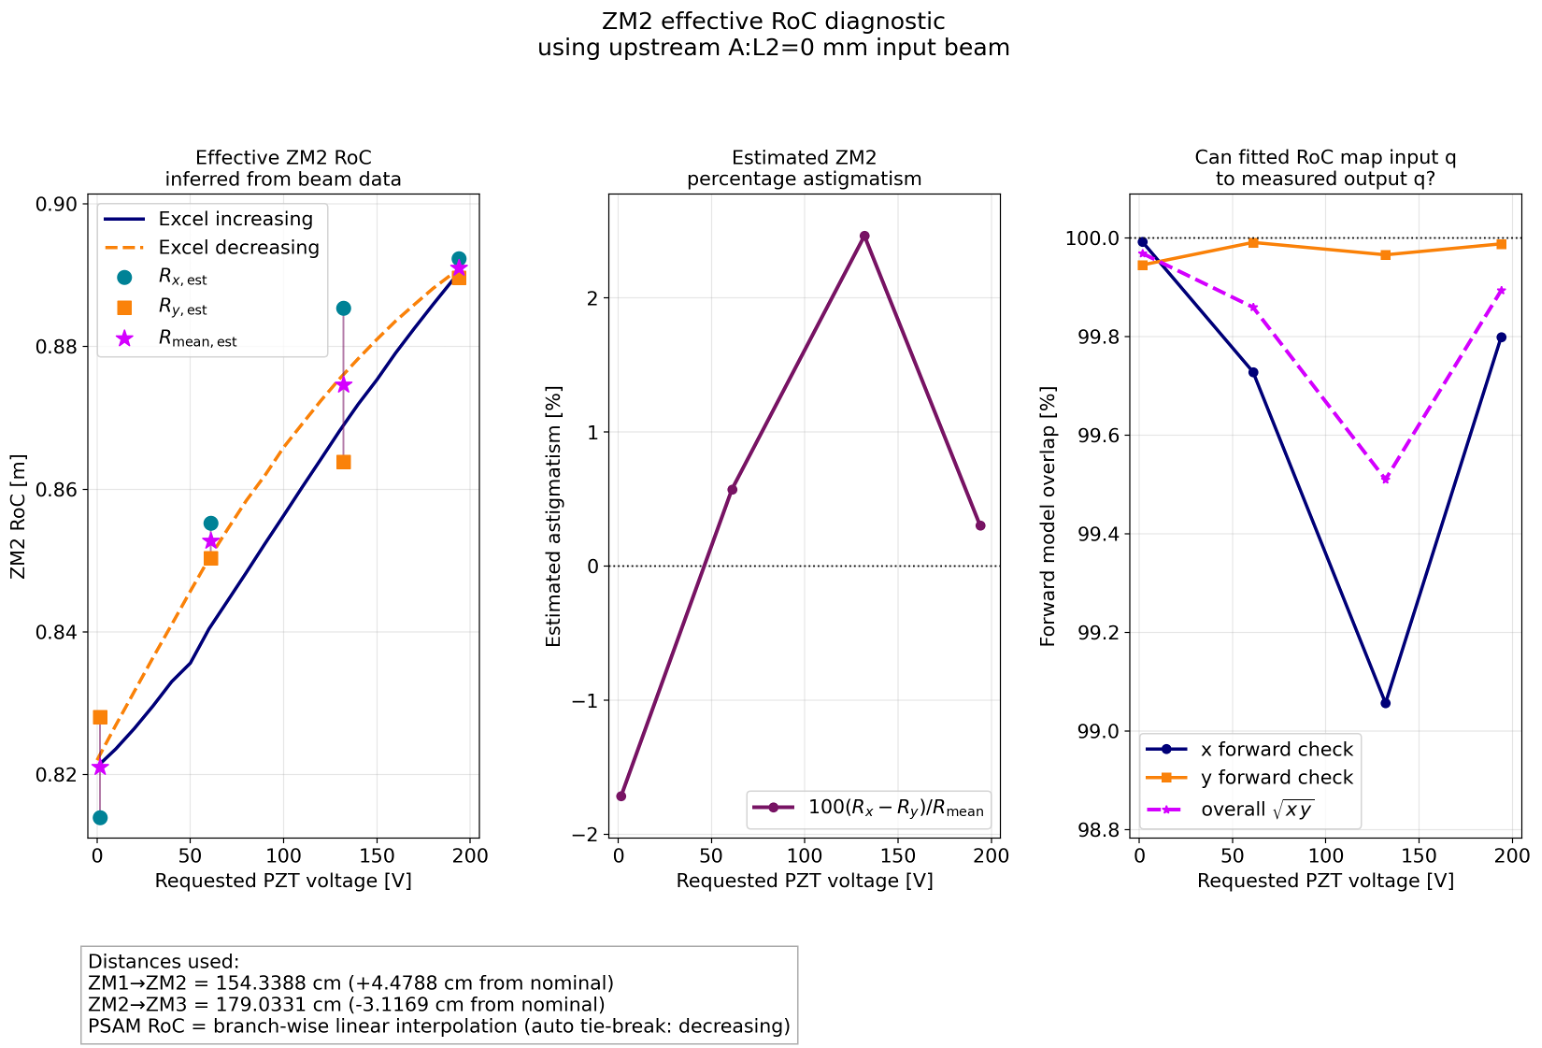
Attached figure left panel shows RoC in x (green circle) and y (orange square) calculated from the beam profiles taken downstream of ZM2, with 4 different strain gauge values. 
These S.G.s were selected as 0 V (S.G. 6.x V), 200V (S.G. 1.x V), 60 V (3.1x V, nominal for O4), 132V (4.x V). 
The pink stars are composite RoC obtained from the geometric mean of the beam profile data in x and y. 
The measurements are overlaid with Camille's characterization of the ZM2 PSAMS (SN2), orange dashed line and dark blue solid line. The measurements and Camille's calibration are consistent for the composite RoC. 

The middle panel shows the percentage astigmatism for each of these S.G. values, ranging within +-2.5% for these four measurements. Note that the astigmatism is not a monotonous function of supply voltage. This means we cannot interpolate the astigmatism for the operation point we end up in reliably, at least with such few measurements. 

The righthand plot is probably the least interesting. It shows how well the beam profile measurements downstream of ZM2 overlap with beam parameter estimation using measurement upstream of ZM2 and the CIT calibration. It means we need RoC x and RoC y rather than a composite RoC if we want to use CIT measurements in modelling, in the absence of in-chamber measurements. Notice the higher the astigmatism the worse the overlap, as expected. 

Since we care about a few percent loss at this point, these astigmatism levels are disturbing. 

Images attached to this comment
Displaying reports 501-520 of 89074.Go to page Start 22 23 24 25 26 27 28 29 30 End