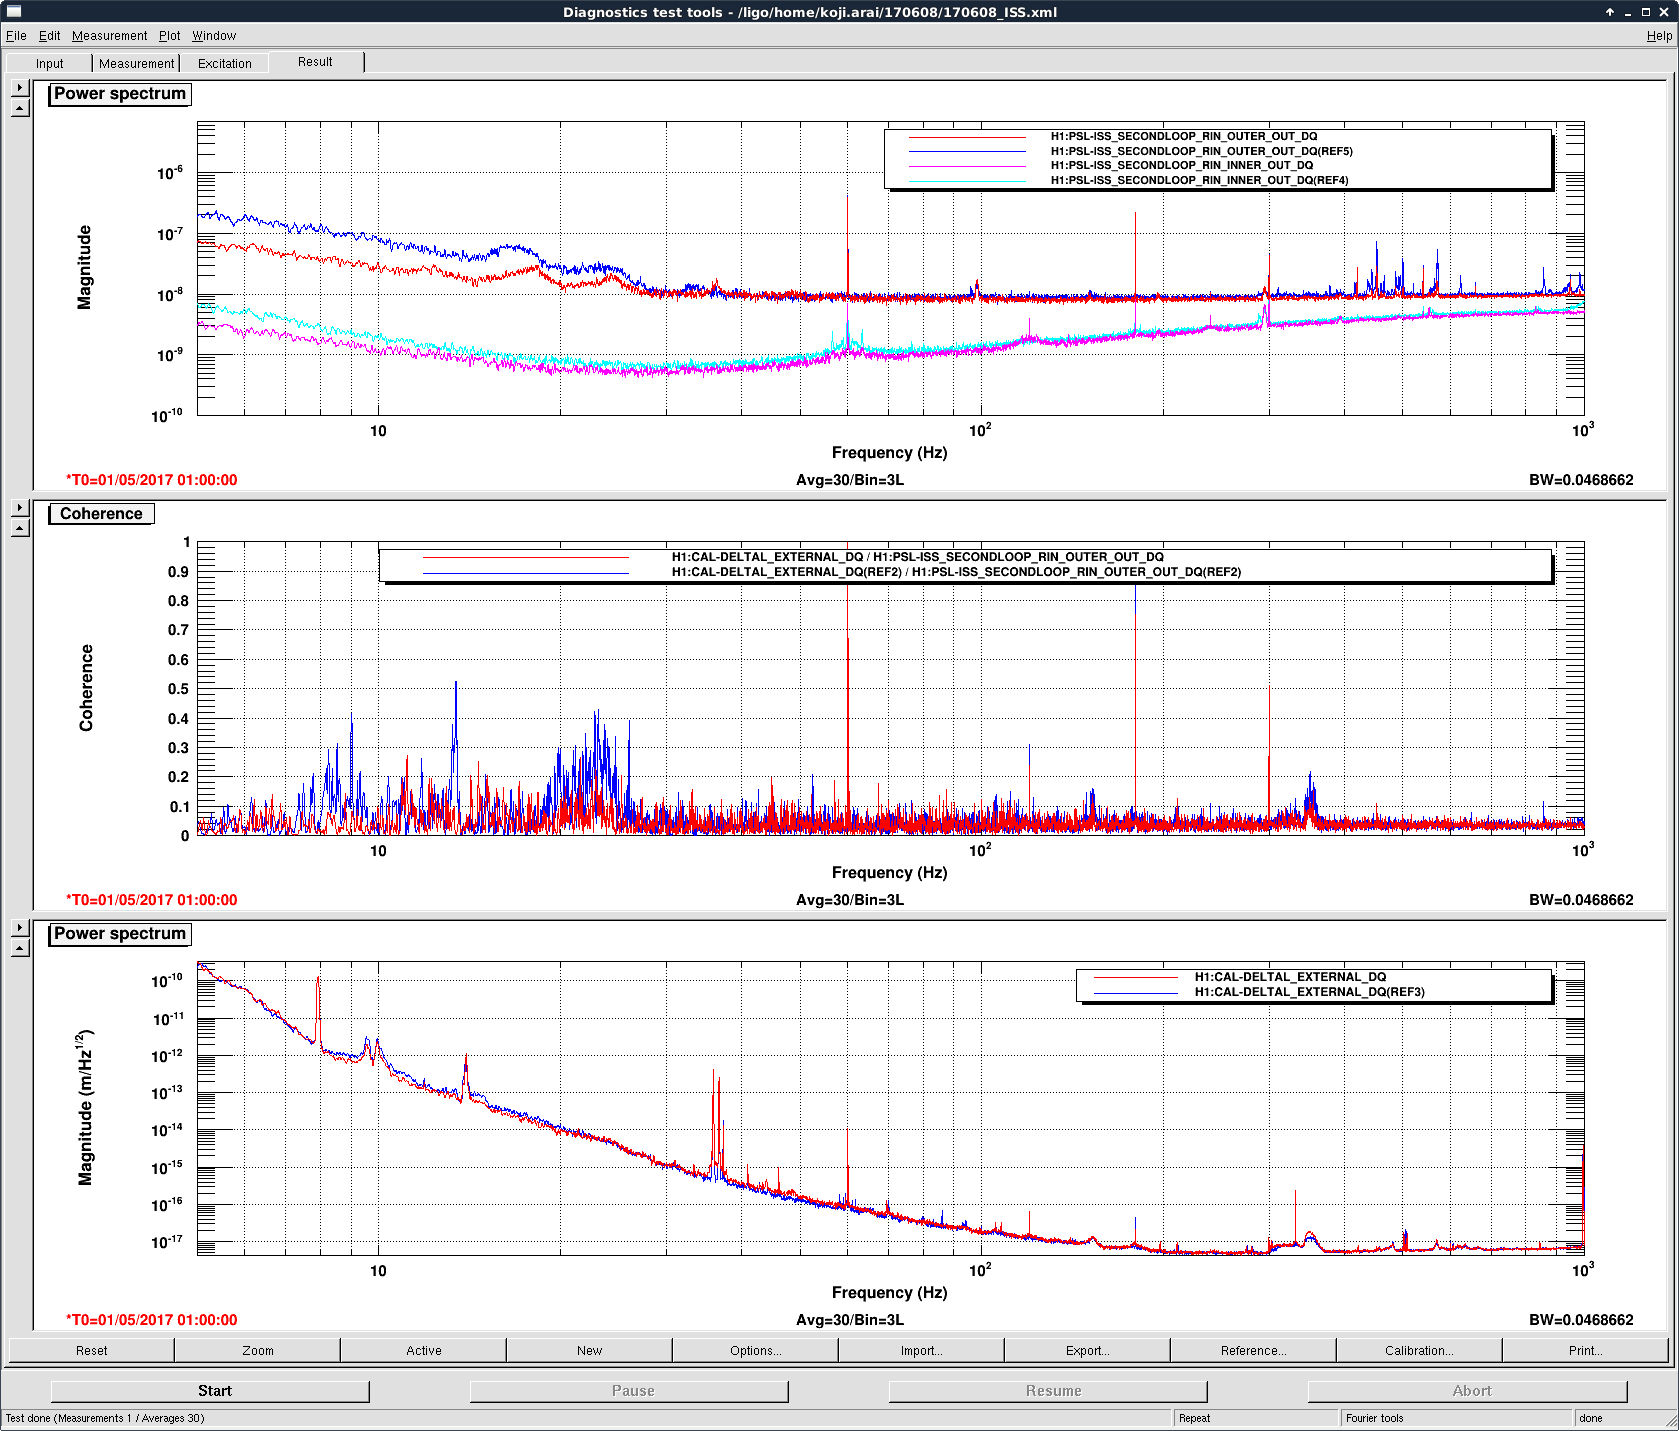
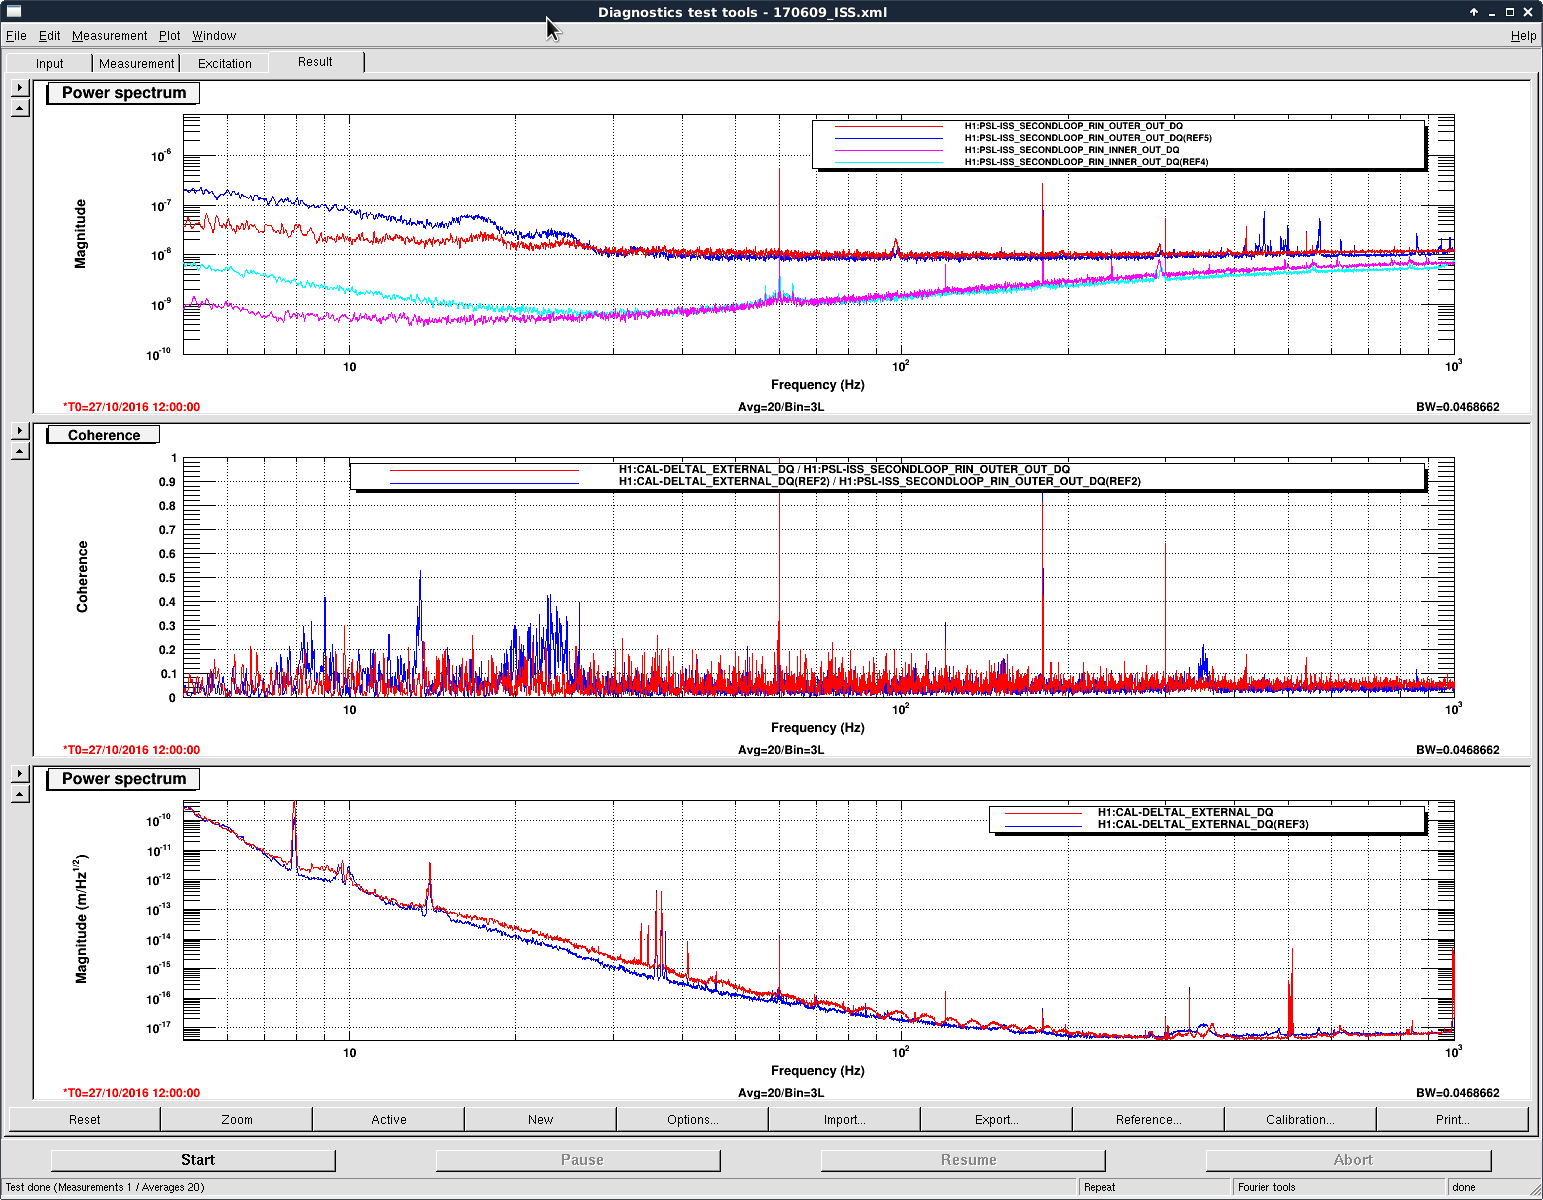
Jenne and I reviewed the ISS status this morning. Jenne noticed that the RIN of the 2nd loop out-of-loop PD array shows increased coherence between 7~30Hz. I continued to investigate the comparison of the ISS state between now (6/8 19:00 UTC) and May 1st (5/1 1:00 UTC).
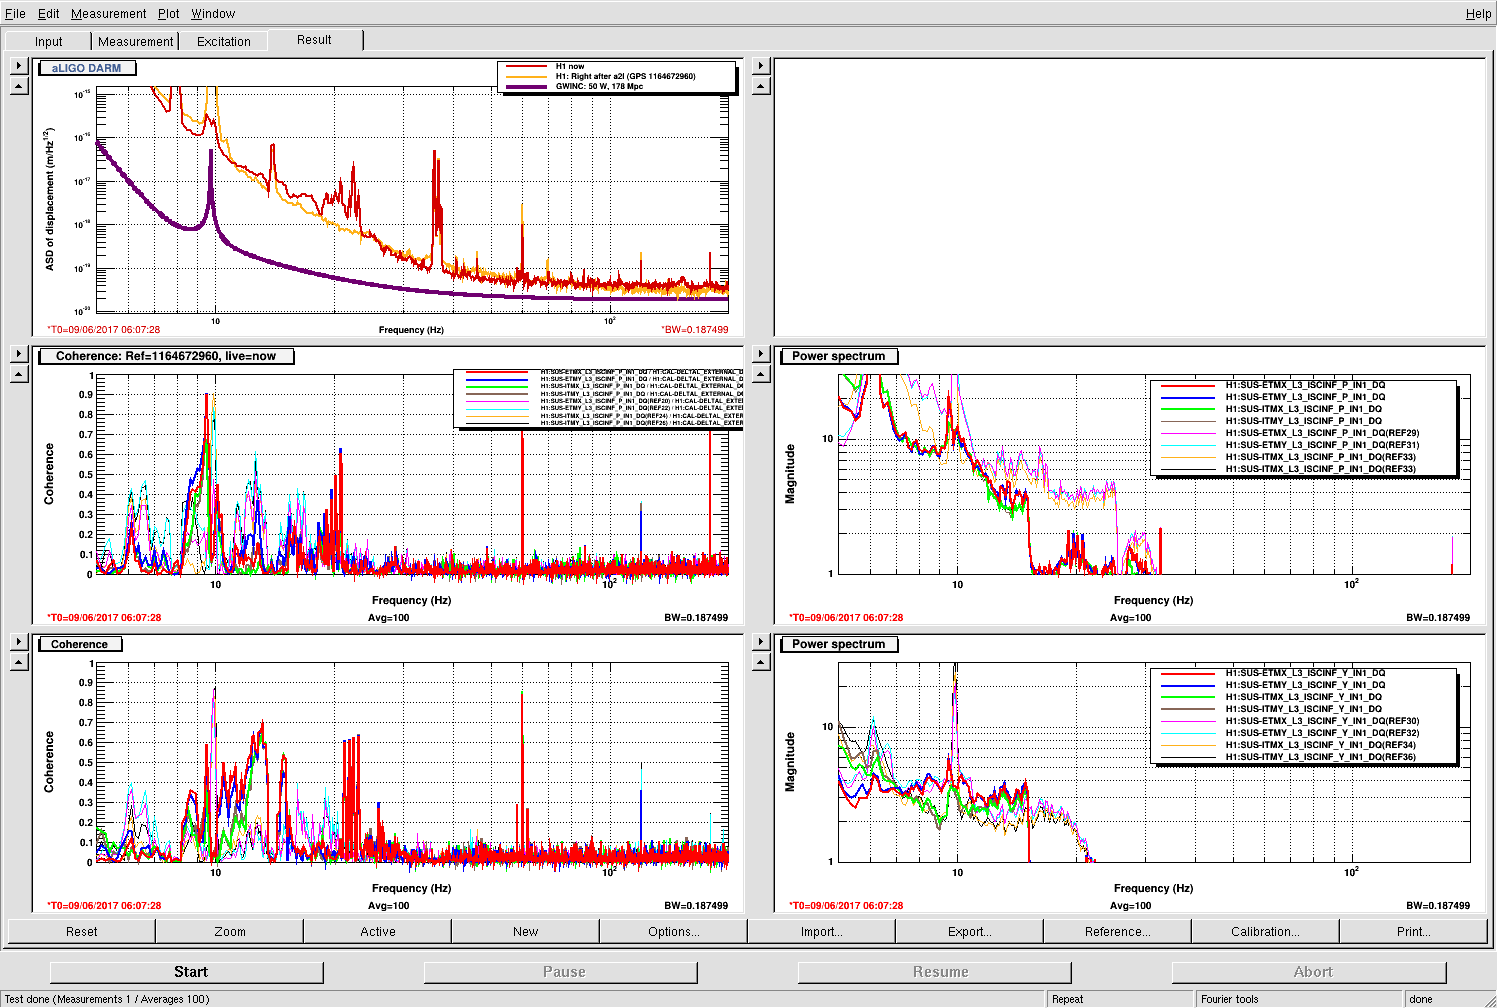
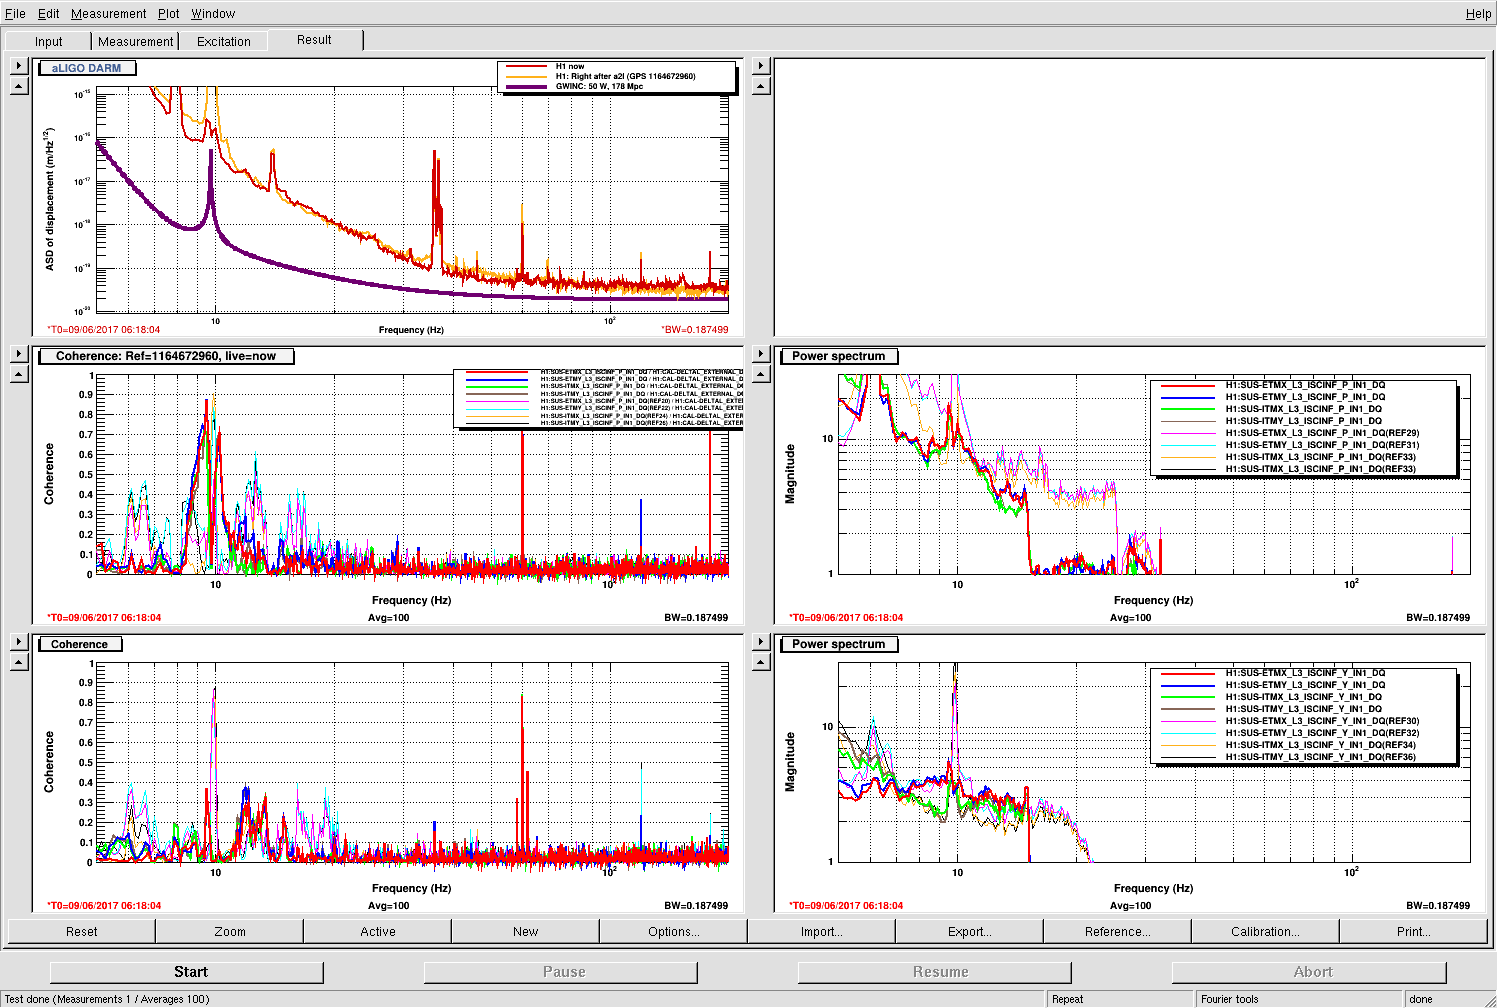
The 2nd loop out-of-loop floor level shows the stability of 1e-8 [1/rtHz] for both cases. However, the stability below 30Hz is worse than the one on May 1st. (Attachment 1. The blue curves are the current, and the red curves are the ones on May 1st.)
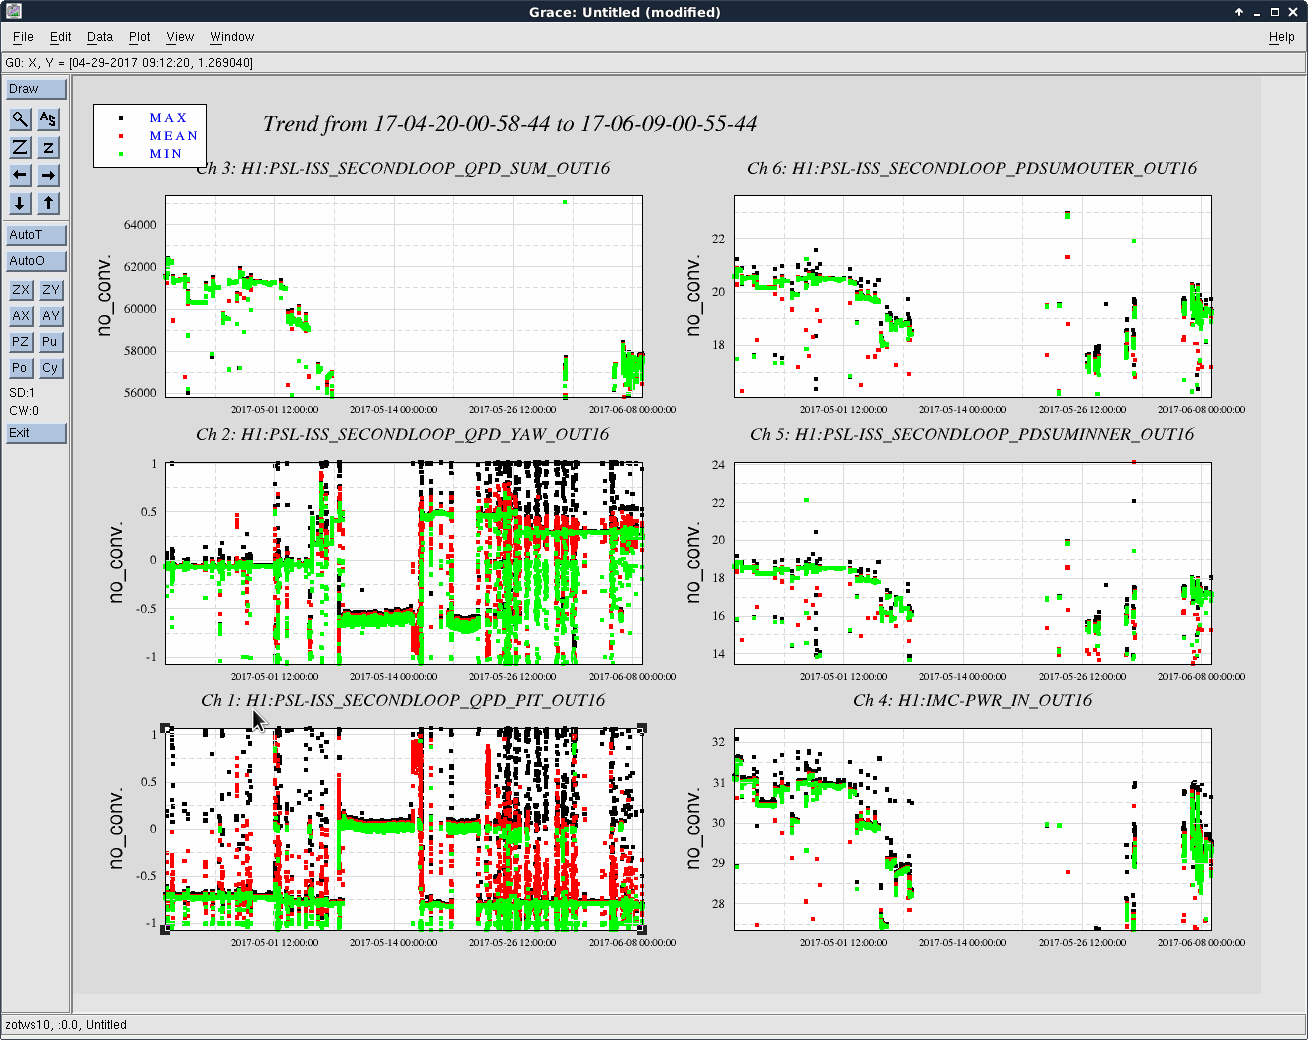
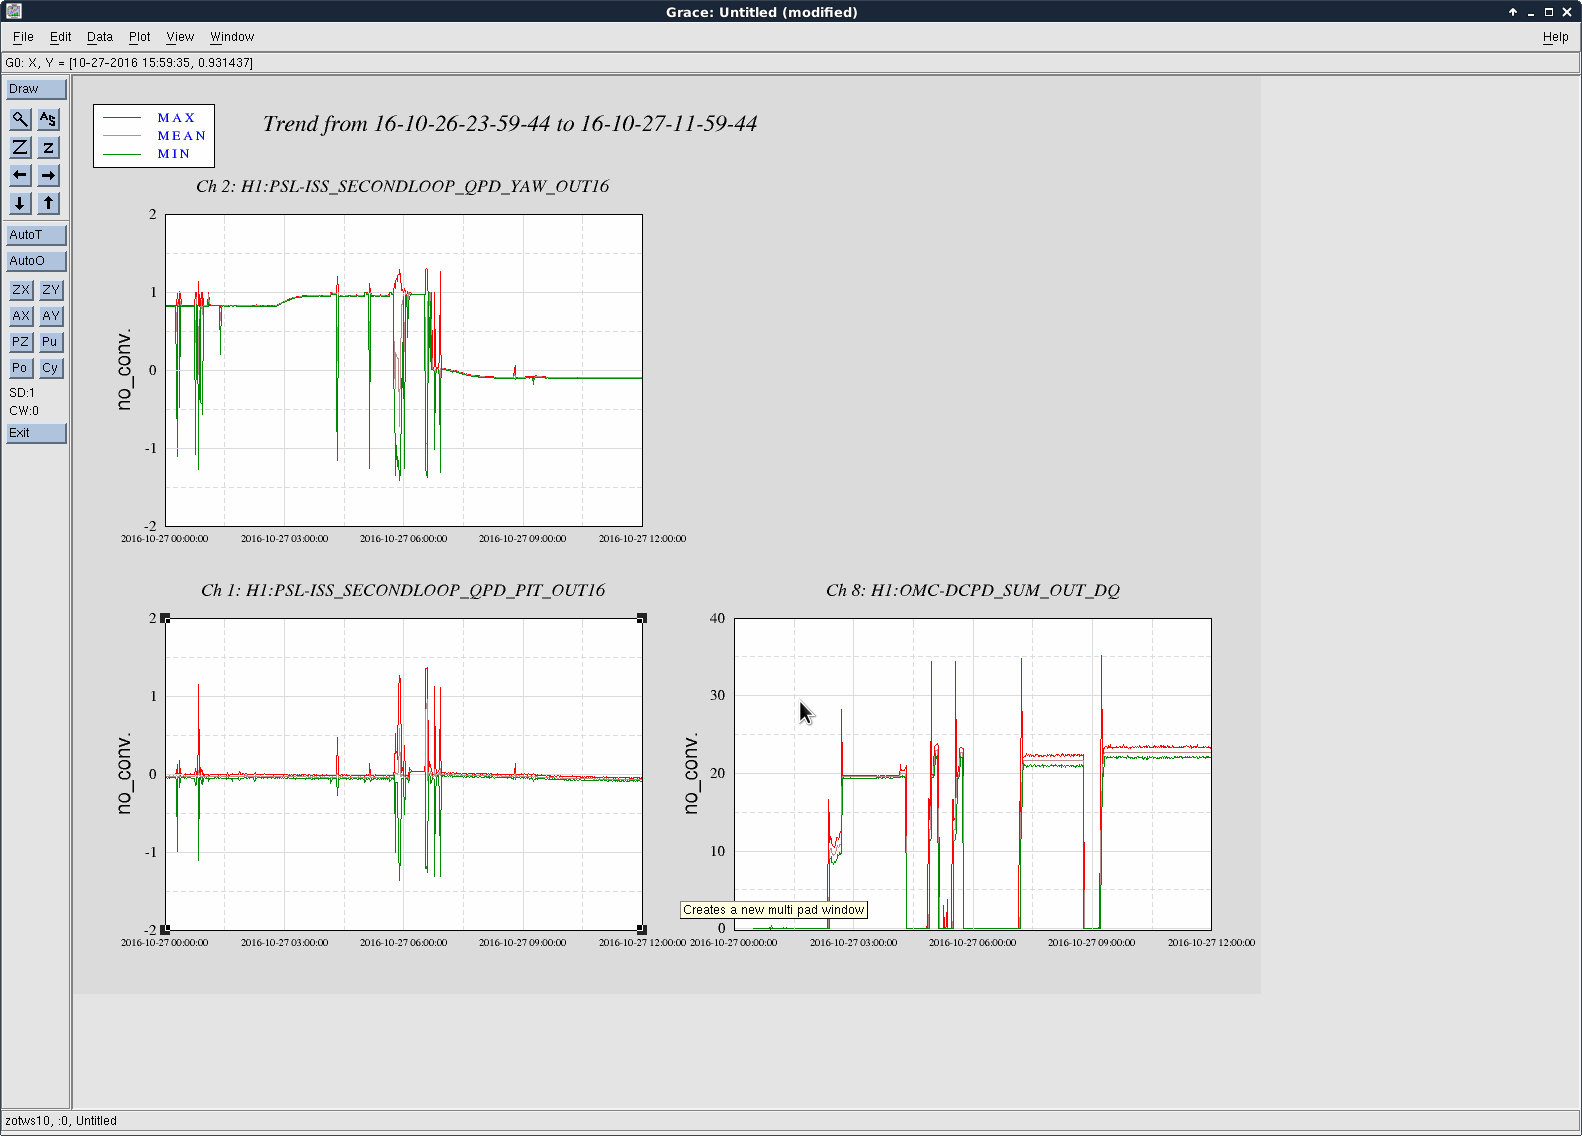
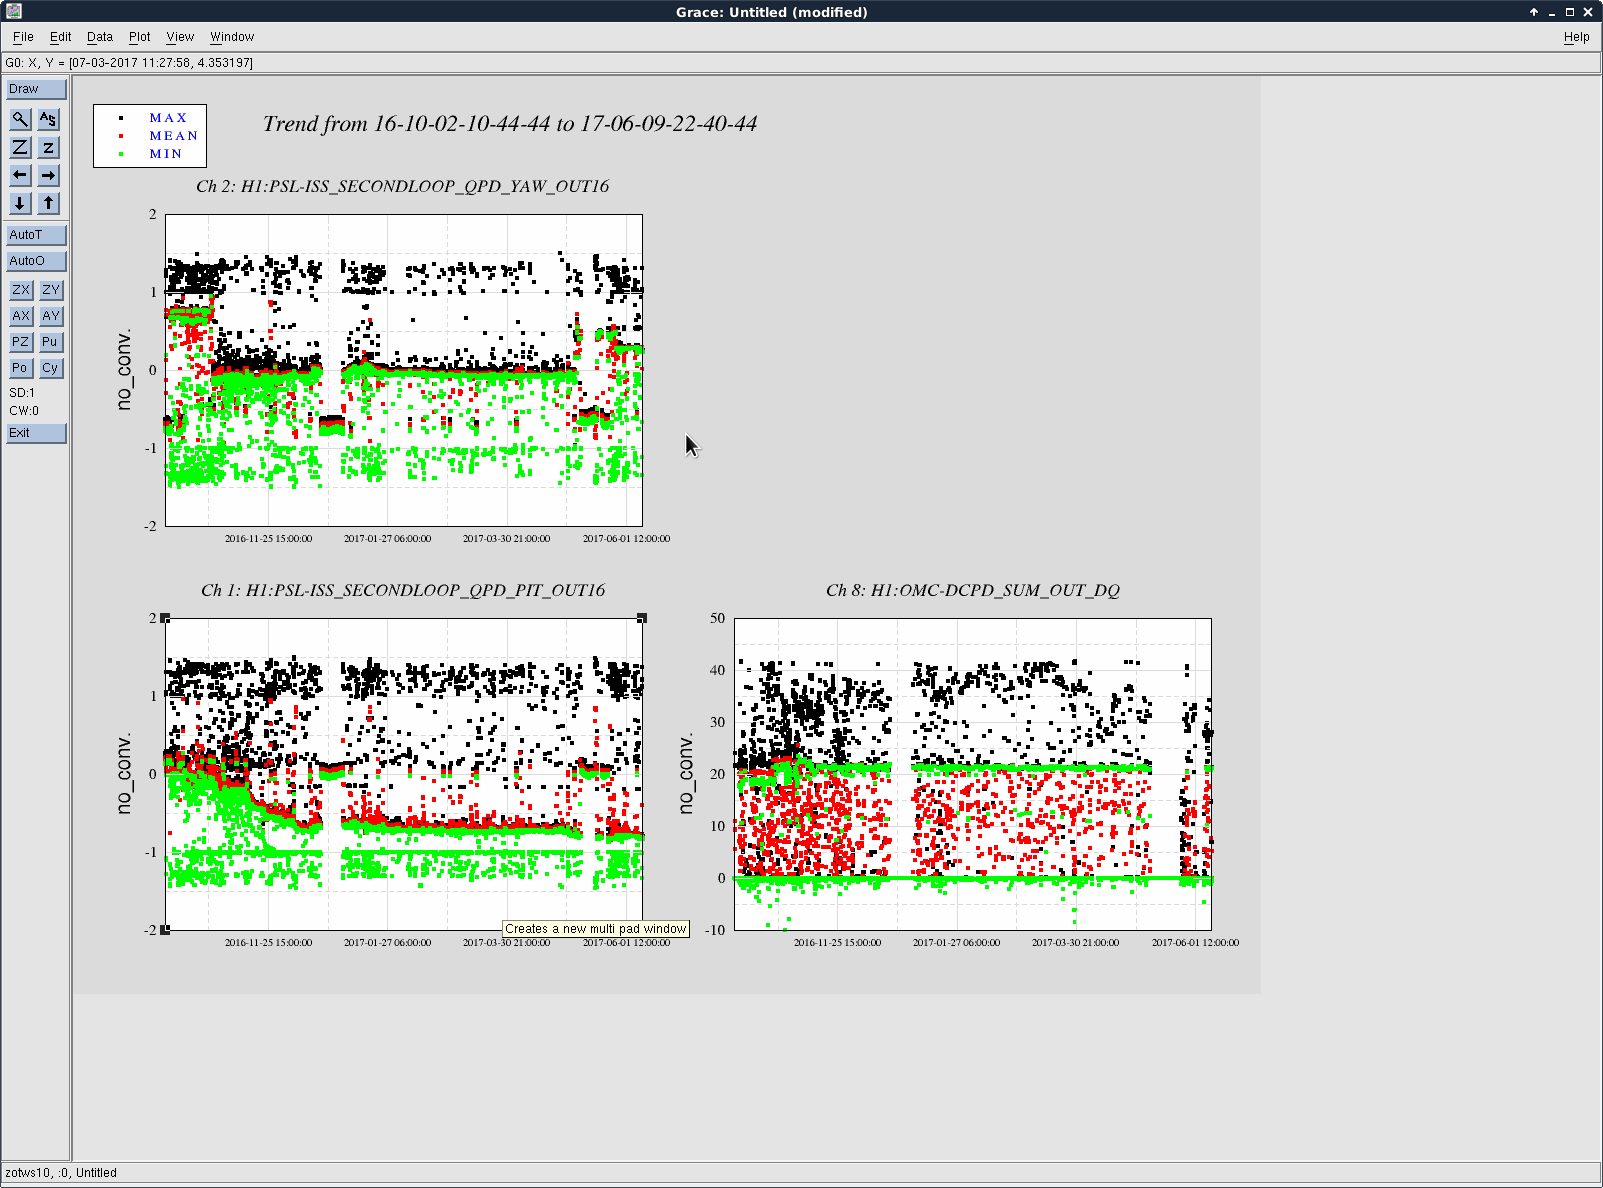
Attachment 2 shows the ISS QPD pointing. The yaw shows the shift from 0 to +0.3 while the pitch stayed ~-0.7. (Is that Okay?)
The 2nd loop PDs (inner/outer) exhibited 5~7% decrease, while the input power was also decreased 5%. So there looks some real decrease of the incident power on the PD exist. (Note tthat the QPD sum decreased -6.5%).
Can we change the features in the power spectrum by realigning the ISS PDs?

Corey was also struggling with initial alignment. It turns out this is the first time we've run an initial alignment since Wed evening, when I reset the green PZT pointing and green ITM camera setpoints.
These seemed to be working okay for the Xarm, but not at all for the Yarm - the AS camera looked terrible, and moving the optics such that the camera error signal was small brought the green transmitted power down. So, Vaishali and I undid those changes and put the initial alignment setpoints back to what they were before Wed. We're doing this for both arms, since it doesn't make sense to have different alignments for the different arms. Since we had to do it for the Yarm, we're also doing it for the Xarm.
Things are looking better now, so Corey is continuing with initial alignment.
EDIT: It occurs to me (just after it's too late for this lock, since we started increasing power) that I should have reset the green initial alignment setpoints at 2W, like DC readout. Instead, I had done it while at full power on Wed night after the IFO was warm and toasty. That's probably why the setpoints were not good for initial alignment this morning. Ooopsies, sorry. The current setpoints are close enough that the IFO is fine coming up without any help, so we'll leave it alone for now, and reset the initial alignment setpoints at 2W next time it's convenient.