patrick.thomas@LIGO.ORG - posted 04:03, Friday 09 June 2017 (36751)
Ops Owl Mid Shift Summary
Have remained in observing. No issues to report.
Have remained in observing. No issues to report.
TITLE: 06/09 Owl Shift: 07:00-15:00 UTC (00:00-08:00 PST), all times posted in UTC
STATE of H1: Observing at 65Mpc
OUTGOING OPERATOR: Ed
CURRENT ENVIRONMENT:
    Wind: 3mph Gusts, 1mph 5min avg
    Primary useism: 0.01 μm/s
    Secondary useism: 0.12 μm/s
QUICK SUMMARY:

No known issues.
TITLE: 06/09 Eve Shift: 23:00-07:00 UTC (16:00-00:00 PST), all times posted in UTC
STATE of H1: Observing at 65Mpc
INCOMING OPERATOR:Patrick
SHIFT SUMMARY:
Quiet shift. There were a couple of small quakes that were of no consequence to H1. A2L was run towards the end of the shift as Livingston dropped their lock. Handing of locked/Observing H1 to Patrick. There was 1 RO alarm.
LOG:
23:10 Chandra to MY
23:23 Kyle called to inform me that he had driven past the barricade to the bunker with the pickup truck for gas cylinders.
23:25 Little Quake from around the Mariana Islands ~.05um
23:53 Chandra back
00:17 Wind is picking up in excess of 30mph over the last hour.
Attached are the before and after screen caps.
H1 back to Undisturbed @ 6:17UTC
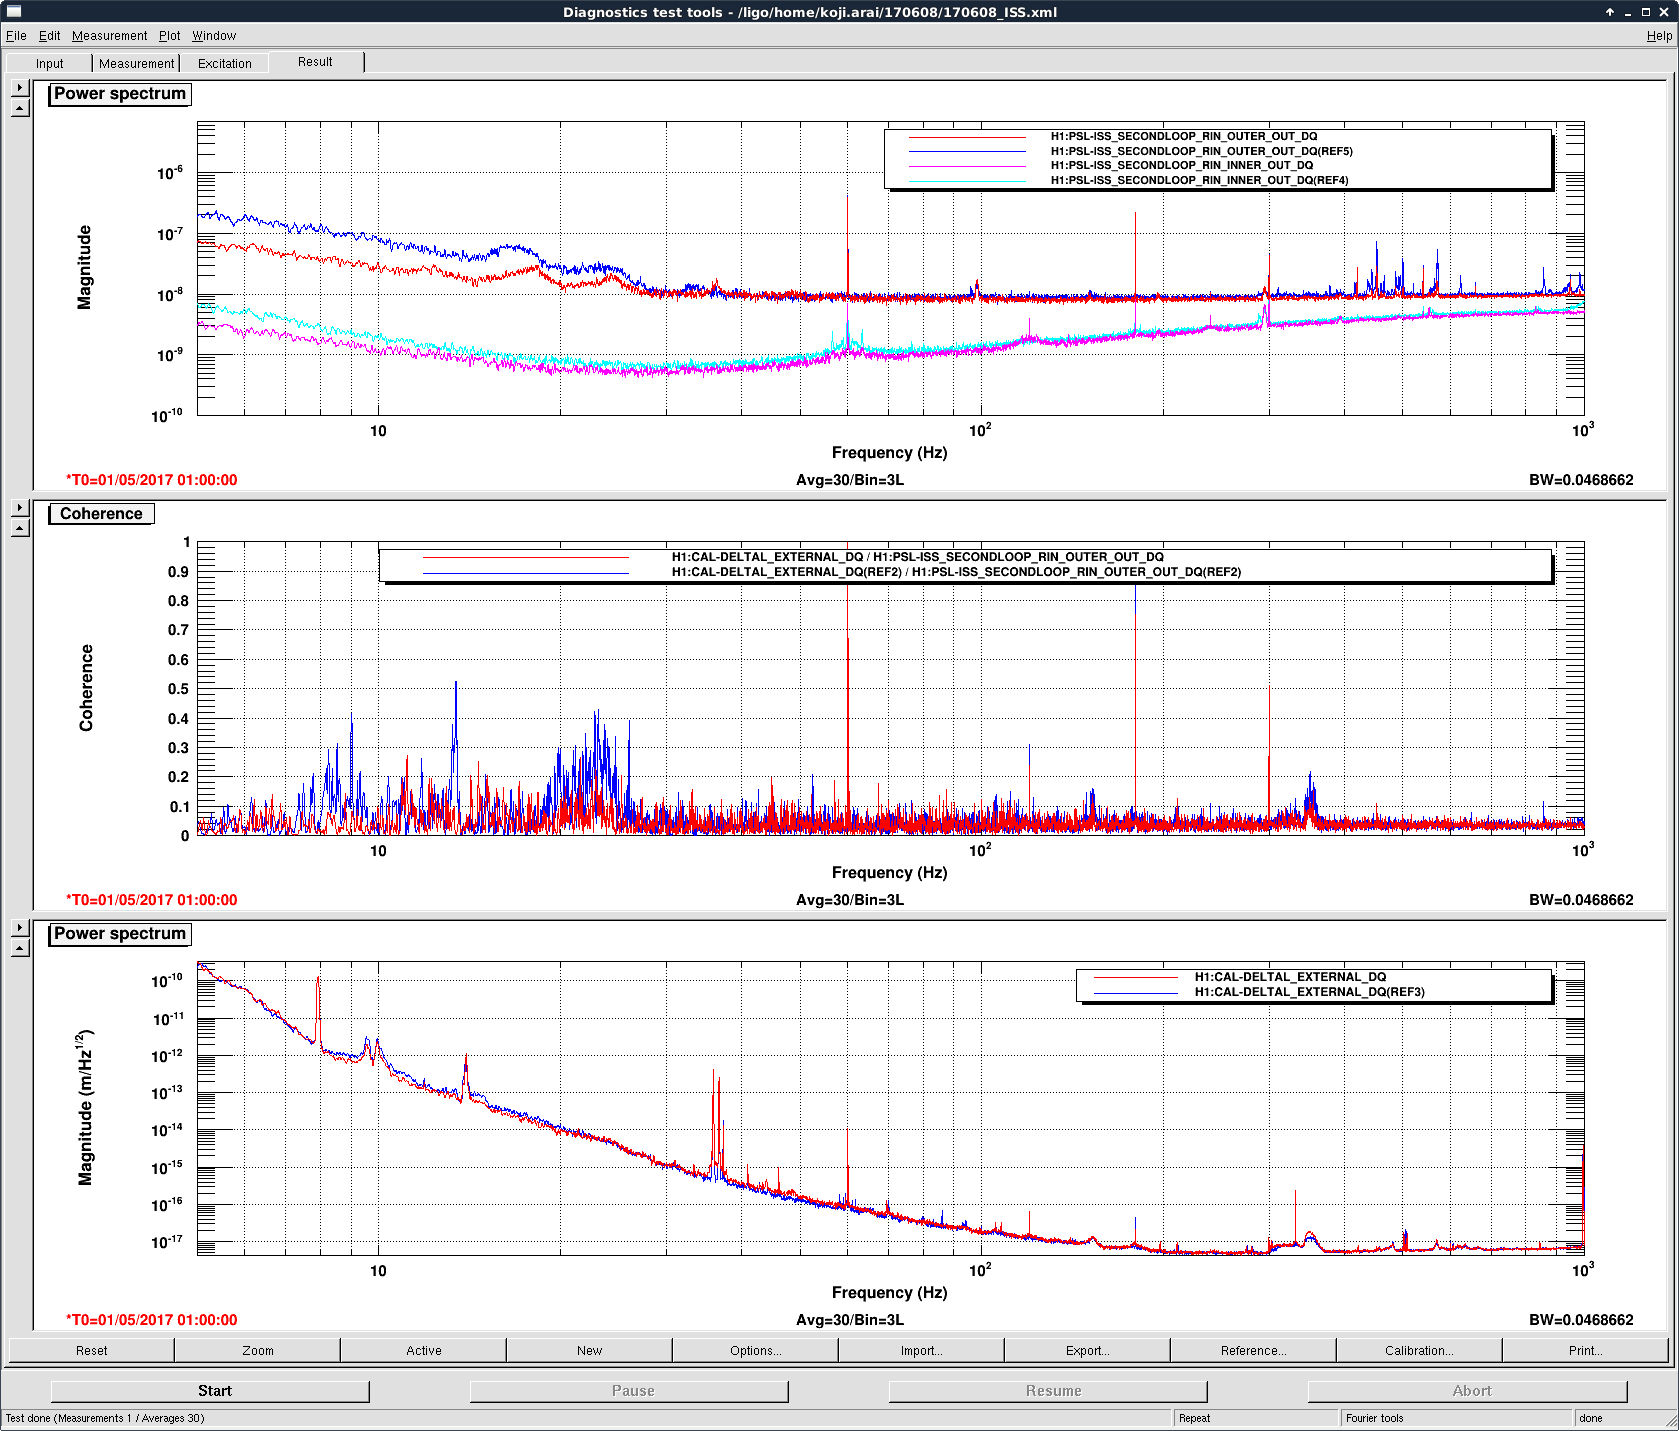
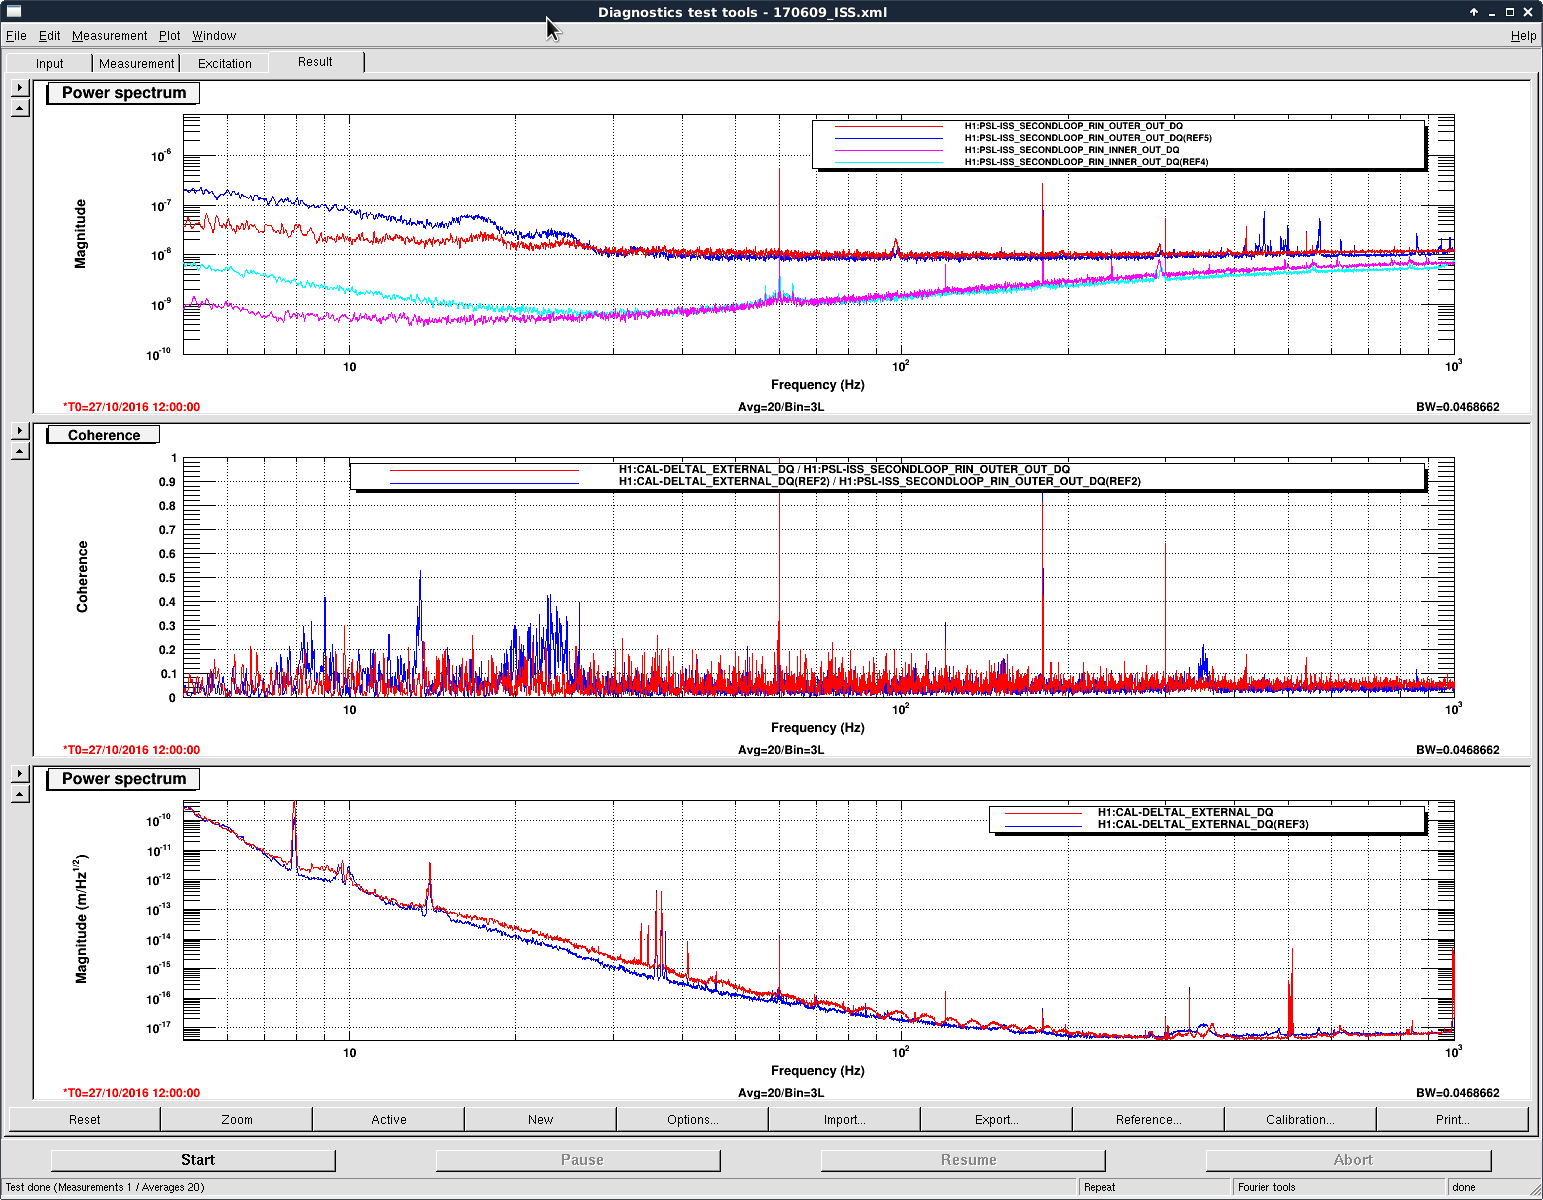
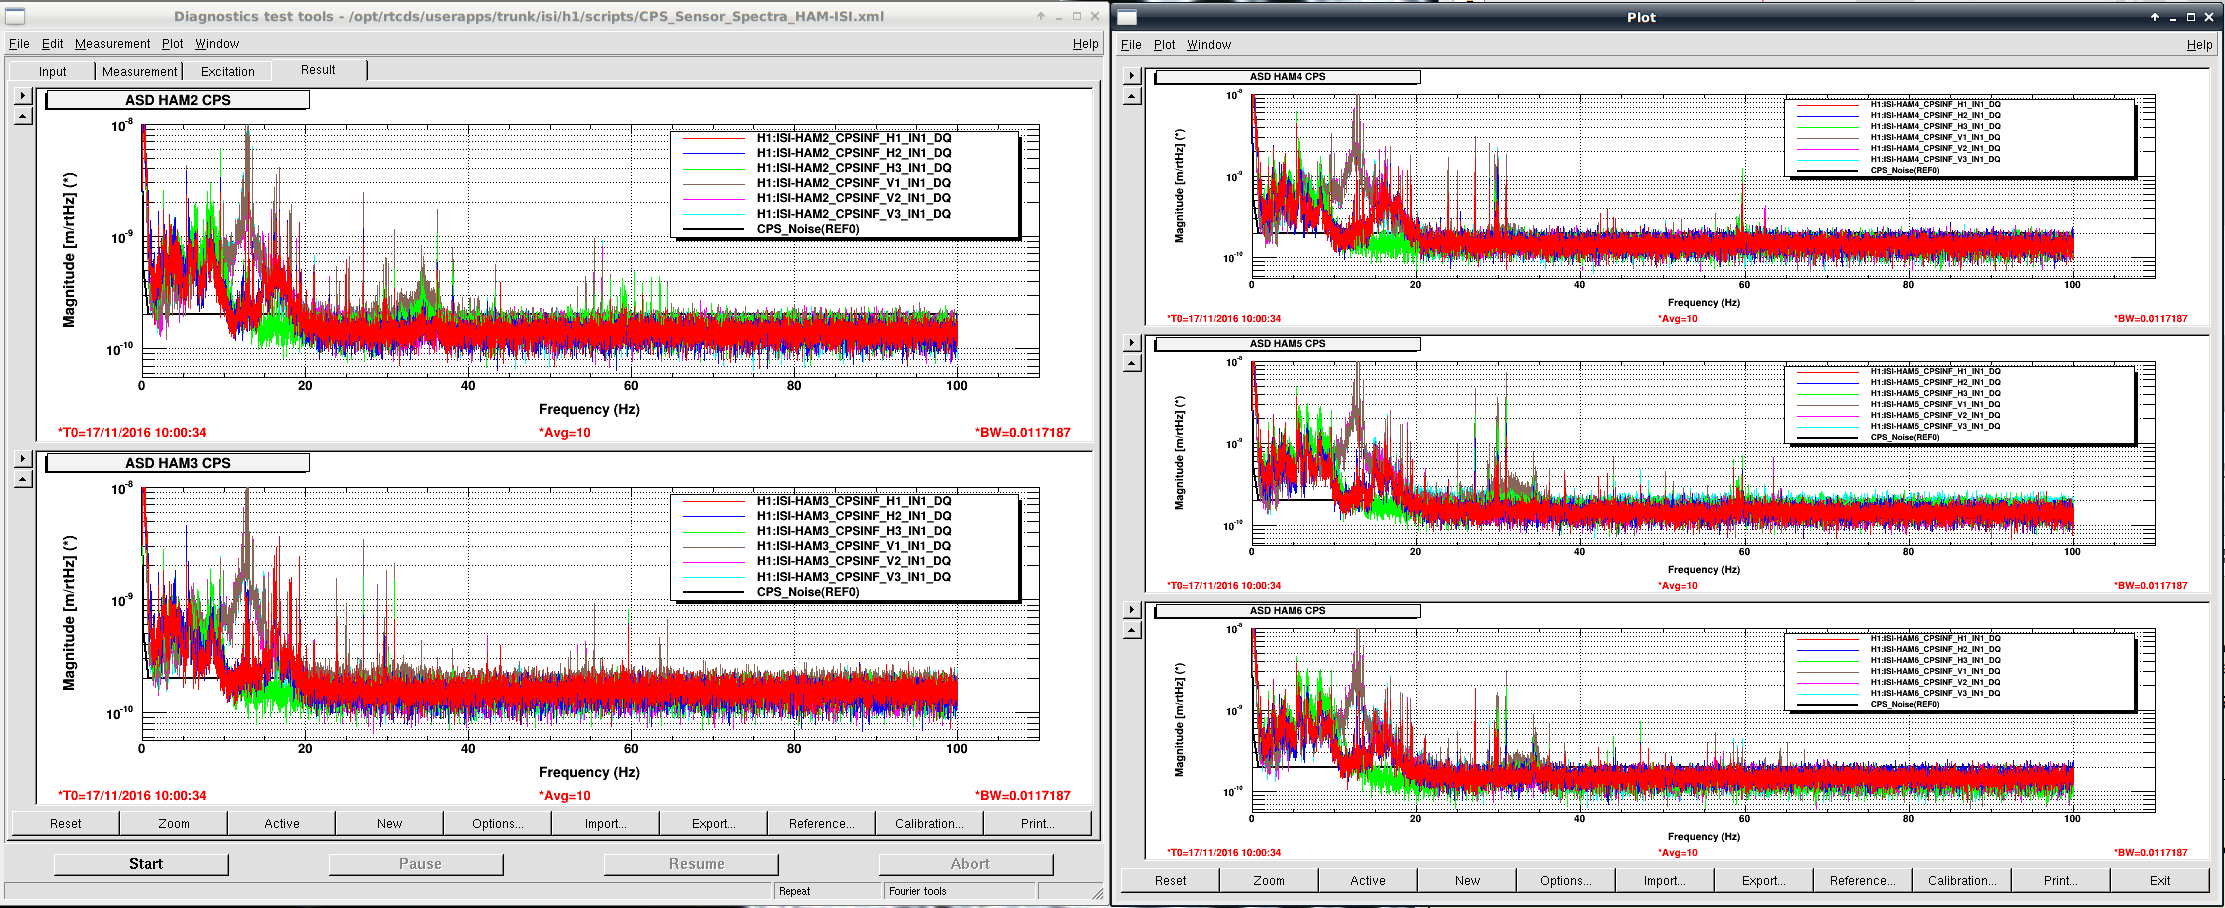
Jenne and I reviewed the ISS status this morning. Jenne noticed that the RIN of the 2nd loop out-of-loop PD array shows increased coherence between 7~30Hz. I continued to investigate the comparison of the ISS state between now (6/8 19:00 UTC) and May 1st (5/1 1:00 UTC).
The 2nd loop out-of-loop floor level shows the stability of 1e-8 [1/rtHz] for both cases. However, the stability below 30Hz is worse than the one on May 1st. (Attachment 1. The blue curves are the current, and the red curves are the ones on May 1st.)
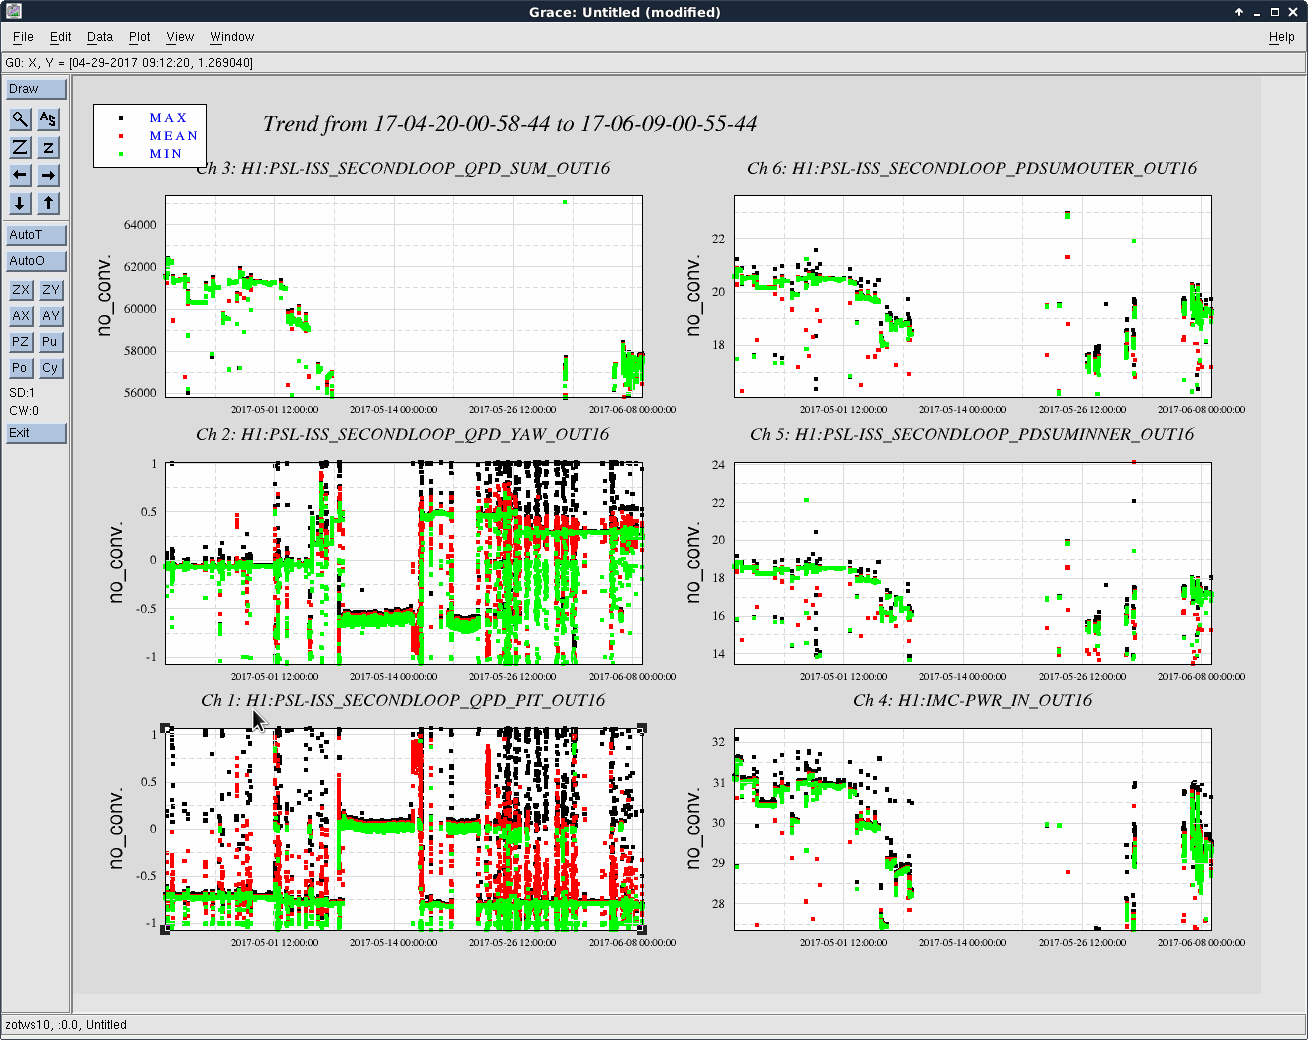
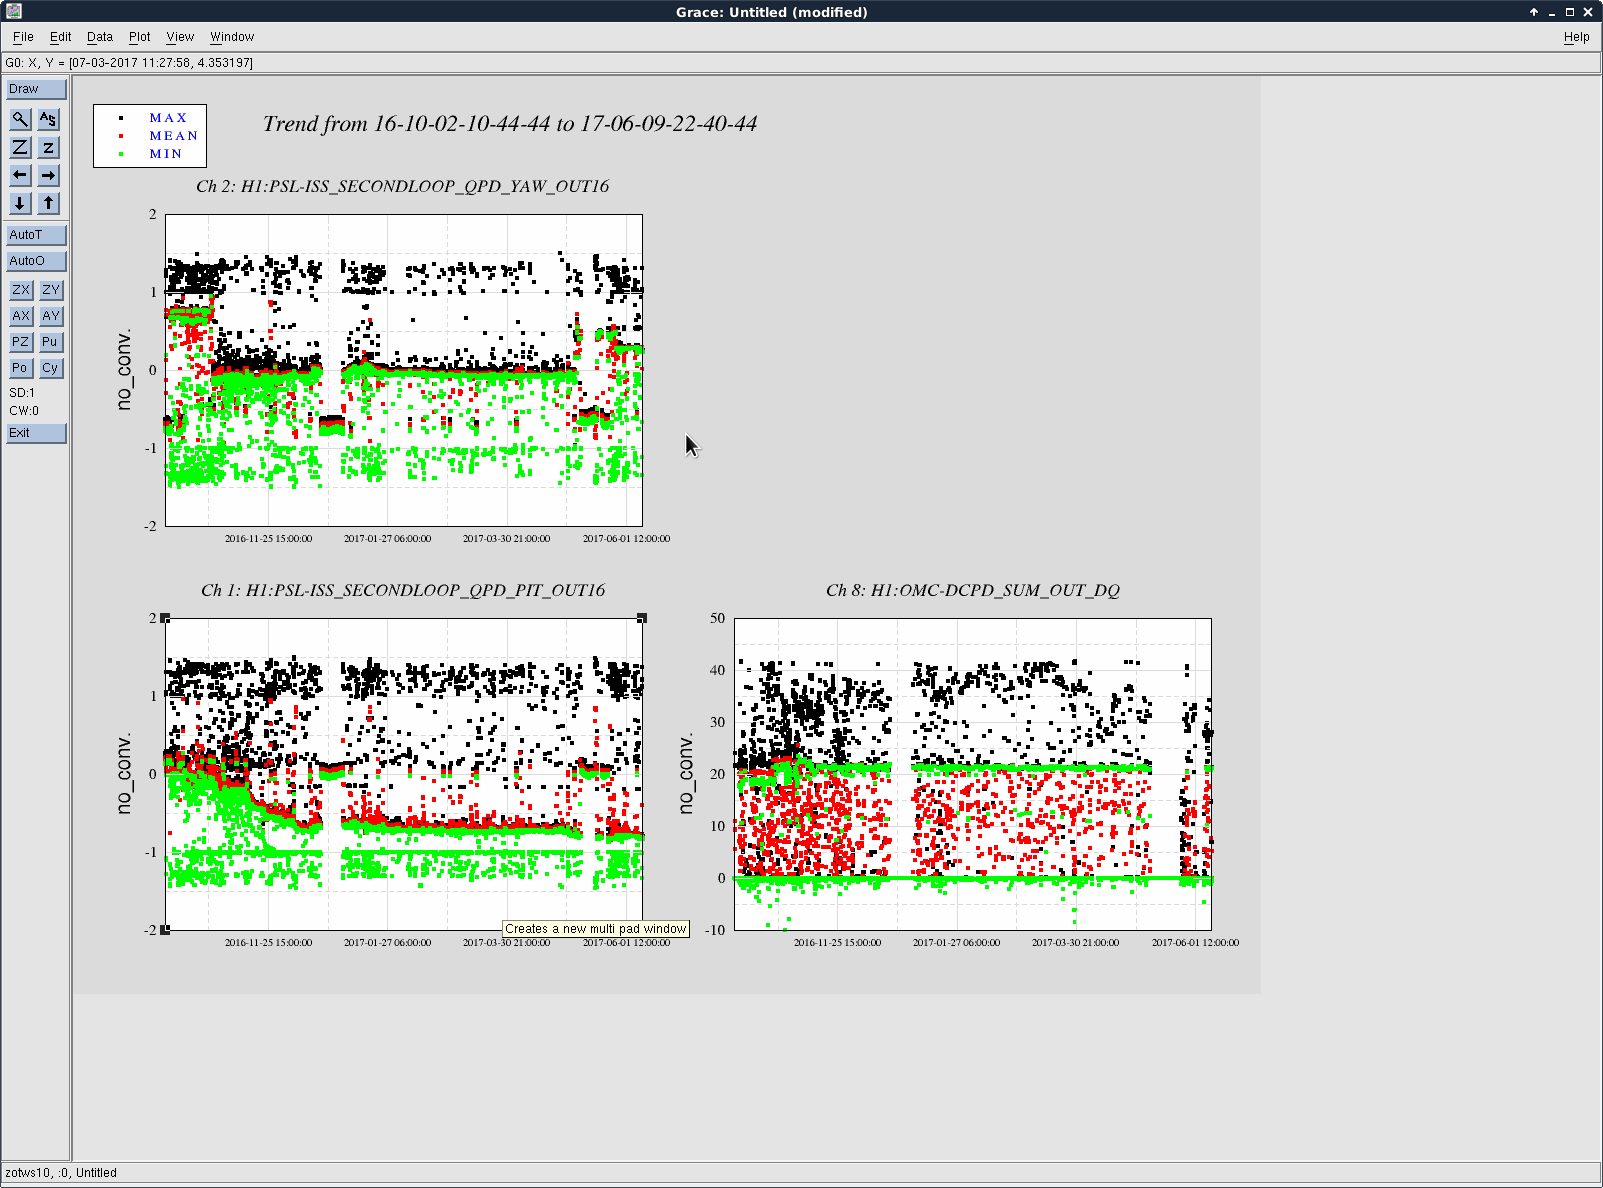
Attachment 2 shows the ISS QPD pointing. The yaw shows the shift from 0 to +0.3 while the pitch stayed ~-0.7. (Is that Okay?)
The 2nd loop PDs (inner/outer) exhibited 5~7% decrease, while the input power was also decreased 5%. So there looks some real decrease of the incident power on the PD exist. (Note tthat the QPD sum decreased -6.5%).
Can we change the features in the power spectrum by realigning the ISS PDs?
Rick sent me a couple of reference alogs regarding the ISS QPD centering:
https://alog.ligo-wa.caltech.edu/aLOG/index.php?callRep=30915
https://alog.ligo-wa.caltech.edu/aLOG/index.php?callRep=29583
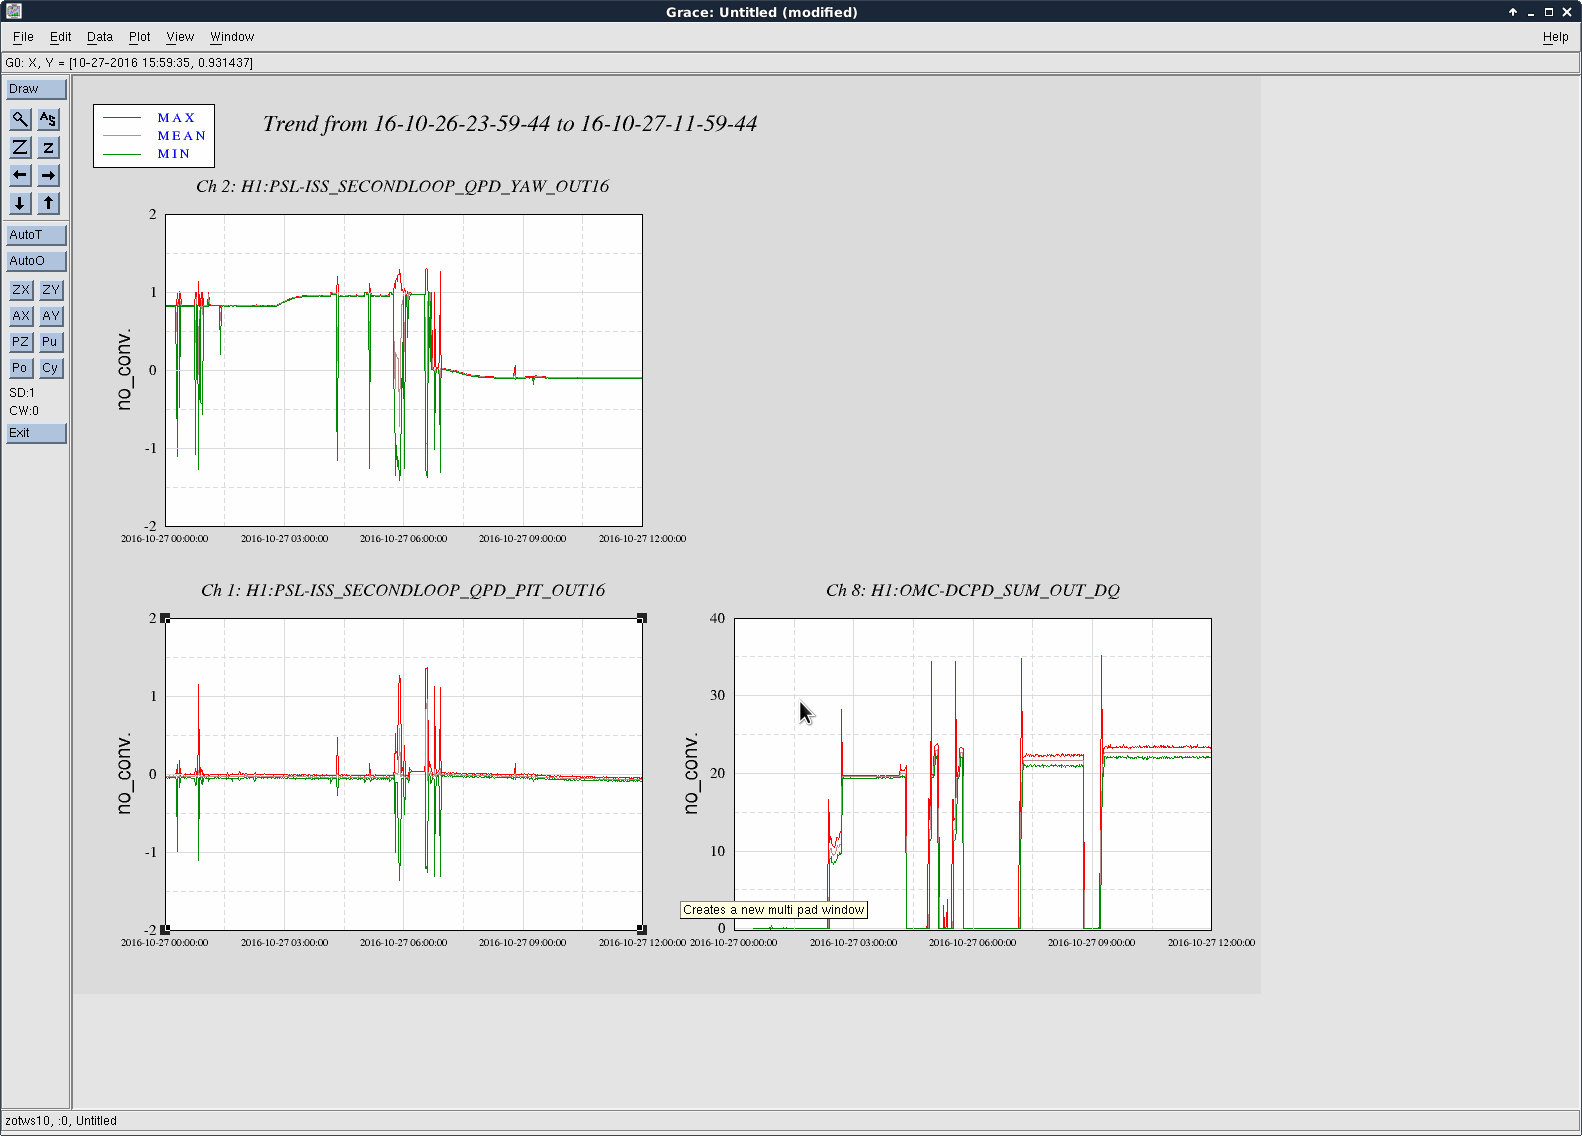
It seems that the last ISS QPD centering was done on Oct 27, 2016. (Attachment 1)
I've checked the ISS QPD pointing since this last centering (Attachment 2). The pointing gradually drifted out from the center in the pitch diection during the first two months. There was no yaw drift. After the vent, there was no big change in pitch, but was in yaw.
I took the in-loop/out-of-loop spectra of the invac ISS array outputs right after the last centering (Attachment 3). The spectra were basically the same as the ones seen before the vent, and thus were better than the current level.
Because there was no intentional offset on the QPD pointing, we should try to center the beam on the ISS QPD (in the next possible occasion) to see if this helps to reduce the residual intensity noise at the low freq band.
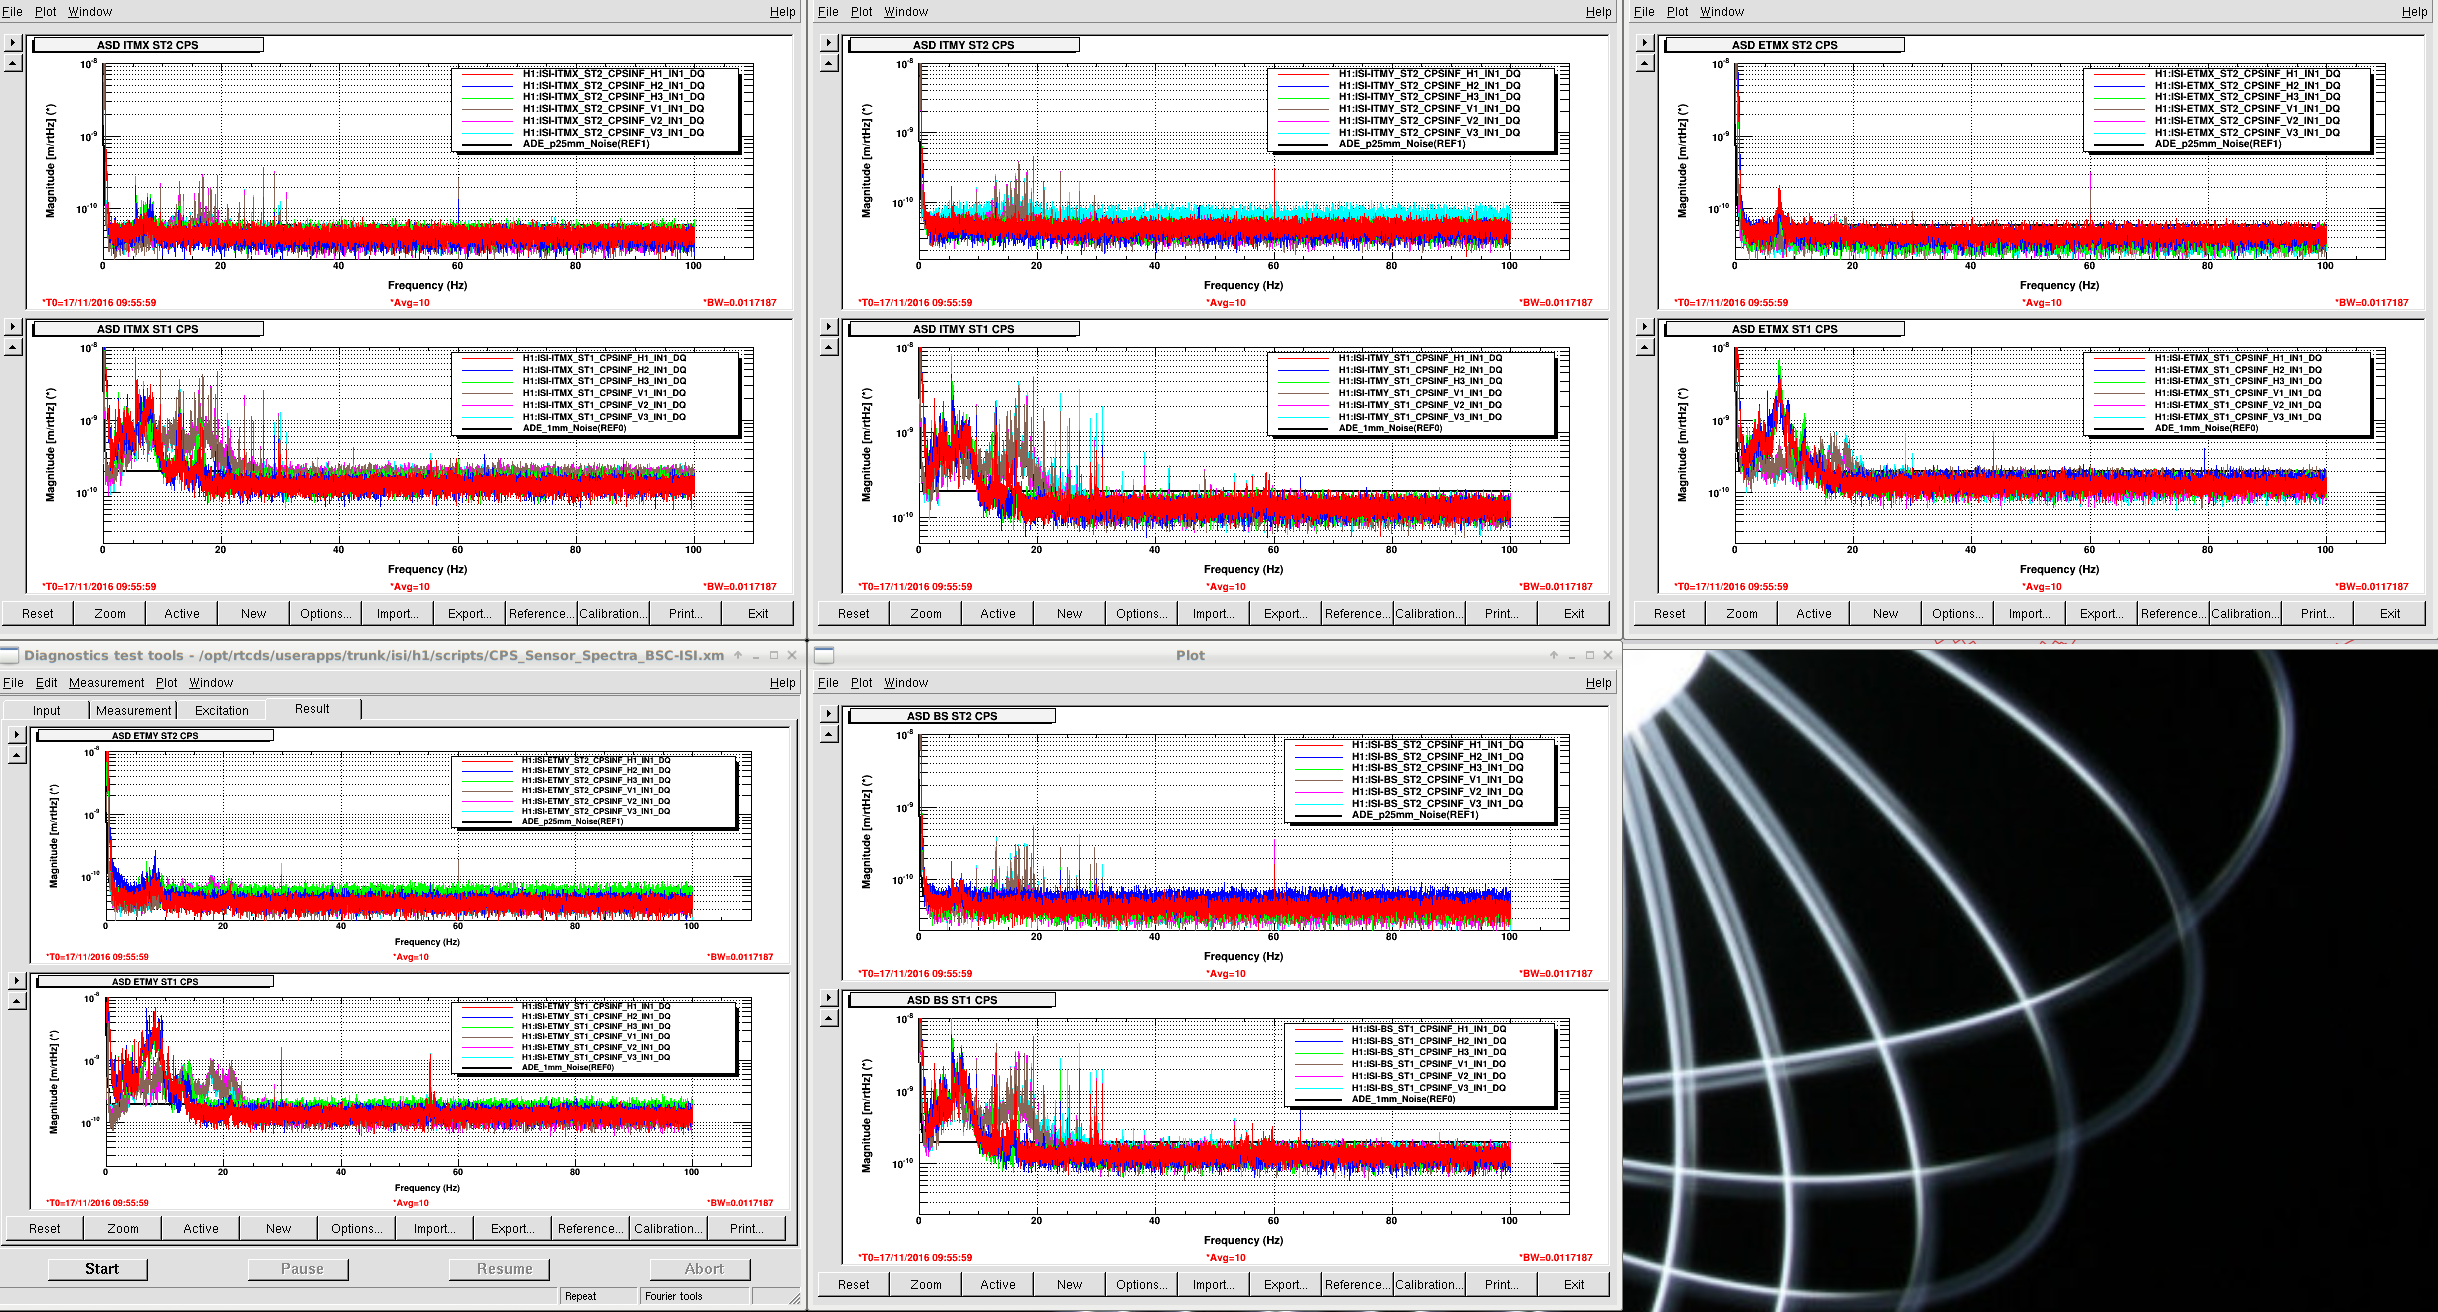
Based on what I know about this spectra, I don't see any outliers worth mentioning. Everything looks nominally ok.
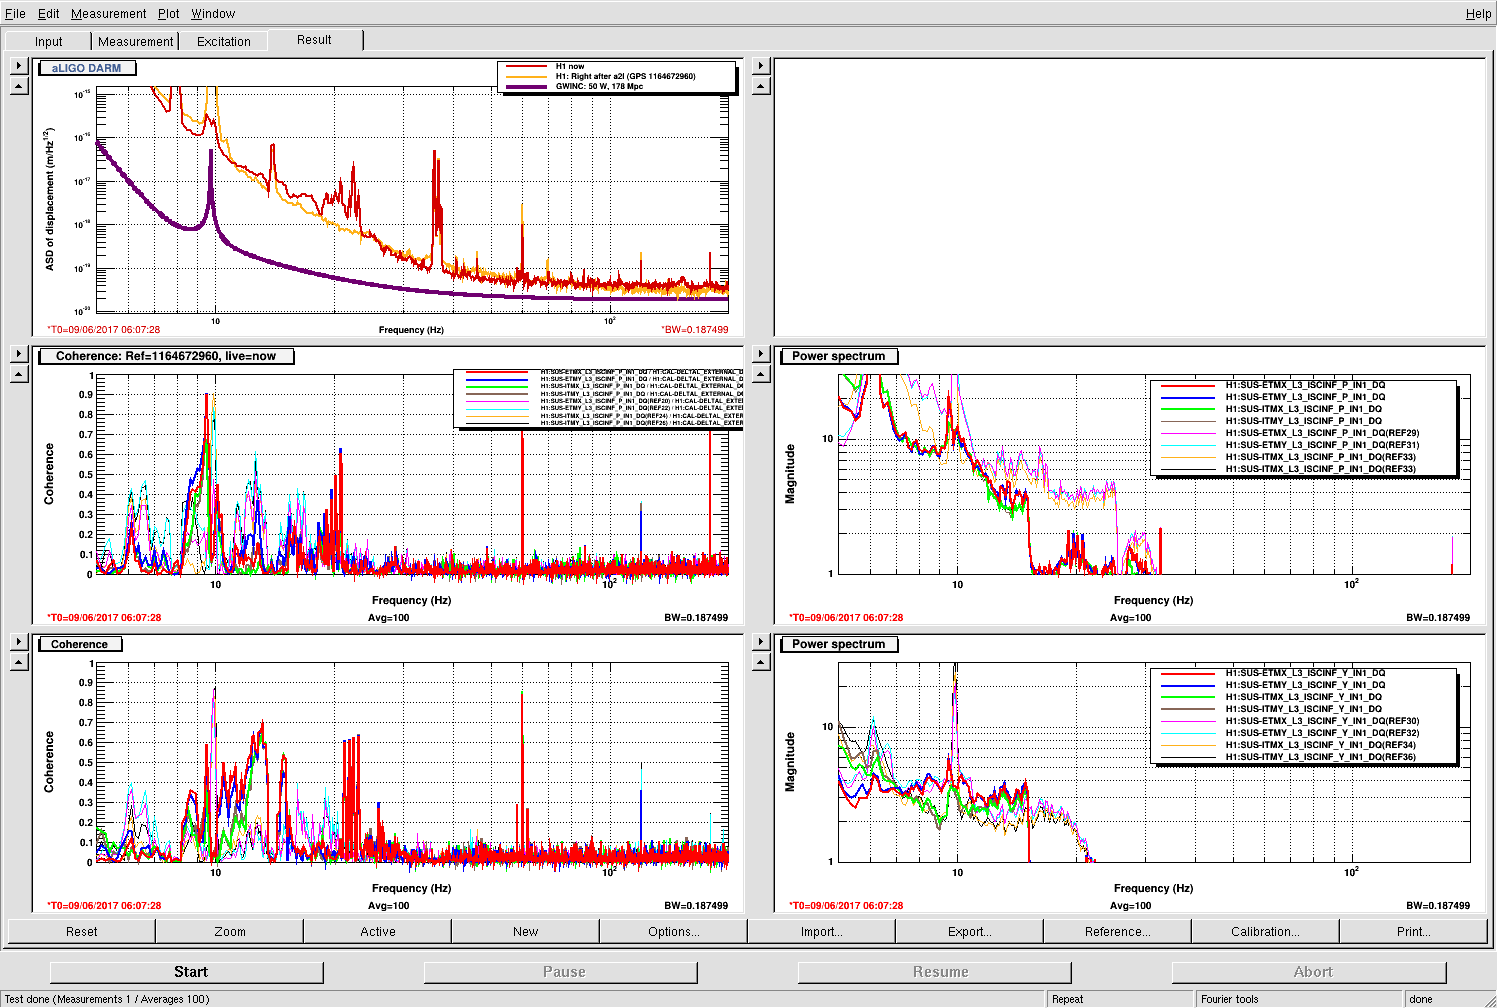
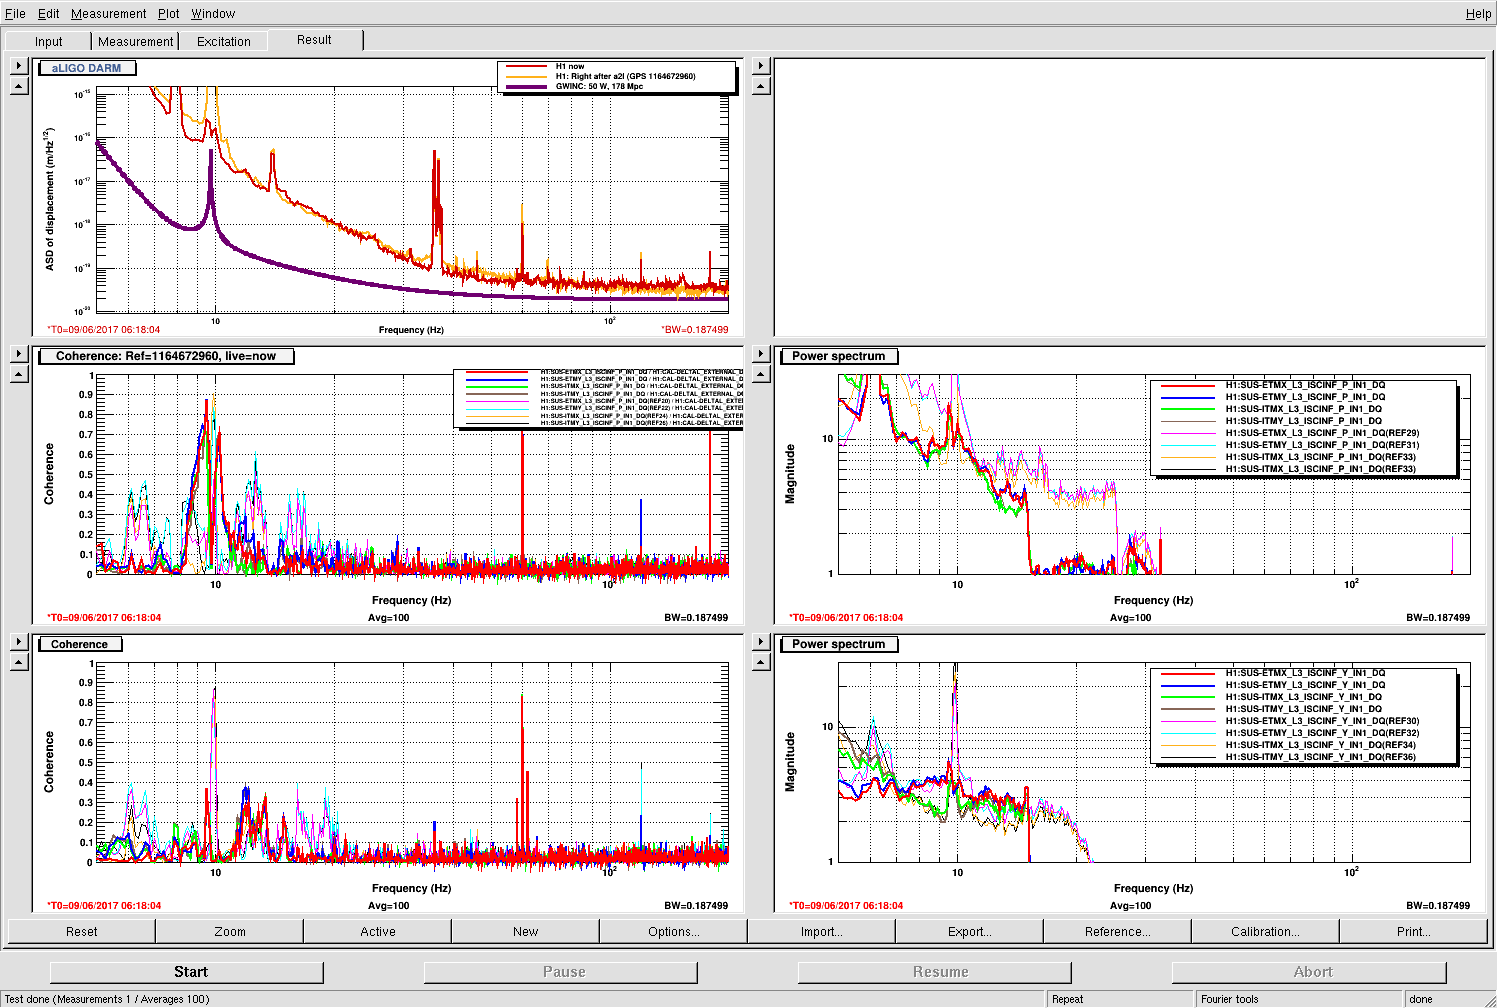
The first figure shows the jitter peaks in DARM from last night and their coherence with PSL table accelerometers, along with the same plot from May 1. Little has changed.
The second figure is a reminder that the jitter is mainly driven by the chilled water flow to the HPO. The vibration from this flow didn’t change much between May 1 and June 8. However, it is greater than it was during O1. We might get significant improvement in DARM by turning down the flow to the specified minimum flow.
Because of the similarity in the jitter noise, Im guessing that only minimal PEM injections will be needed to characterize coupling in last night’s state before we continue commissioning and try to reduce jitter coupling.
TITLE: 06/08 Day Shift: 15:00-23:00 UTC (08:00-16:00 PST), all times posted in UTC
STATE of H1: Planned Engineering
INCOMING OPERATOR: Ed
SHIFT SUMMARY:
Main push in the morning was to get our Nominal Low Noise H1 back into OBSERVING. H1 is now back in O2. Had one lockloss toward the end of the shift which was recovered fairly quickly. Had a bit of wind earlier in the day (& we rode through that).
LOG:
TITLE: 06/08 Eve Shift: 23:00-07:00 UTC (16:00-00:00 PST), all times posted in UTC
STATE of H1: Observing! at 66Mpc
OUTGOING OPERATOR: Corey
CURRENT ENVIRONMENT:
Wind: 21mph Gusts, 15mph 5min avg
Primary useism: 0.07 μm/s
Secondary useism: 0.13 μm/s
QUICK SUMMARY:
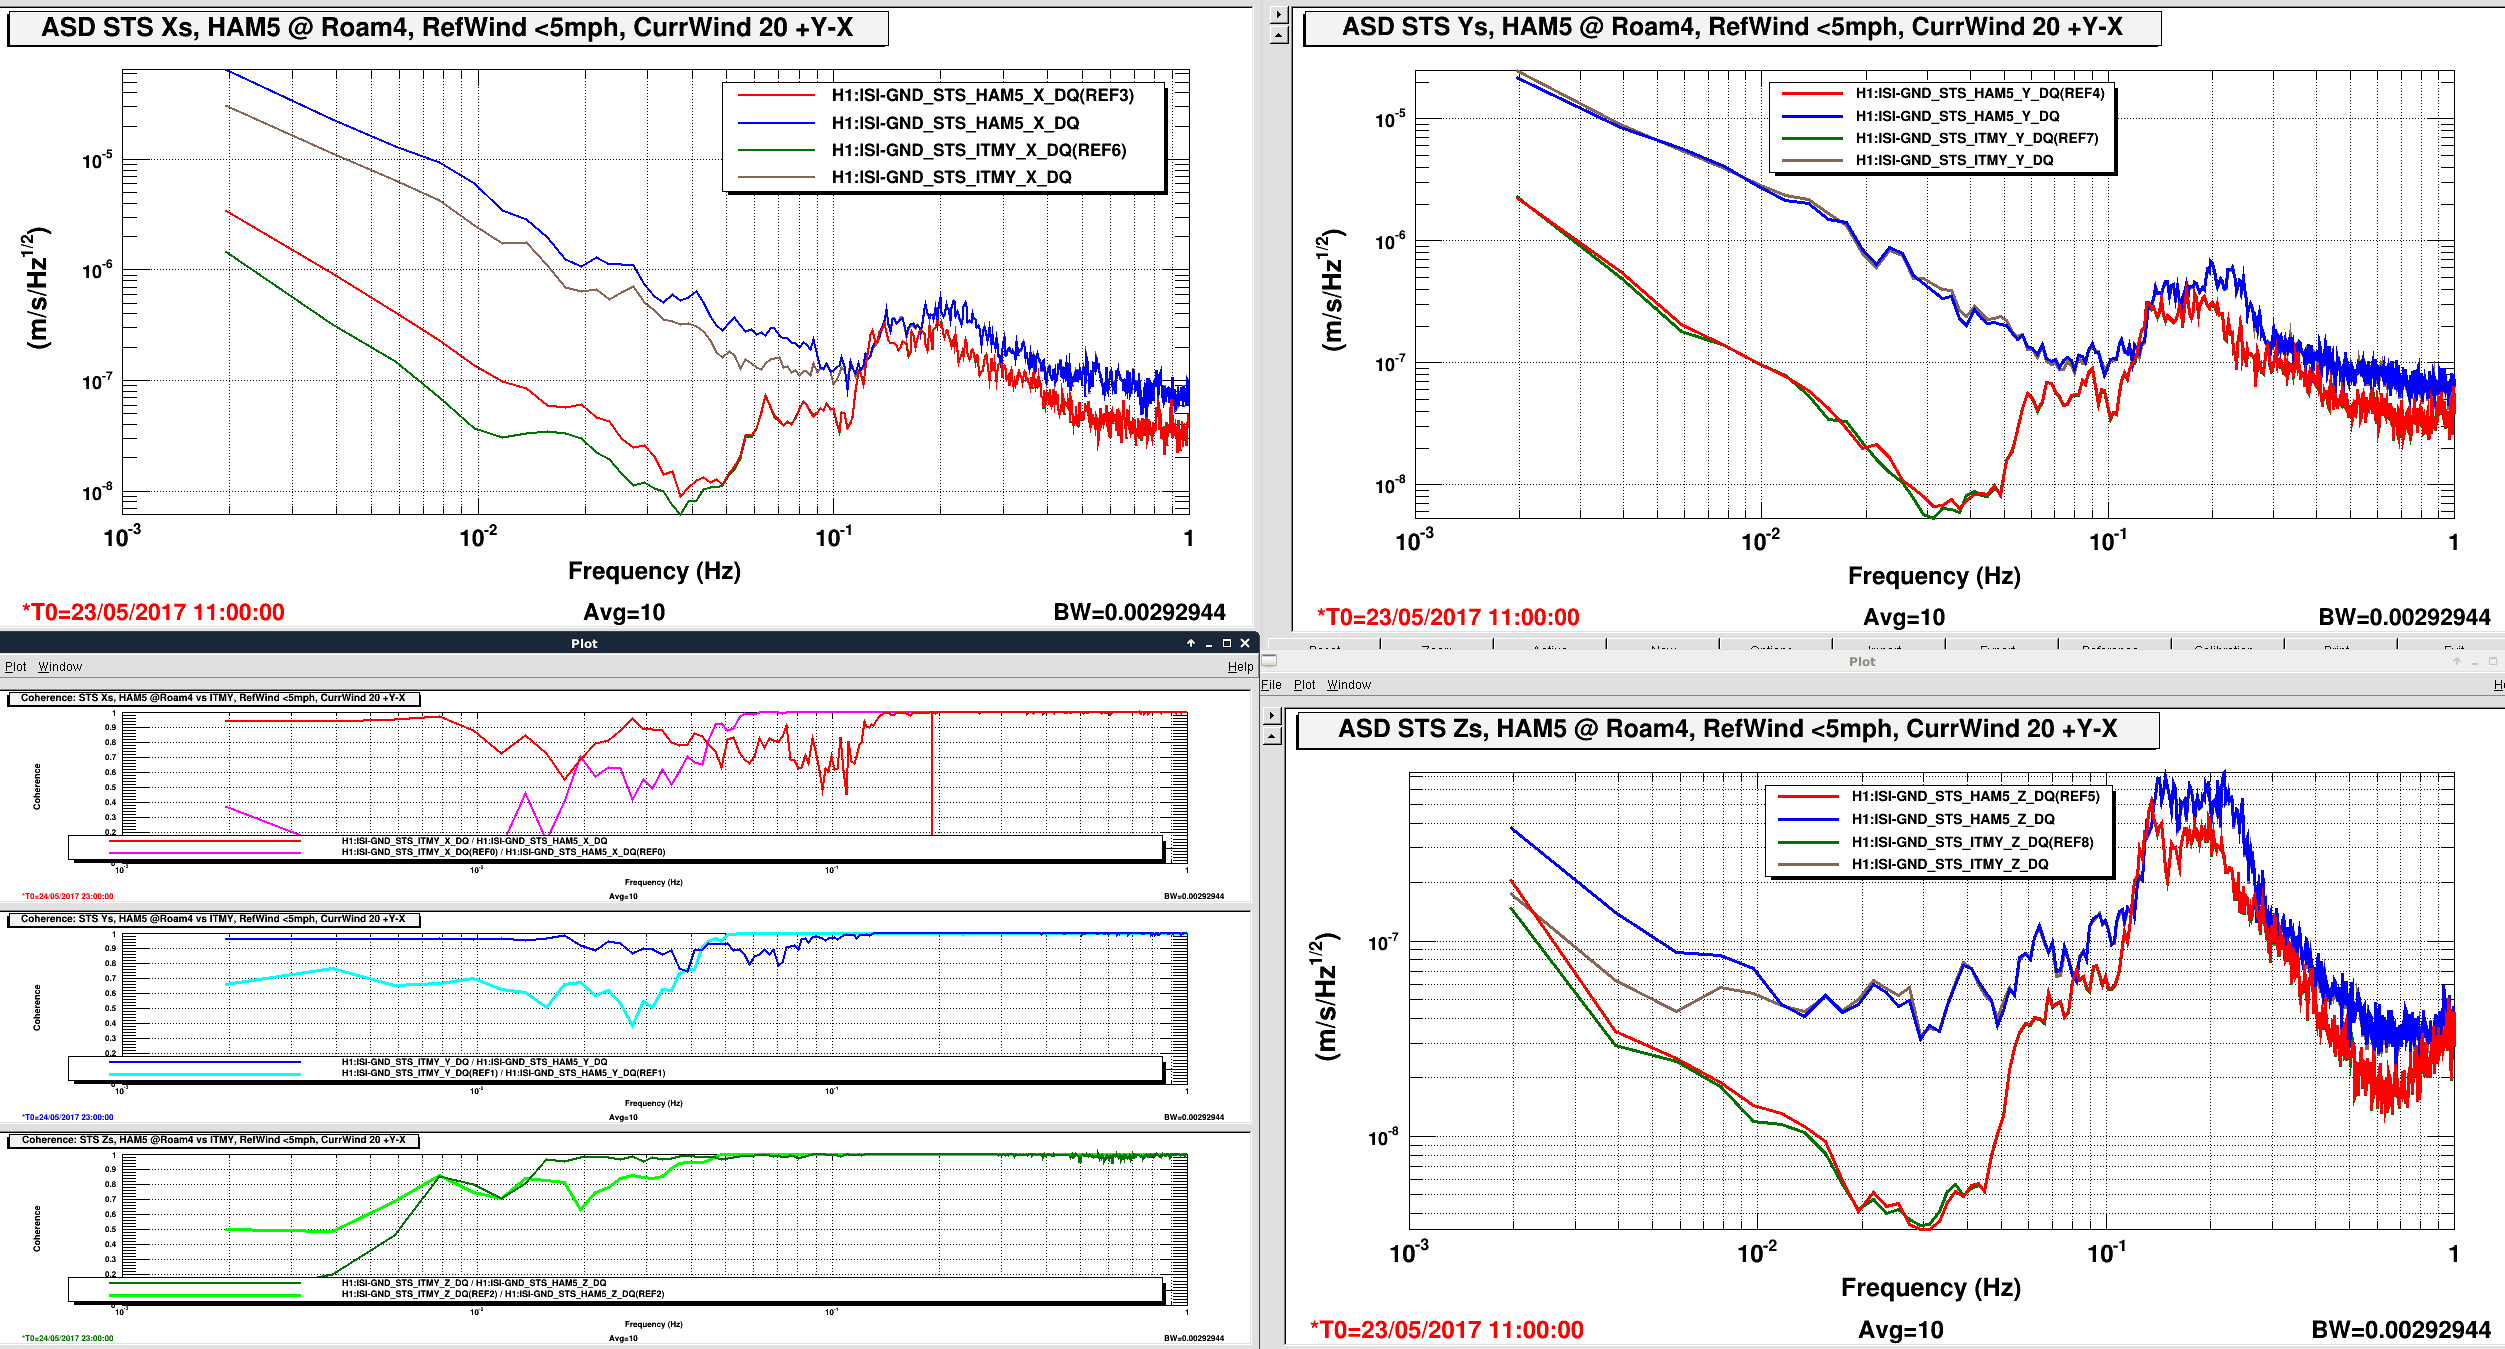
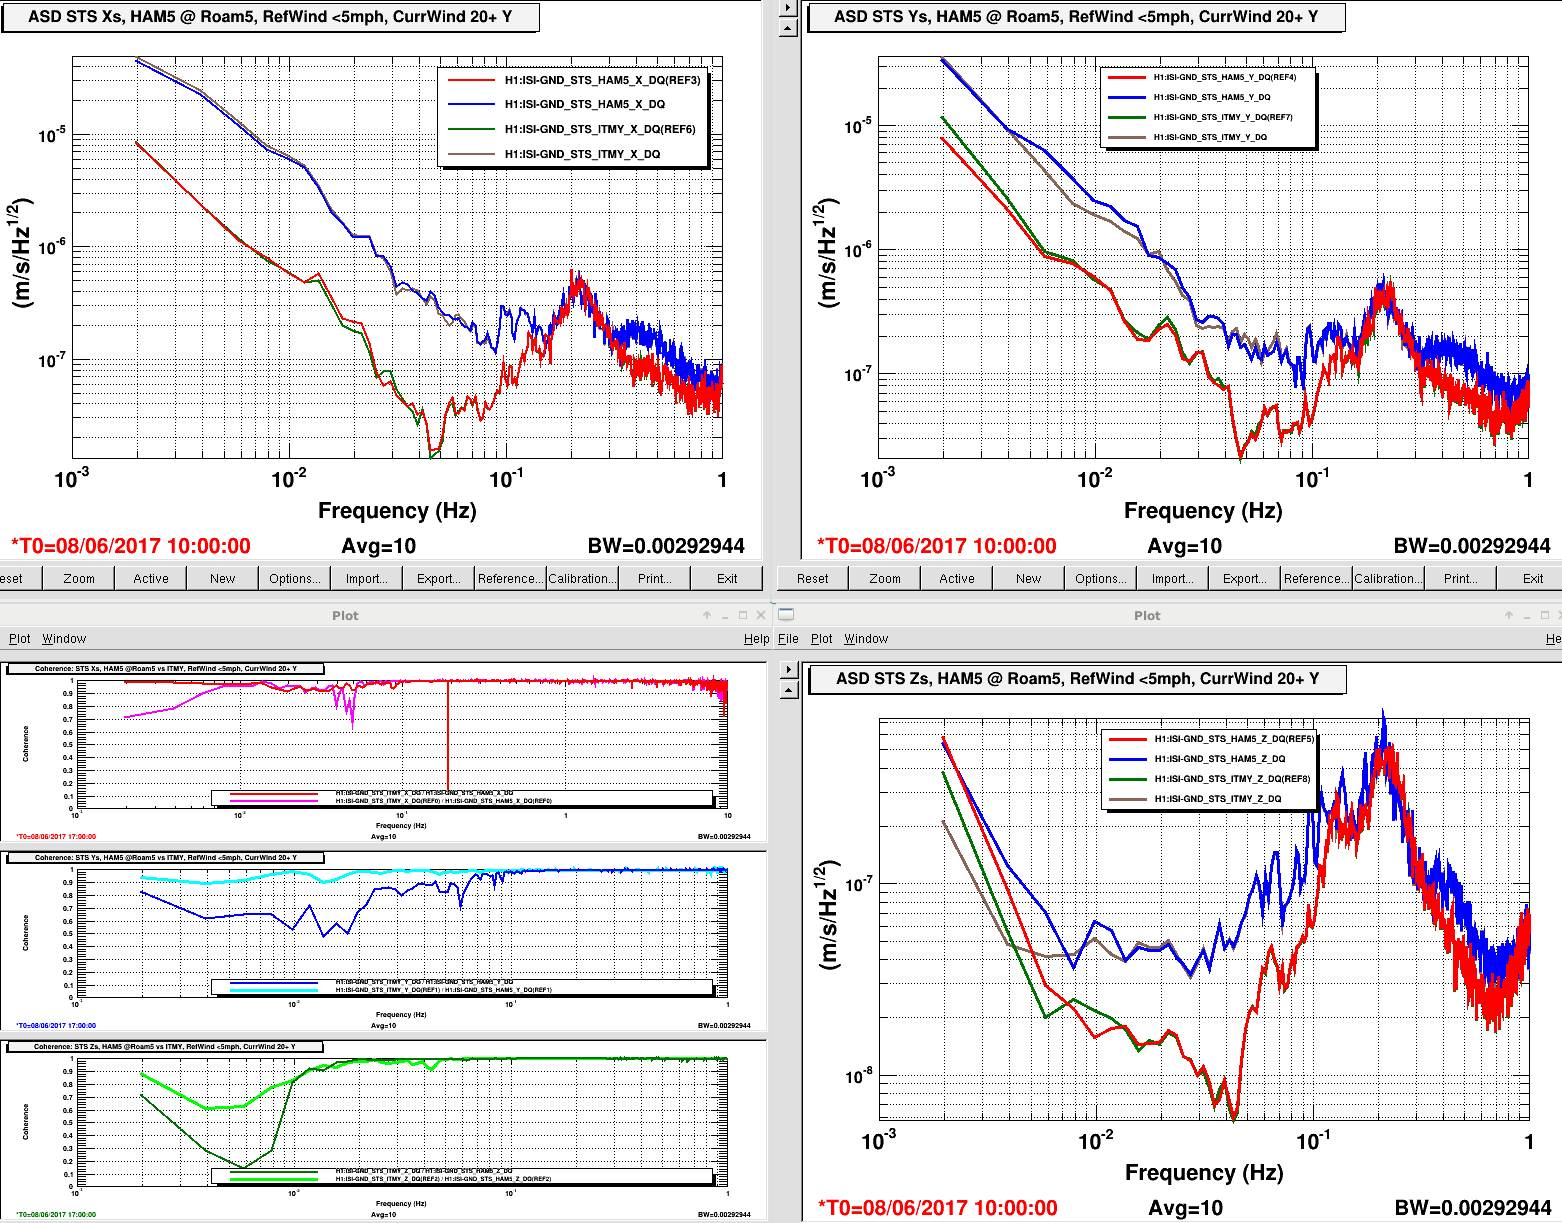
Decent blast of wind today gave opportunity to assess the Roam5 position--I only moved there on Tuesday.
First plot shows the speed & direction for the CS and w/ Robert have learned the wind sensor has shifted out of position. Don't know when but need to add about 90 degrees to reading. Will fix Tuesday--FRS 8292.
The second plot shows the usual ASD and coherences between the ITMY and HAM5 (roamer) STS2s. Roam5 position is getting pretty close to ITMY so no surprise that it is looking very similar. While close, as previous positions have shown, no need to relocate the ITMY yet. The quiet time in this measurement is 1000 utc 8 June; the windy period analyzed begins at 1700 utc 8 June.
Here is my roaming locations map. The green bordered red disks with numbers are the locations.
Earlier this morning after the VEAs were swept, we had to go through a couple of other items before we could get back to OBSERVING:
1) DIAG_EXC
We had a stuck ASC Excitation channel (H1:ASC-INP1_P_EXC). Dave confirmed this excitation was run briefly (seconds/minutes?) on Maintenance Day and has remained OFF ever since. So Dave cleared this excitation test point and h1asc is no longer red on the CDS Overview.
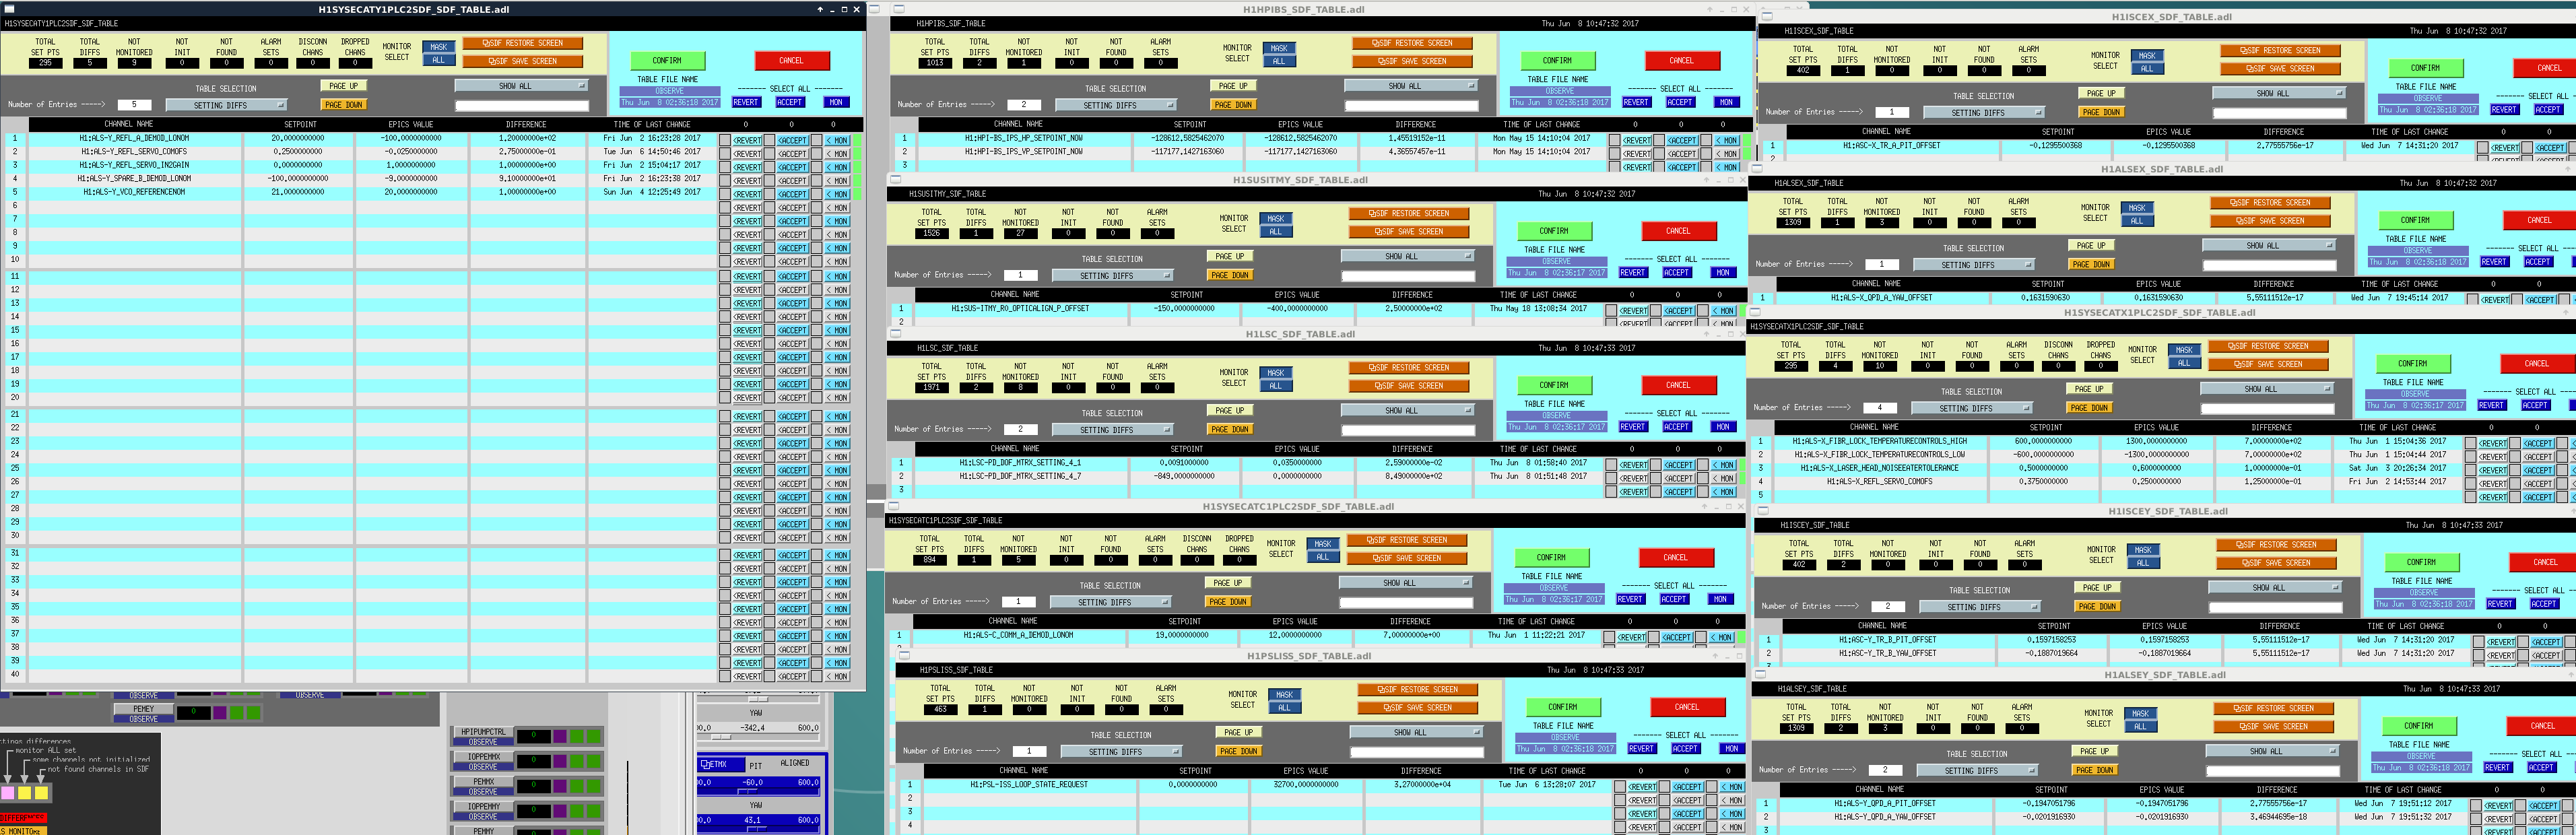
2) DIAG_SDF (see attached screenshot of all diffs found this morning before they were addressed.)
We had handful of SDF Diffs in a few systems, but surprisingly not a whole lof of diffs.
Went over Past Tues Maintenance Open items
New Items for June 13th Maintenance (there was mention of possibly going over 4hrs)
Closed meeting by going over work permits on the TV.
Vacuum staff is aware that annulus IP on HAM 11 is out of range again. Next Tuesday we will check it out. It failed recently but Kyle revived it with a tap. We may have a leak in the o-rings.
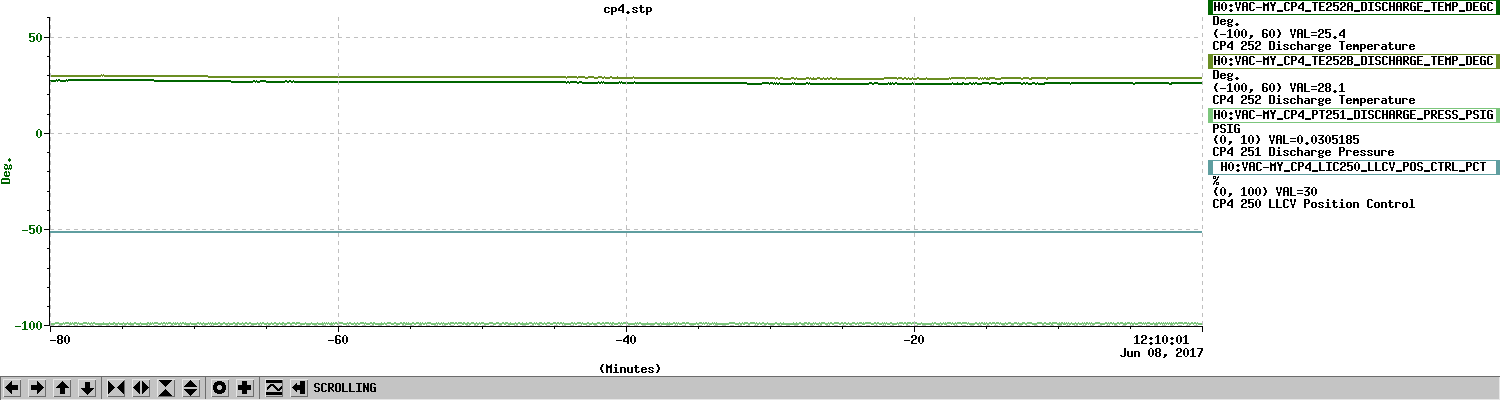
CP4 log file DOES NOT exist!
After getting Official OK from the LHO Run Coordinator (Keita Kawabe), and help with others to address a few tasks Keita wanted addressed, as of June 8th 18:40:06 UTC, H1 is now back to OBSERVING (H1 had been out of OBSERVING for a month & have now rejoined L1 in O2!).
LHO Operator Team: Ops Observatory Mode Returns
This had been in PLANNED ENGINEERING for most of the last month. Let's return to the habit of marking H1's Observatory Mode.
H1:SUS-ITMY_R0_OPTICALIGN_P_OFFSET (from -150 to -400), this is for HWS and ghost beam (alog 36264).
H1:LSC-PD_DOF_MTRX_SETTING_4_1 and 4_7 (from [0.0091, -849] to [0.035, 0]). These are for PRC input matrix (alog 36473).
H1:ALS-C_COMM_A_DEMOD_LONOM (from 19 to 12). Don't know why it was 19dBm, 12dBm sounds good to me.
H1:ALS-X_LASER_HEAD_NOISEEATERTOLERANCE (from 0.5 to 0.6), H1:ALS-X_REFL_SERVO_COMOFS (from 0.375 to 0.25). These were all changed during the X end investigation.
H1:ALS-Y_REFL_A_DEMOD_LONOM (from 20 to -100) and B_DEMOD_LONOM (from -100 to -9), we used to use channel A but at some point A was broken and we switched to B. Since then the board was swapped and both work but we still use channel B.
H1:ALS-Y_VCO_REFERENCENOM (from 21 to 20).
H1:ALS-X_QPD_A_YAW_OFFSET, H1:ASC-X_TR_A_PIT_OFFSET, H1:ALS-Y_QPD_A_PIT_OFFSET, H1:ALS-Y_QPD_A_YAW_OFFSET, H1:ASC-Y_TR_B_PIT_OFFSET and H1:ASC-Y_TR_B_YAW_OFFSET, no real change, just the numerical error on the order of 1E-17.
H1:ASL-X_FIBR_LOCK_TEMPERATURECONTROLS_HIGH and LOW were temporarily set to +-1300 during the X end investigation, doesn't look like we need to keep it, reverted them back to +-600.
H1:ALS-Y_REFL_SERVO_IN2GAIN was set to 1, don't know why but inconsequential, reverted to 0.
TITLE: 06/08 Day Shift: 15:00-23:00 UTC (08:00-16:00 PST), all times posted in UTC
STATE of H1: Planned Engineering
OUTGOING OPERATOR: Patrick
CURRENT ENVIRONMENT:
Wind: 14mph Gusts, 9mph 5min avg
Primary useism: 0.02 μm/s
Secondary useism: 0.13 μm/s
QUICK SUMMARY:
We currently do not have the GWI.stat or our DMT view showing the H1/L1 BNS ranges (Cheryl has emailed local CDS staff); we can see that we've been at NOMINAL LOW NOISE for just under 6hrs. Don't have a range to report, but the DARM spectrum on the front wall looks close to the reference.
At some point this morning we would like to do Sweeps of the LVEA & End Stations
I was not the outgoing operator.
The faulty regulator which turned out to be only a bad o-ring in the regulator itself, has been repaired, reinstalled, and air is flowing again. I unlocked the valves with Chandra watching the vacuum screen in the control room.
While I was repairing the regulator, Kyle was ordering a couple of new regulators for spares.

Chandra and I also replaced the check valves on the corner station instrument air compressor.
The regulator failed again the next day, so we replaced it with an odd ball spare. Awaiting order delivery of direct replacements.
