[Kiwamu, Jenne, Vaishali]
Today we reset the green initial alignment setpoints (input laser pointing and ITM camera centroids) to match the SOFT offsets that we like at high power. Hopefully this makes locking more smooth, since the SOFT loops won't have to work very hard anymore.
We also chose new input matrix elements for the SRM ASC at high power. Kiwamu noted that AS36B was more responsive than AS36A (which is what we had been using), so we use mostly B with a little bit of A to get the total error point to be zero at the optimal SRM pointing. This is now in the guardian, although we haven't been able to relock to try running through the SRM_ASC_High_Power state. It should be fine though.
We lost lock at basically NomLowNoise when we closed the beam diverters. I'm not sure it was them - I think it was just time-coincident with a CSOFT pitch oscillation at 2.75Hz that came from my increase of the CSOFT Pit gain from 0.6 to 0.8 in an effort to squash the dP/dTheta instability. I think we need to get locked and measure the CSOFT loop to see if we can increase the gain at all, although it looks like the more promising plan might be to re-engage the ISS 3rd loop. We'll think on this more tomorrow.
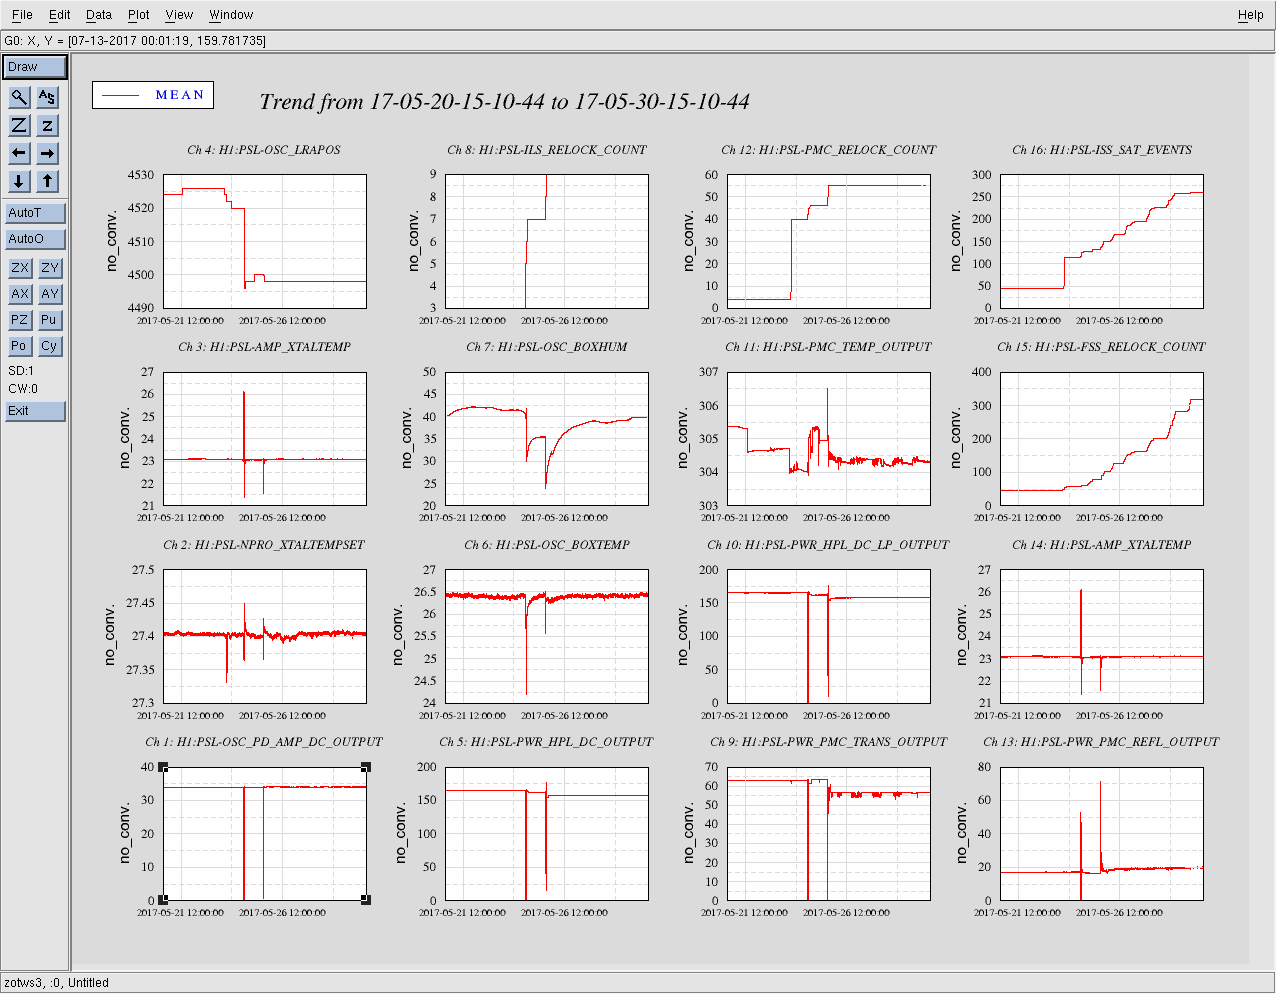
Right now we're having trouble holding the IFO on ALS. Both Ed and Patrick noticed that the FSS is oscillating pretty regularly, and they're concerned that it's what is causing our locklosses. Peter and Jason, can you please take a look at the FSS in the morning?