TITLE: 04/20 Day Shift: 15:00-23:00 UTC (08:00-16:00 PST), all times posted in UTC
STATE of H1: Observing at 56Mpc
INCOMING OPERATOR: Patrick
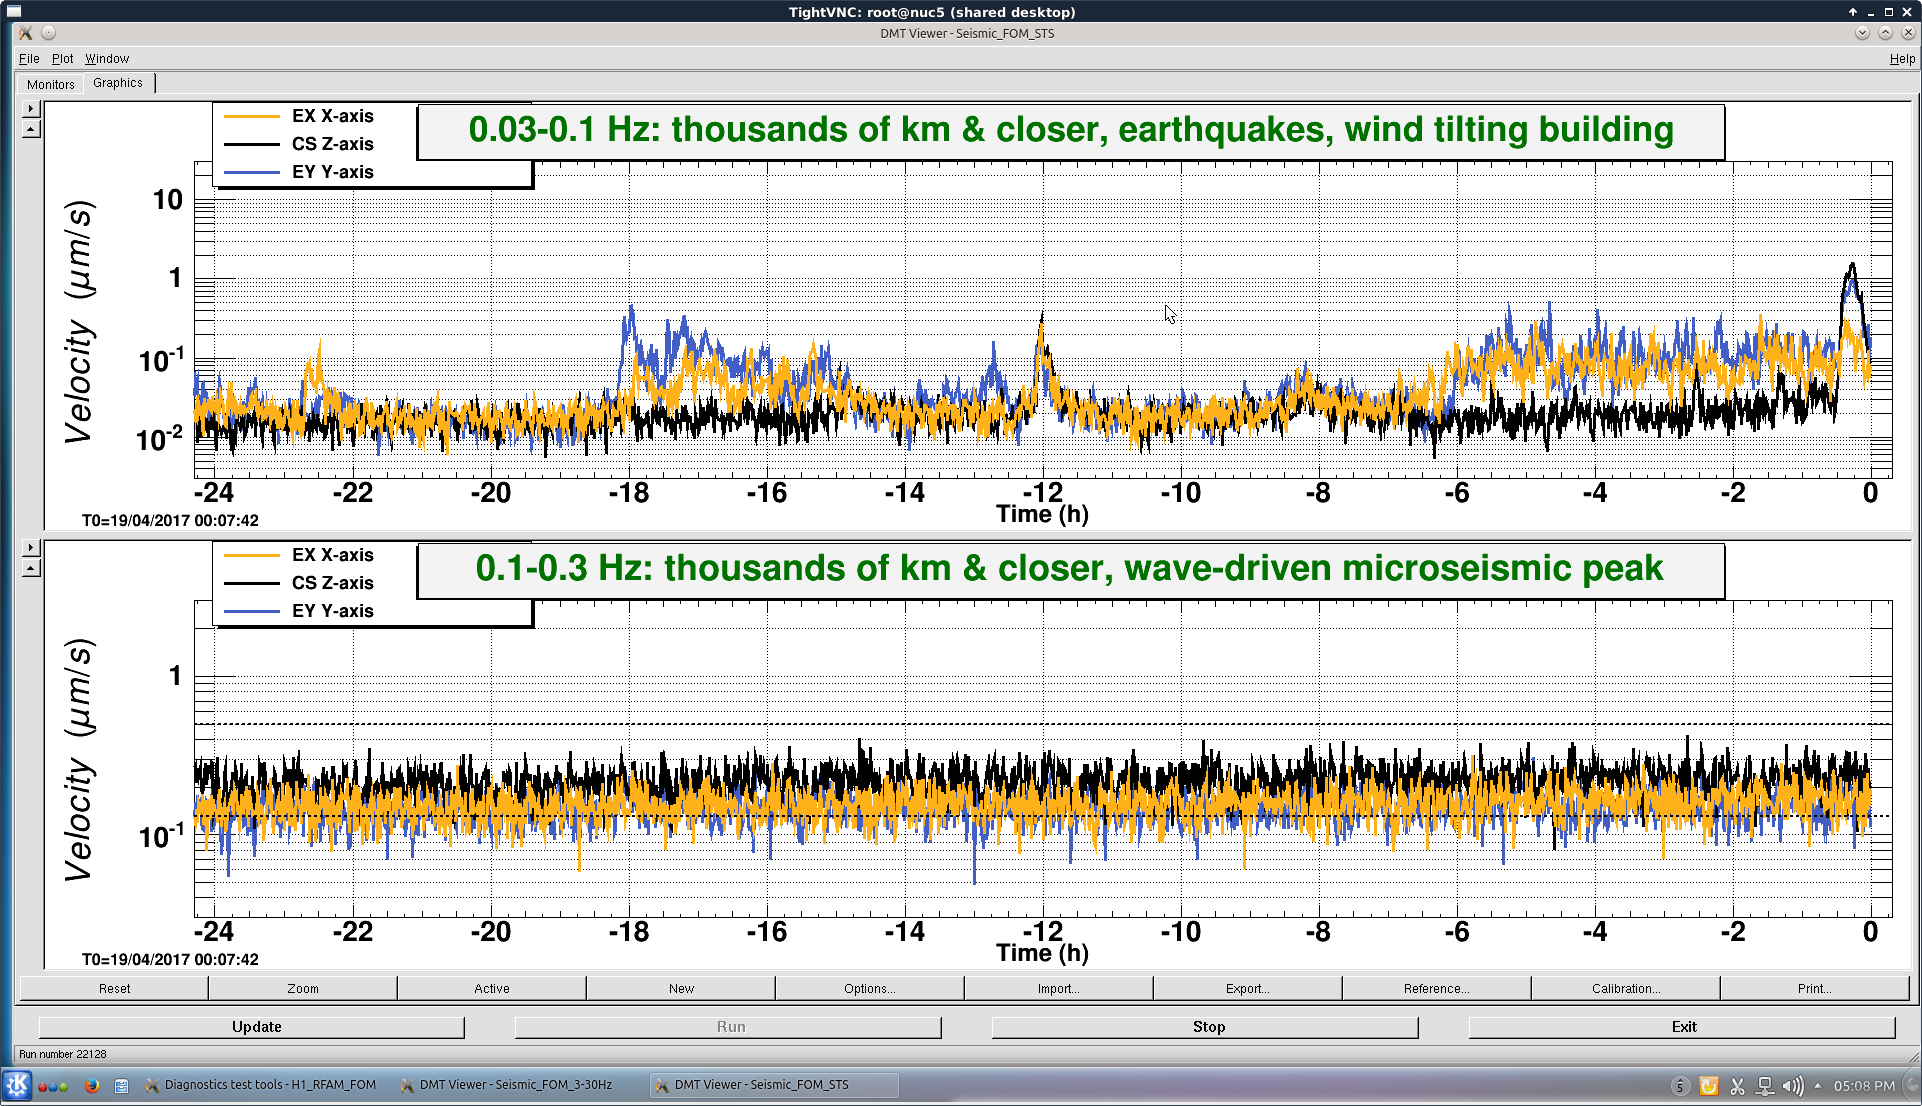
SHIFT SUMMARY: Commissioning first half of the shift. We lost about an hour possibly due to the ALSX fiber polarization being very close to the limit. After we turned down the polarization we had no issue relocking.
LOG:
16:00 Commissioning started
16:11 Karen+Christina fork lifting in mechanical area/LSB
16:15 Robert to LVEA
16:46 Chandra to LVEA
16:54 Chandra out, heading to Mid stations
17:03 Fork lifting done. Sheila done. Robert to LVEA
17:17 Kyle banging something loud in the vacuum lab. Asked him to postpone until Robert measurement is done.
18:13 Robert out
18:22 Chandra back
20:23 Robert out. Done for the day.
20:30 Back to Observe
21:03 Karen left VPW (drove there like an hour ago)
22:56 Out of Observe to address 4.7kHz violin mode.
23:07 Back to Observe