nutsinee.kijbunchoo@LIGO.ORG - posted 04:13, Wednesday 12 April 2017 (35488)
Ops Owl Midshift Summary
Been locked for almost 8 hours. Not much else is going on.
Been locked for almost 8 hours. Not much else is going on.
TITLE: 04/12 Eve Shift: 23:00-07:00 UTC (16:00-00:00 PST), all times posted in UTC
STATE of H1: Observing at 67Mpc
INCOMING OPERATOR: Nutsinee
SHIFT SUMMARY: One mysterious lockloss halfway through the shift. Otherwise, no issues.
LOG: See previous aLogs.
Peter, Jason, TJ, Nutsinee
This morning we rotated the beam splitter mount and aligned the green beam to the newly installed GigE camera. In theory the path of the green and the returned sled beam should overlap, but the camera didn't see the SLED even with the green well aligned. Given that the SLED shouldn't be too far off we tried installing a 800nm bandpass filter in front of the camera and randomly pitched and yawed the BS hoping something would show up, that didn't work. Many hours were spent trying to directly align the return sled light to the camera, but seeing the beam in the first place was a challenge. Since the pickoff BS is a 90:10, with 10% being the light reflected to the GigE camera. We tried swapping out the old sled for a new spare. Still, we didn't get anything. We also tried to point the camera in front of the steering mirror (before sled hits the pickoff BS), we couldn't get anything either. The next step to take here is probably go through some document to make sure that the camera can actually see 790nm. We left the green beam aligned to the camera, removed the bandpass filter (which was temporary borrowed), and closed out around noon.
The old 790nm sled S/N 07.14.256 was replaced with a spare S/N 07.14.254. Since the old one wasn't totally dead, we kept it in the spared box. So currently there's only one 790nm (new) spare sled left.
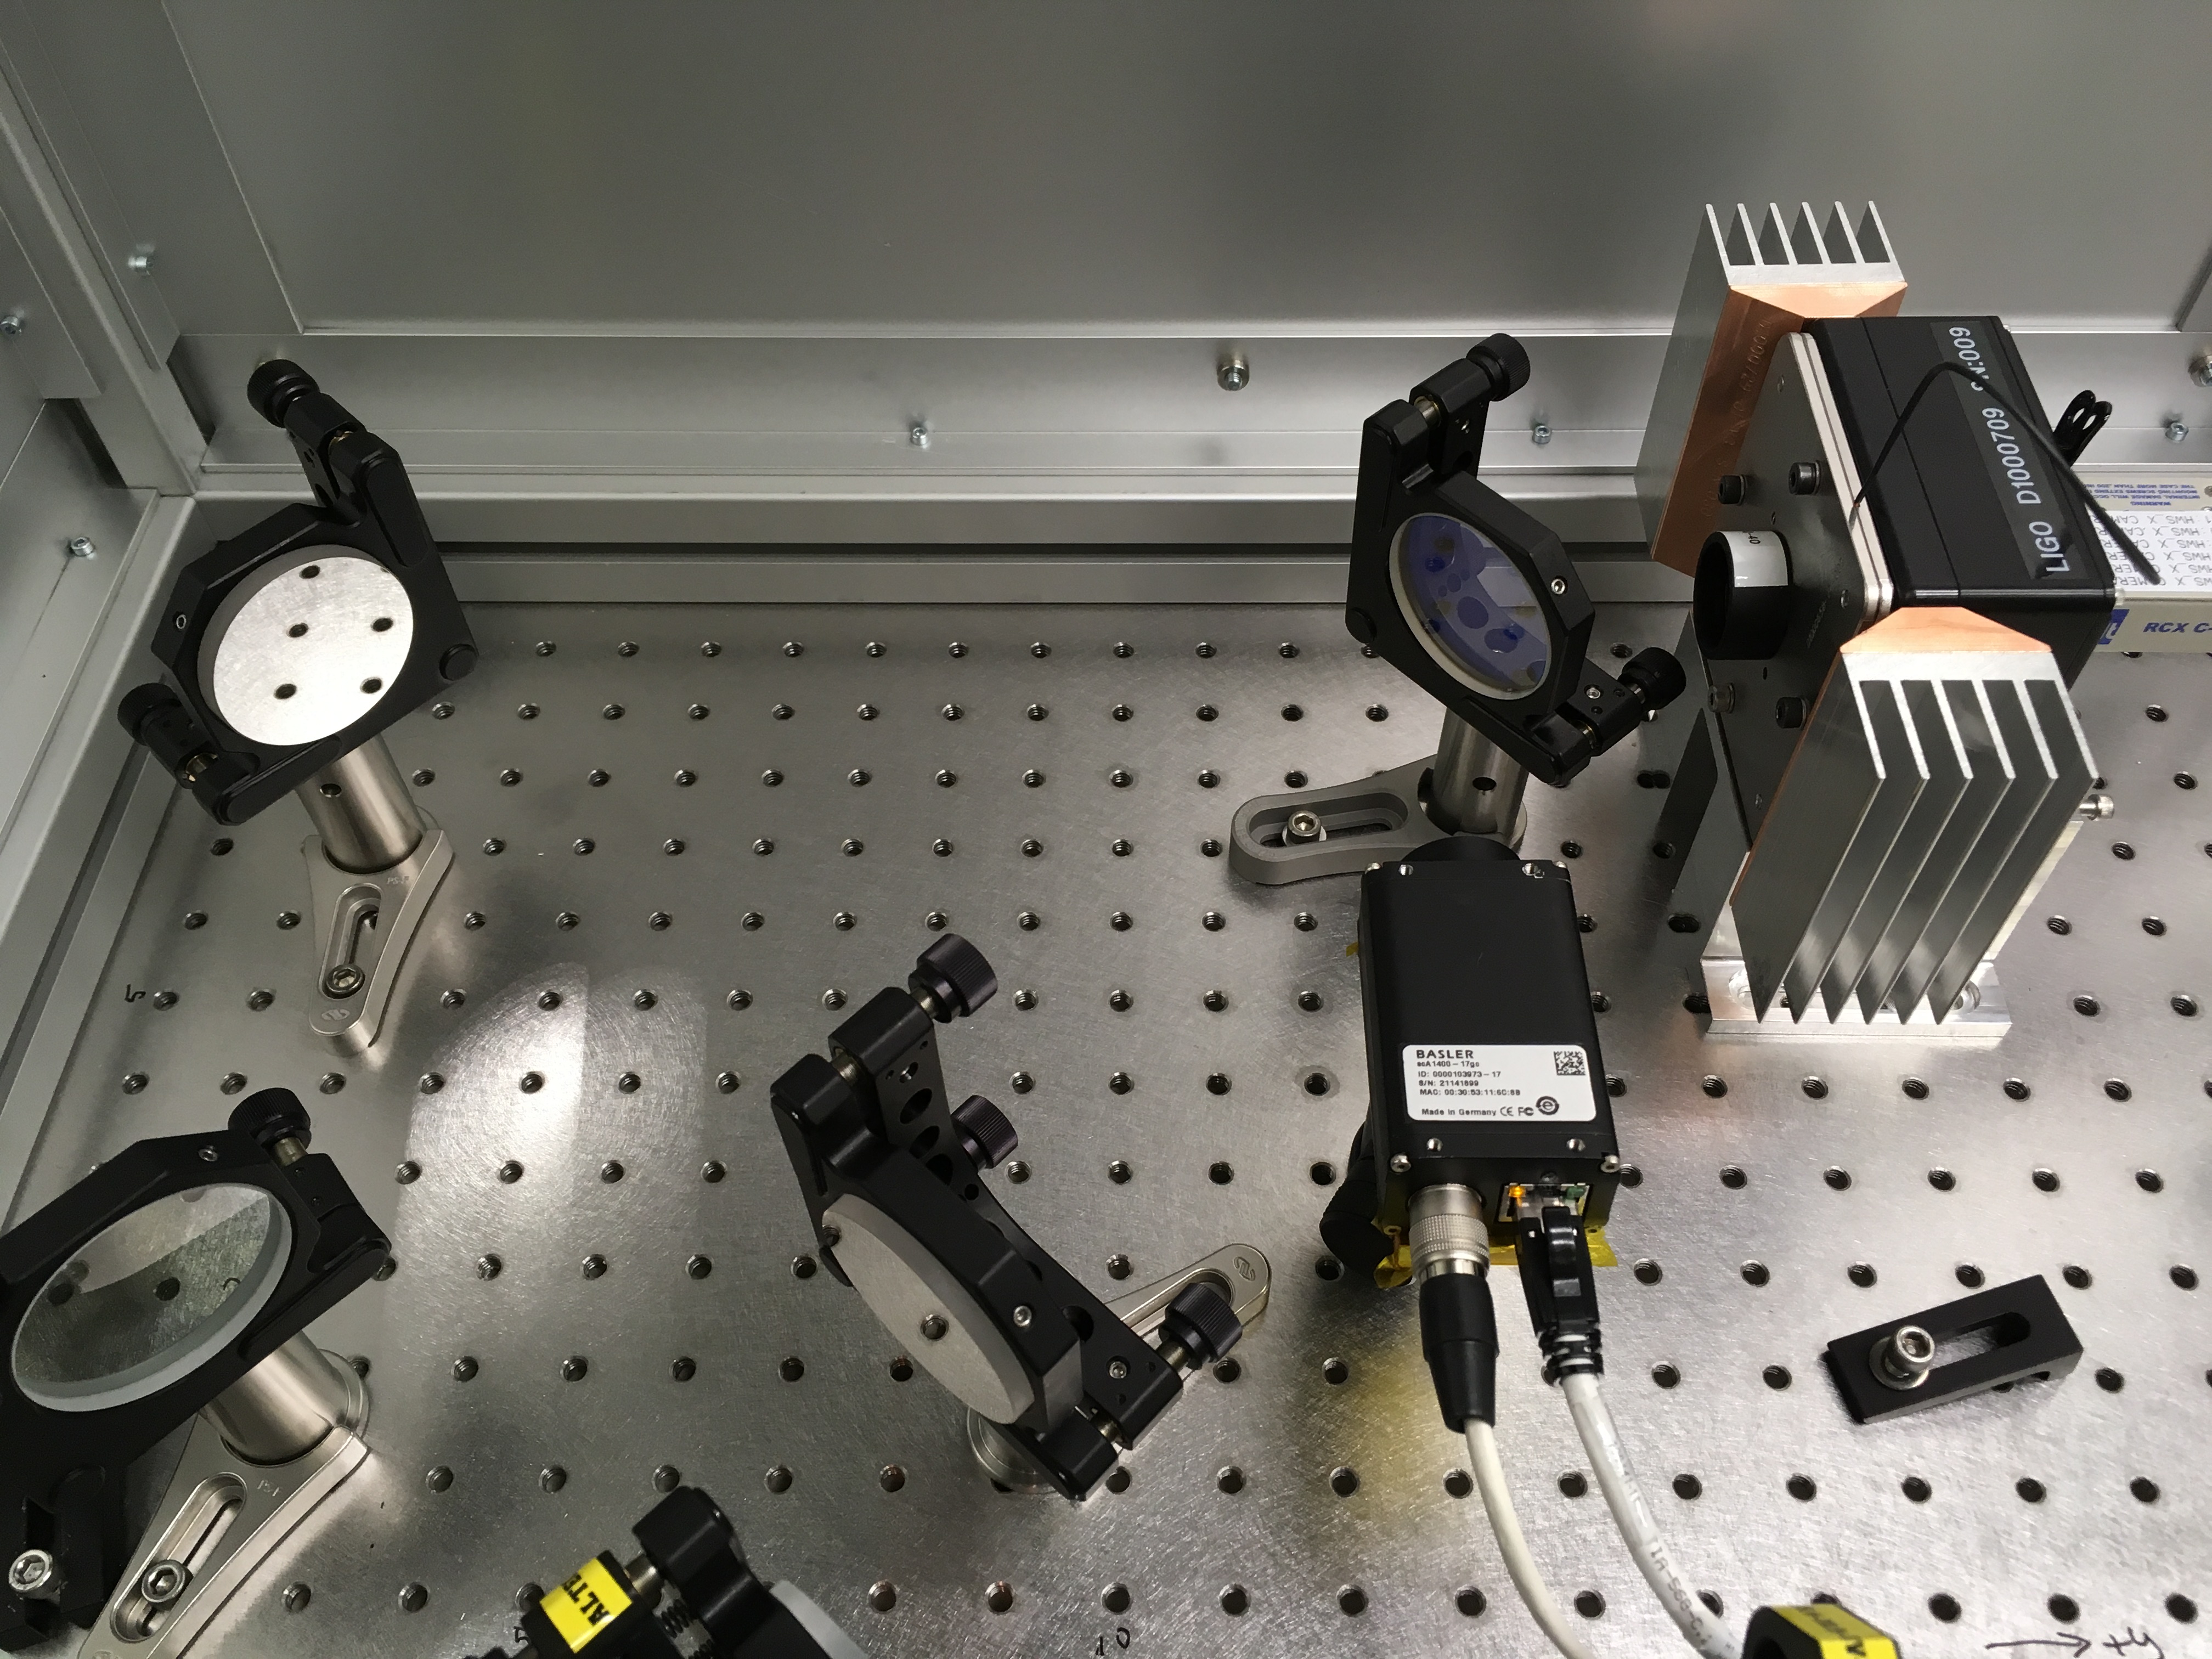
Checked the document. The camera spectral range is 400-1000 nm.
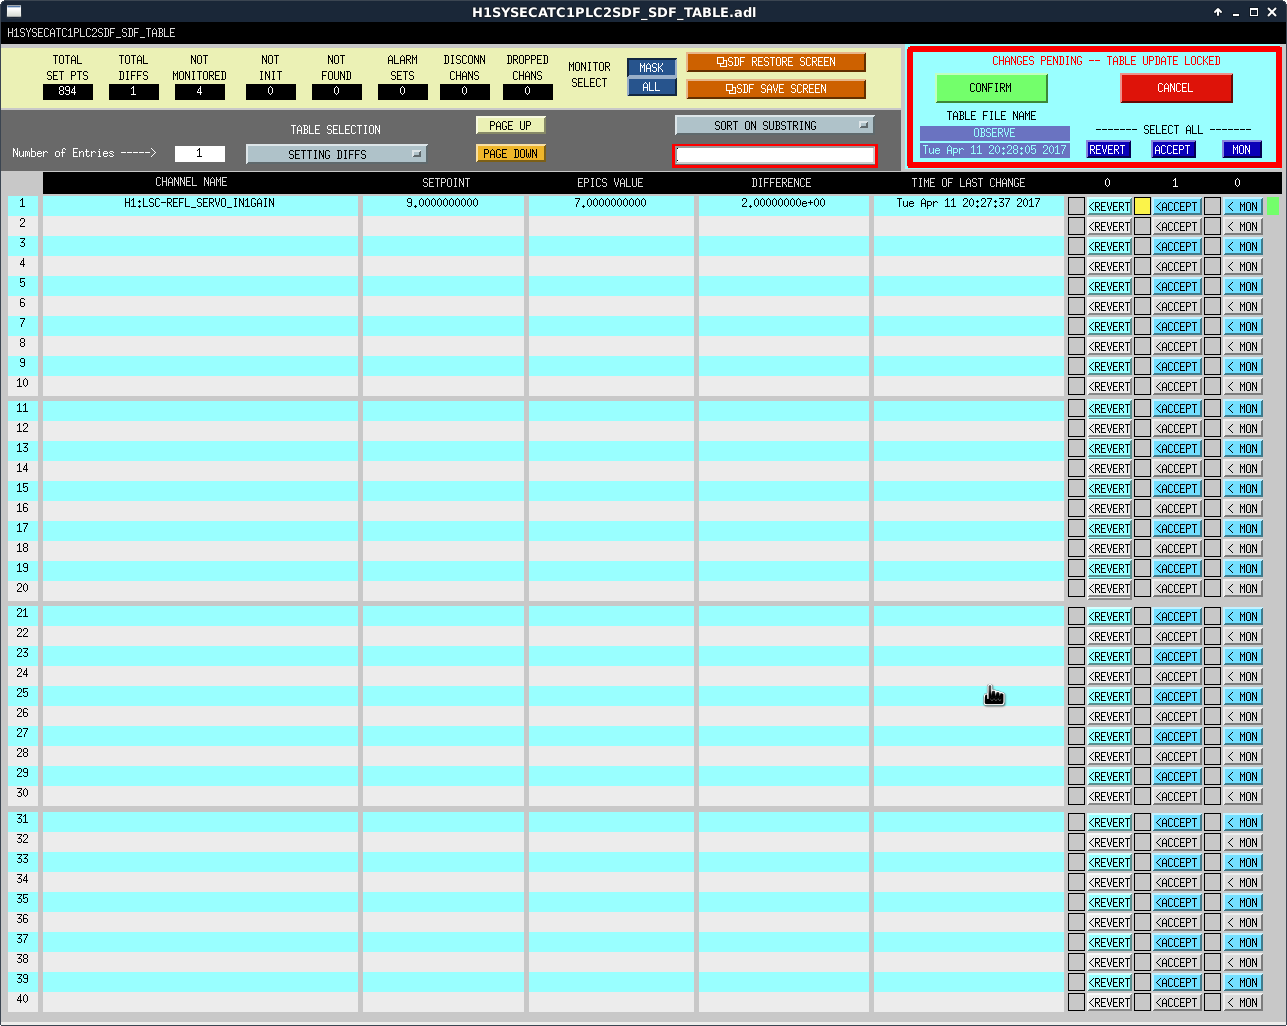
No issues relocking. Had to accept ECATPLC2 SDF diff (H1:LSC-REFL_SERVO_IN1GAIN). Screenshot attached.
Nothing obvious on FOMs.
TITLE: 04/11 Eve Shift: 23:00-07:00 UTC (16:00-00:00 PST), all times posted in UTC
STATE of H1: Observing at 69Mpc
OUTGOING OPERATOR: Jeff
CURRENT ENVIRONMENT:
Wind: 8mph Gusts, 6mph 5min avg
Primary useism: 0.05 μm/s
Secondary useism: 0.18 μm/s
QUICK SUMMARY: Jeff handed me a freshly relocked, observing IFO. No unusual issues handed off.
Scroll pumps #3, #4 and #5 were greased today.
A new relief valve was installed on unit #5.
Unit #2 still needs a check valve replaced.
Work done under WP 6541.
With J. Kissel, A. Viets, D. Barker; Re: WP 6567 and 6572.
The work listed on the above work permits is now done.
i. DMT yum updates and reboots are done. DMT is now running ROOT6 and gstlal-calibration-1.1.5.
ii. Channels were added to the framebroadcaster:
H1:CAL-CS_TDEP_ESD_LINE1_REF_A_TST_NOLOCK_REAL
H1:CAL-CS_TDEP_ESD_LINE1_REF_A_TST_NOLOCK_IMAG
H1:CAL-CS_TDEP_PCALY_LINE4_REF_C_NOCAVPOLE_REAL
H1:CAL-CS_TDEP_PCALY_LINE4_REF_C_NOCAVPOLE_IMAG
H1:CAL-CS_TDEP_PCALY_LINE4_REF_D_REAL
H1:CAL-CS_TDEP_PCALY_LINE4_REF_D_IMAG
H1:CAL-CS_TDEP_PCALY_LINE4_REF_A_TST_REAL
H1:CAL-CS_TDEP_PCALY_LINE4_REF_A_TST_IMAG
H1:CAL-CS_TDEP_PCALY_LINE4_REF_A_USUM_REAL
H1:CAL-CS_TDEP_PCALY_LINE4_REF_A_USUM_IMAG
iii. DMT calibration hoft and DCS aggregated hoft updated to now output these new channels:
H1:GDS-CALIB_F_S
H1:GDS-CALIB_F_S_NOGATE
H1:GDS-CALIB_SRC_Q_INVERSE
H1:GDS-CALIB_SRC_Q_INVERSE_NOGATE
starting from 1175978240 (Apr 11 2017 20:37:04 UTC).
That completes DMT/calibration updates and SRC detuning time dependent tracking in work permits 6567 and 6572 respectively.
On the LHO CDS web home page, I've added a SPI link to the GDS/DMT monitor status web page.
TJ restarted the DIAG_MAIN node. The available memory on h1guardian0 increased from 35GB to 43GB.
J. Kissel, A. Viets
WP #6572
ECR E1700121
II 7828

Because I'm not sure how long it'll take to make the MED screens and fully commission the new parts' settings until we have results, I just want to get an aLOG in there that confirms we've installed the front-end infrastructure changes to begin tracking the SRC detuning as a function of time.

This required modifying
/opt/rtcds/userapps/release/cal/common/models/CAL_CS_MASTER.mdl
to include many new EPICs records that store various DARM loop model component values at the already-existing PCAL line frequency (7.93 Hz), and as a bonus, I also installed all of the infrastructure to compute the SRC detuning frequency in the front-end as well -- it was an easy extension of the existing software to calculate the optical gain and cavity pole frequency, following the math in T1700106 and LHO aLOG 35105.

I've installed values for these new EPICs records using svn up'd versions of
/ligo/svncommon/CalSVN/aligocalibration/trunk/Runs/O2/H1/Scripts/CAL_EPICS/writeH1_CAL_EPICS.m
/ligo/svncommon/CalSVN/aligocalibration/trunk/Runs/O2/Common/Scripts/CAL_EPICS/writeO2_TDEP_EPICS.m
/ligo/svncommon/CalSVN/aligocalibration/trunk/Runs/O2/DARMmodel/Scripts/computeEPICS.m

To do/aLOG:
 - Take screen shots of the new model infrstructure to show the implementation
 - Update TDEP MEDM overview screen to include the new math
 - Install demodulation parameters and lowpass filters for new 7.93 Hz demod
 - Install low-passes on F_S and Q_S output banks
 - Compare against GDS pipeline output
After an update to the frame broadcaster channel list and a minor correction to the write-EPICS code, we have restarted the primary and redundant calibration pipelines. The restart was at GPS second 1175976351. We can confirm whether the SRC detuning parameter algorithm is working once we have a lock stretch. For information on the new filters, see:
https://alog.ligo-wa.caltech.edu/aLOG/index.php?callRep=35462
For information on the new gstlal-calibration code release, see https://bugs.ligo.org/redmine/issues/5440
In addition, there are two small improvements I've noted:
1) The latency is reduced from ~12s to ~7s.
2) The CPU usage is reduced from ~55% to ~45%
I reset both PSL power watchdogs at 19:16 UTC (12:16 PDT). This completes FAMIS 3645.
Greg, Aaron and John are in the midst of the GDS/DMT update.
Re: WP 6567
The yum updates and reboots of the DMT computers is done. I've also restarted the dmt processes on each box.
The next step is for Aaron Viets to restart the calibration using gstlal-calibration-1.1.5.
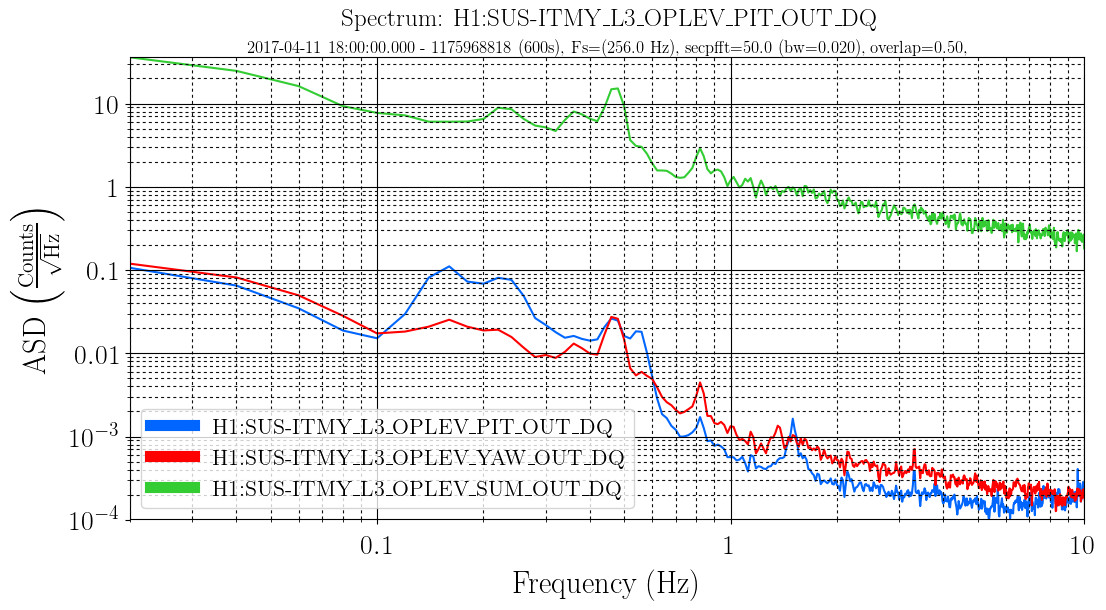
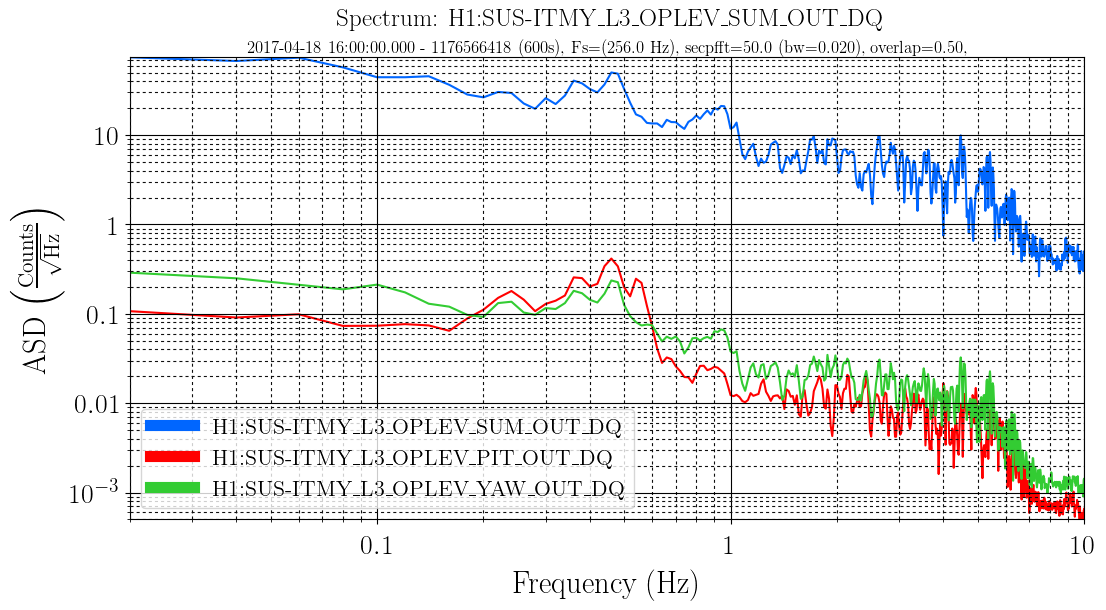
This morning I swapped the ITMy oplev laser, per LHO WP 6565. This was in response to this alog from K. Venkateswara and J. Kissel, indicating an ~0.44 Hz feature on the ITMy oplev (that showed up after the laser swap on March 7th) was possibly due to an issue with the laser and causing range issues. The old laser SN was 189-1, the new laser SN is 191. This laser will need a few hours to come to thermal equilibrium, once that is done I will assess whether or not the laser needs a power tweak for glitch-free operation; I will leave WP 6565 open until this is complete.
Went out today to tweak the power of this laser, as it is still glitching, and found the interior of the box to be very warm. This is highly unusual. I also found the exterior mounted box that holds the DC/DC converter that powers the laser to be very warm as well. My suspicion is that something, likely the laser, is drawing more current than it should. I checked the other oplev lasers in the LVEA and none of them were running warm like this. The quickest fix at this point is to swap in another laser. Unfortunately the only laser currently ready for swap in is SN 189-1, which happens to be the laser I just removed from the ITMy oplev due to concerns over an ~0.44 Hz feature that might be from the laser. Doing a quick spectrum of the new ITMy oplev laser SUM, pitch, and yaw signals after install on 4/11/2017 (attachment 1) and this morning (attachment 2) shows that the laser is currently very noisy compared to just after install (likely due to the increased operating temperature), but also still shows a feature at ~0.44Hz. As this ~0.44Hz feature is still there with this new laser, the feature is likely either from the the electronics of the ITMy oplev (QPD, whitening chassis) or is something real that the oplev is only a witness for. Assuming laser SN 189-1 checks out in the lab, I will re-install SN 189-1 into the ITMy oplev at the next available opportunity.
Carlos has returned the HWS card to h1hwsex (was in the spare machine h1hwsmsr1).
There were number of high frequency calibration lines injected using the automated Guardian scripts. These lines are injected using the Pcal at ENDX (ENDY is used for calibration purpose). The GPS time at which these lines were running are listed below:
| Frequency | Starttime | Endtime |
| 2001.3 | 1174765755 | 1174843009 |
| 2501.3 | 1174843010 | 1175048873 |
| 3001.3 | 1175048874 | 1175185602 |
| 3501.3 | 1175185604 | 1175280996 |
| 4001.3 | 1175280998 | 1175367396 |
| 4501.3 | 1175367398 | 1175532906 |
| 5001.3 | 1175532908 |
Rick, Sudarshan
Th high frequency line was moved to 5501.3 Hz. The guardian script was designed to go upto 5001.3 Hz so Rick moved the frequency to 5501.3 Hz manually during the maintenance period. We will move this line to 6001.3 Hz when we have enough data and the ifo goes out of lock next time.
Updated list of lines with their start and endtime.
| Frequency | Starttime | Endtime |
| 5001.3 | 1175532908 | 1175971199 |
| 5501.3 | 1175971561 | 1176156175 |
| 5751.3 | 1176156177 | 1176255835 |
| 5251.3 | 1176255837 | 1176350524 |
| 4751.3 | 1176350525 |