edmond.merilh@LIGO.ORG - posted 00:00, Monday 10 April 2017 (35429)
Shift Summary - Eve
TITLE: 04/10 Eve Shift: 23:00-07:00 UTC (16:00-00:00 PST), all times posted in UTC
STATE of H1: Observing at 65Mpc
INCOMING OPERATOR: Nutsinee
SHIFT SUMMARY:
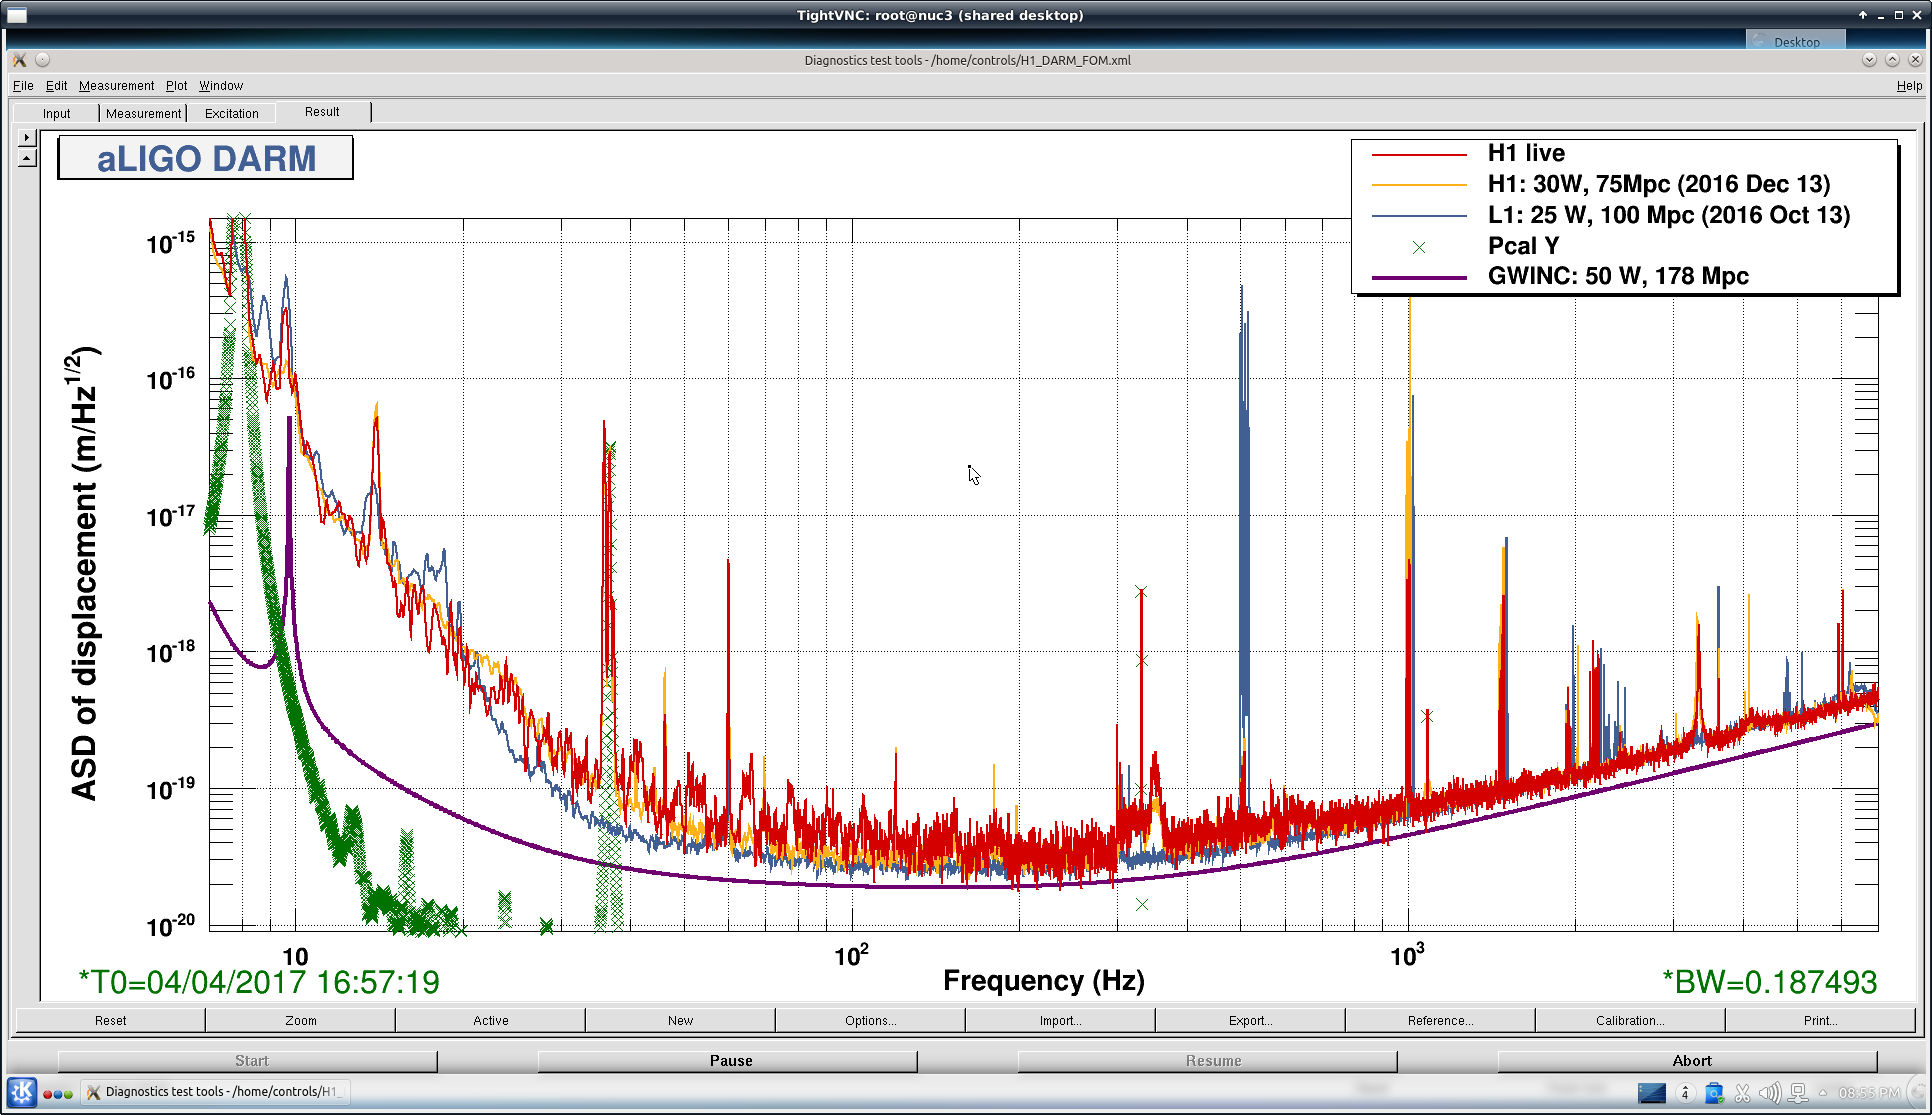
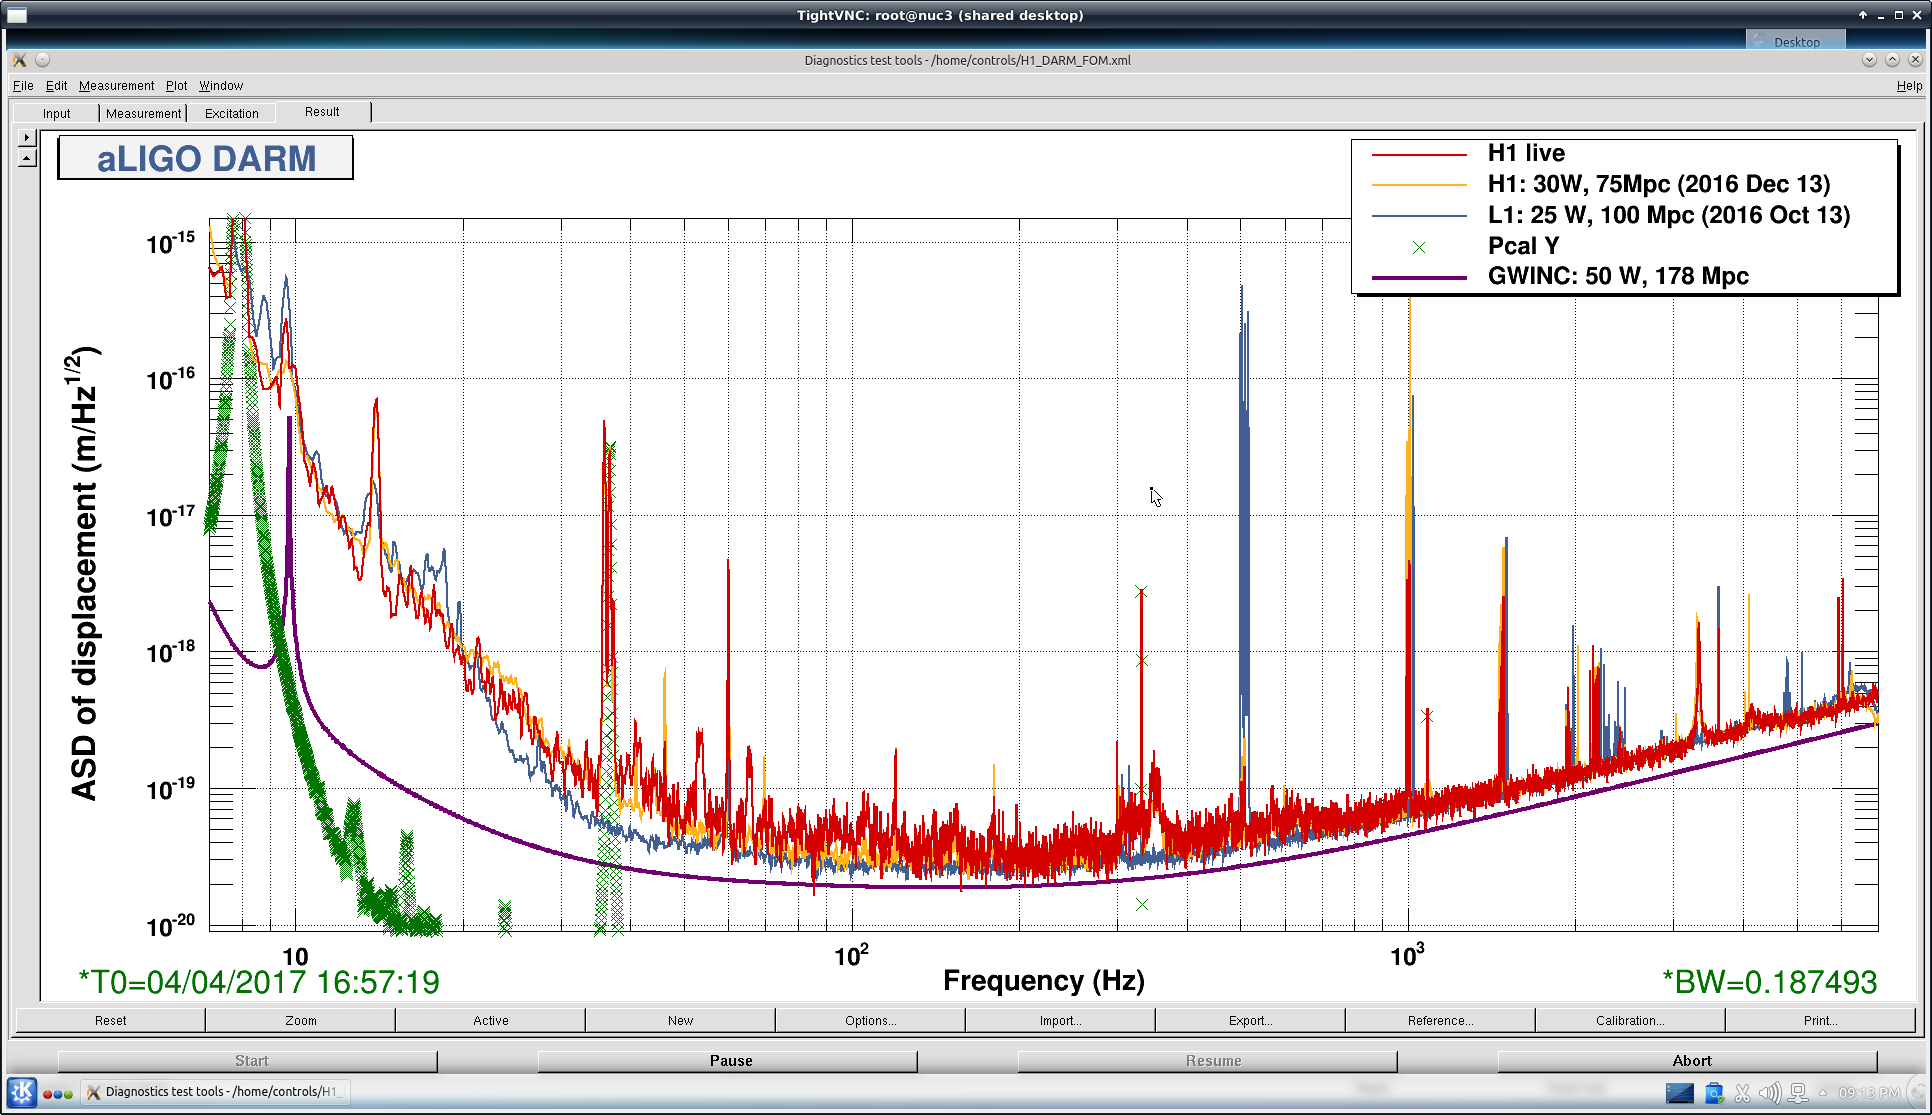
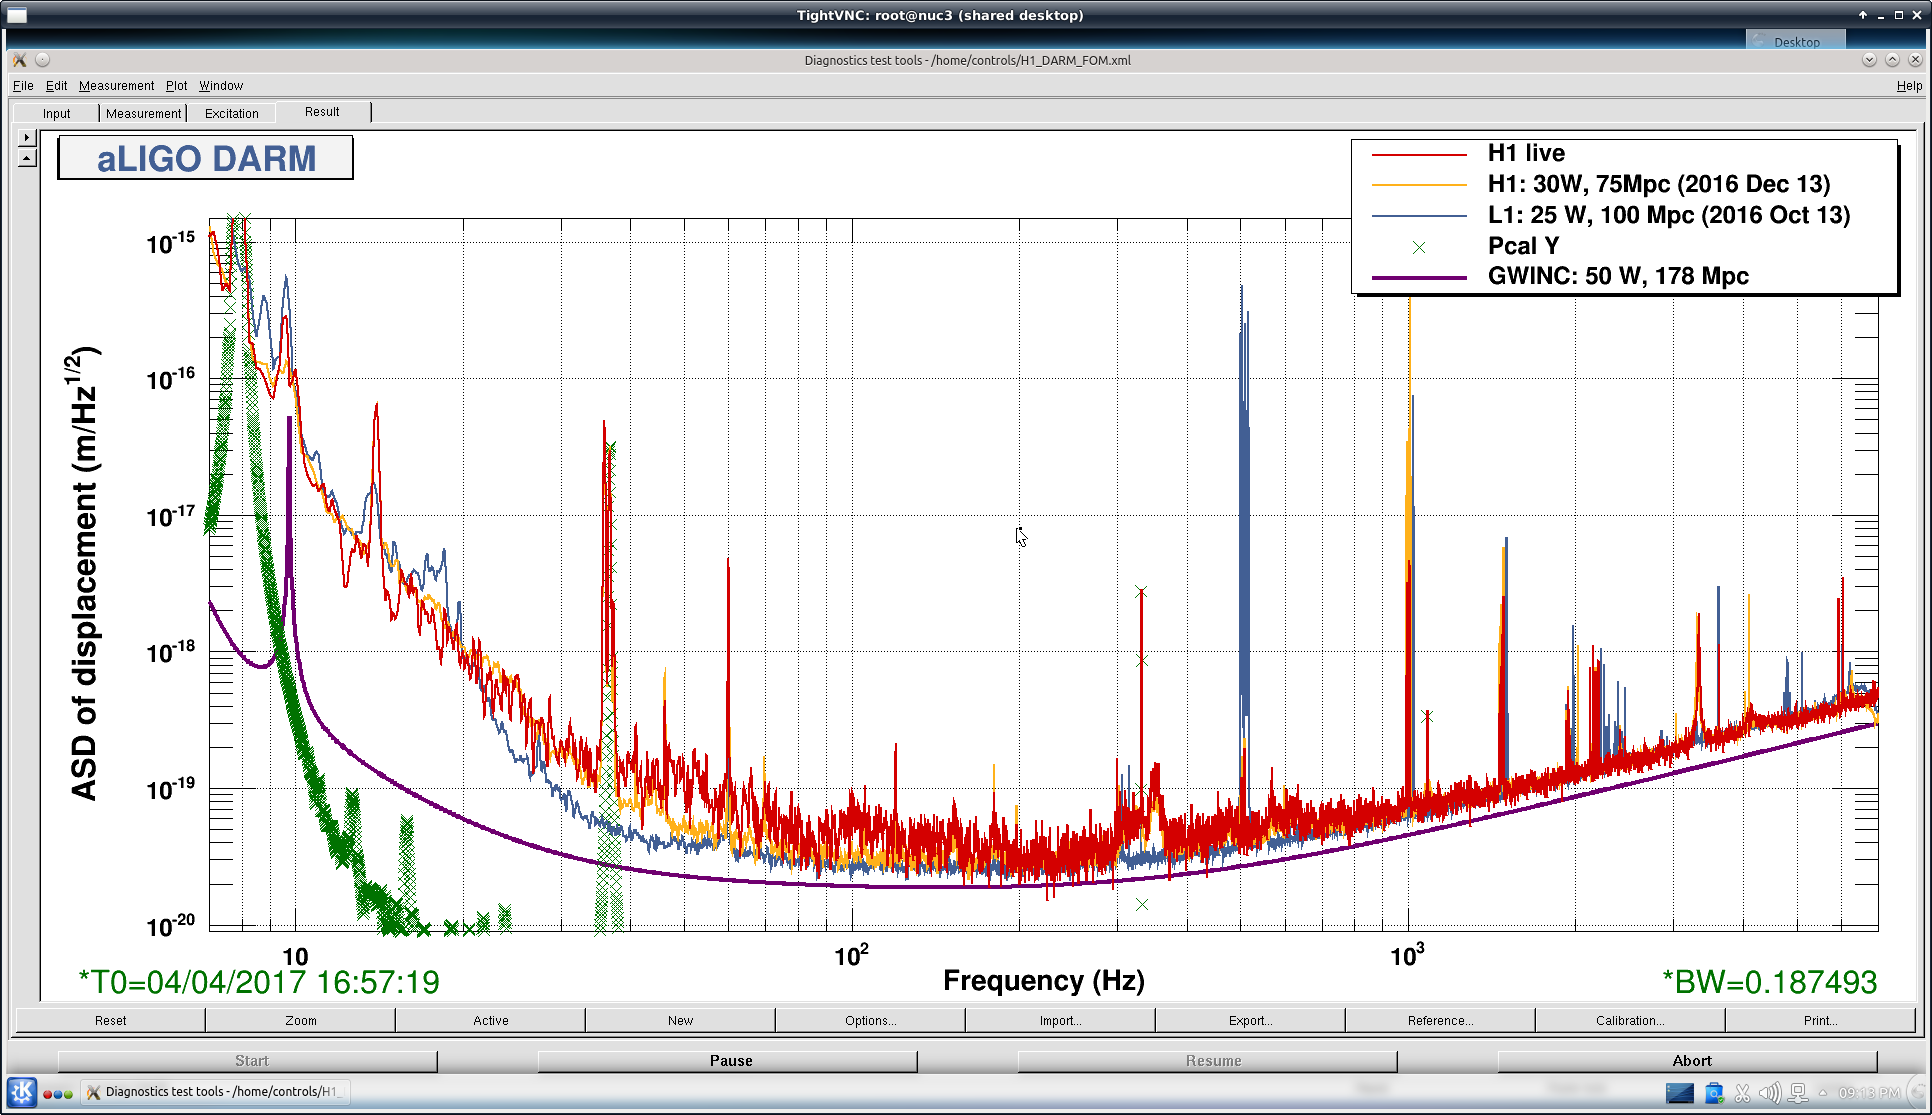
Strange Looking comb(?) in DARM. (see my aLog) Otherwise, quiet shift. We Broke our old 02 record by 30minutes (so far). Handing off to Nutsinee.
LOG: