jim.warner@LIGO.ORG - posted 16:43, Tuesday 12 May 2026 (90217)
Prep for CRS assembly in H2 PSL anteroom
Shoshana, MichaelR, Jim
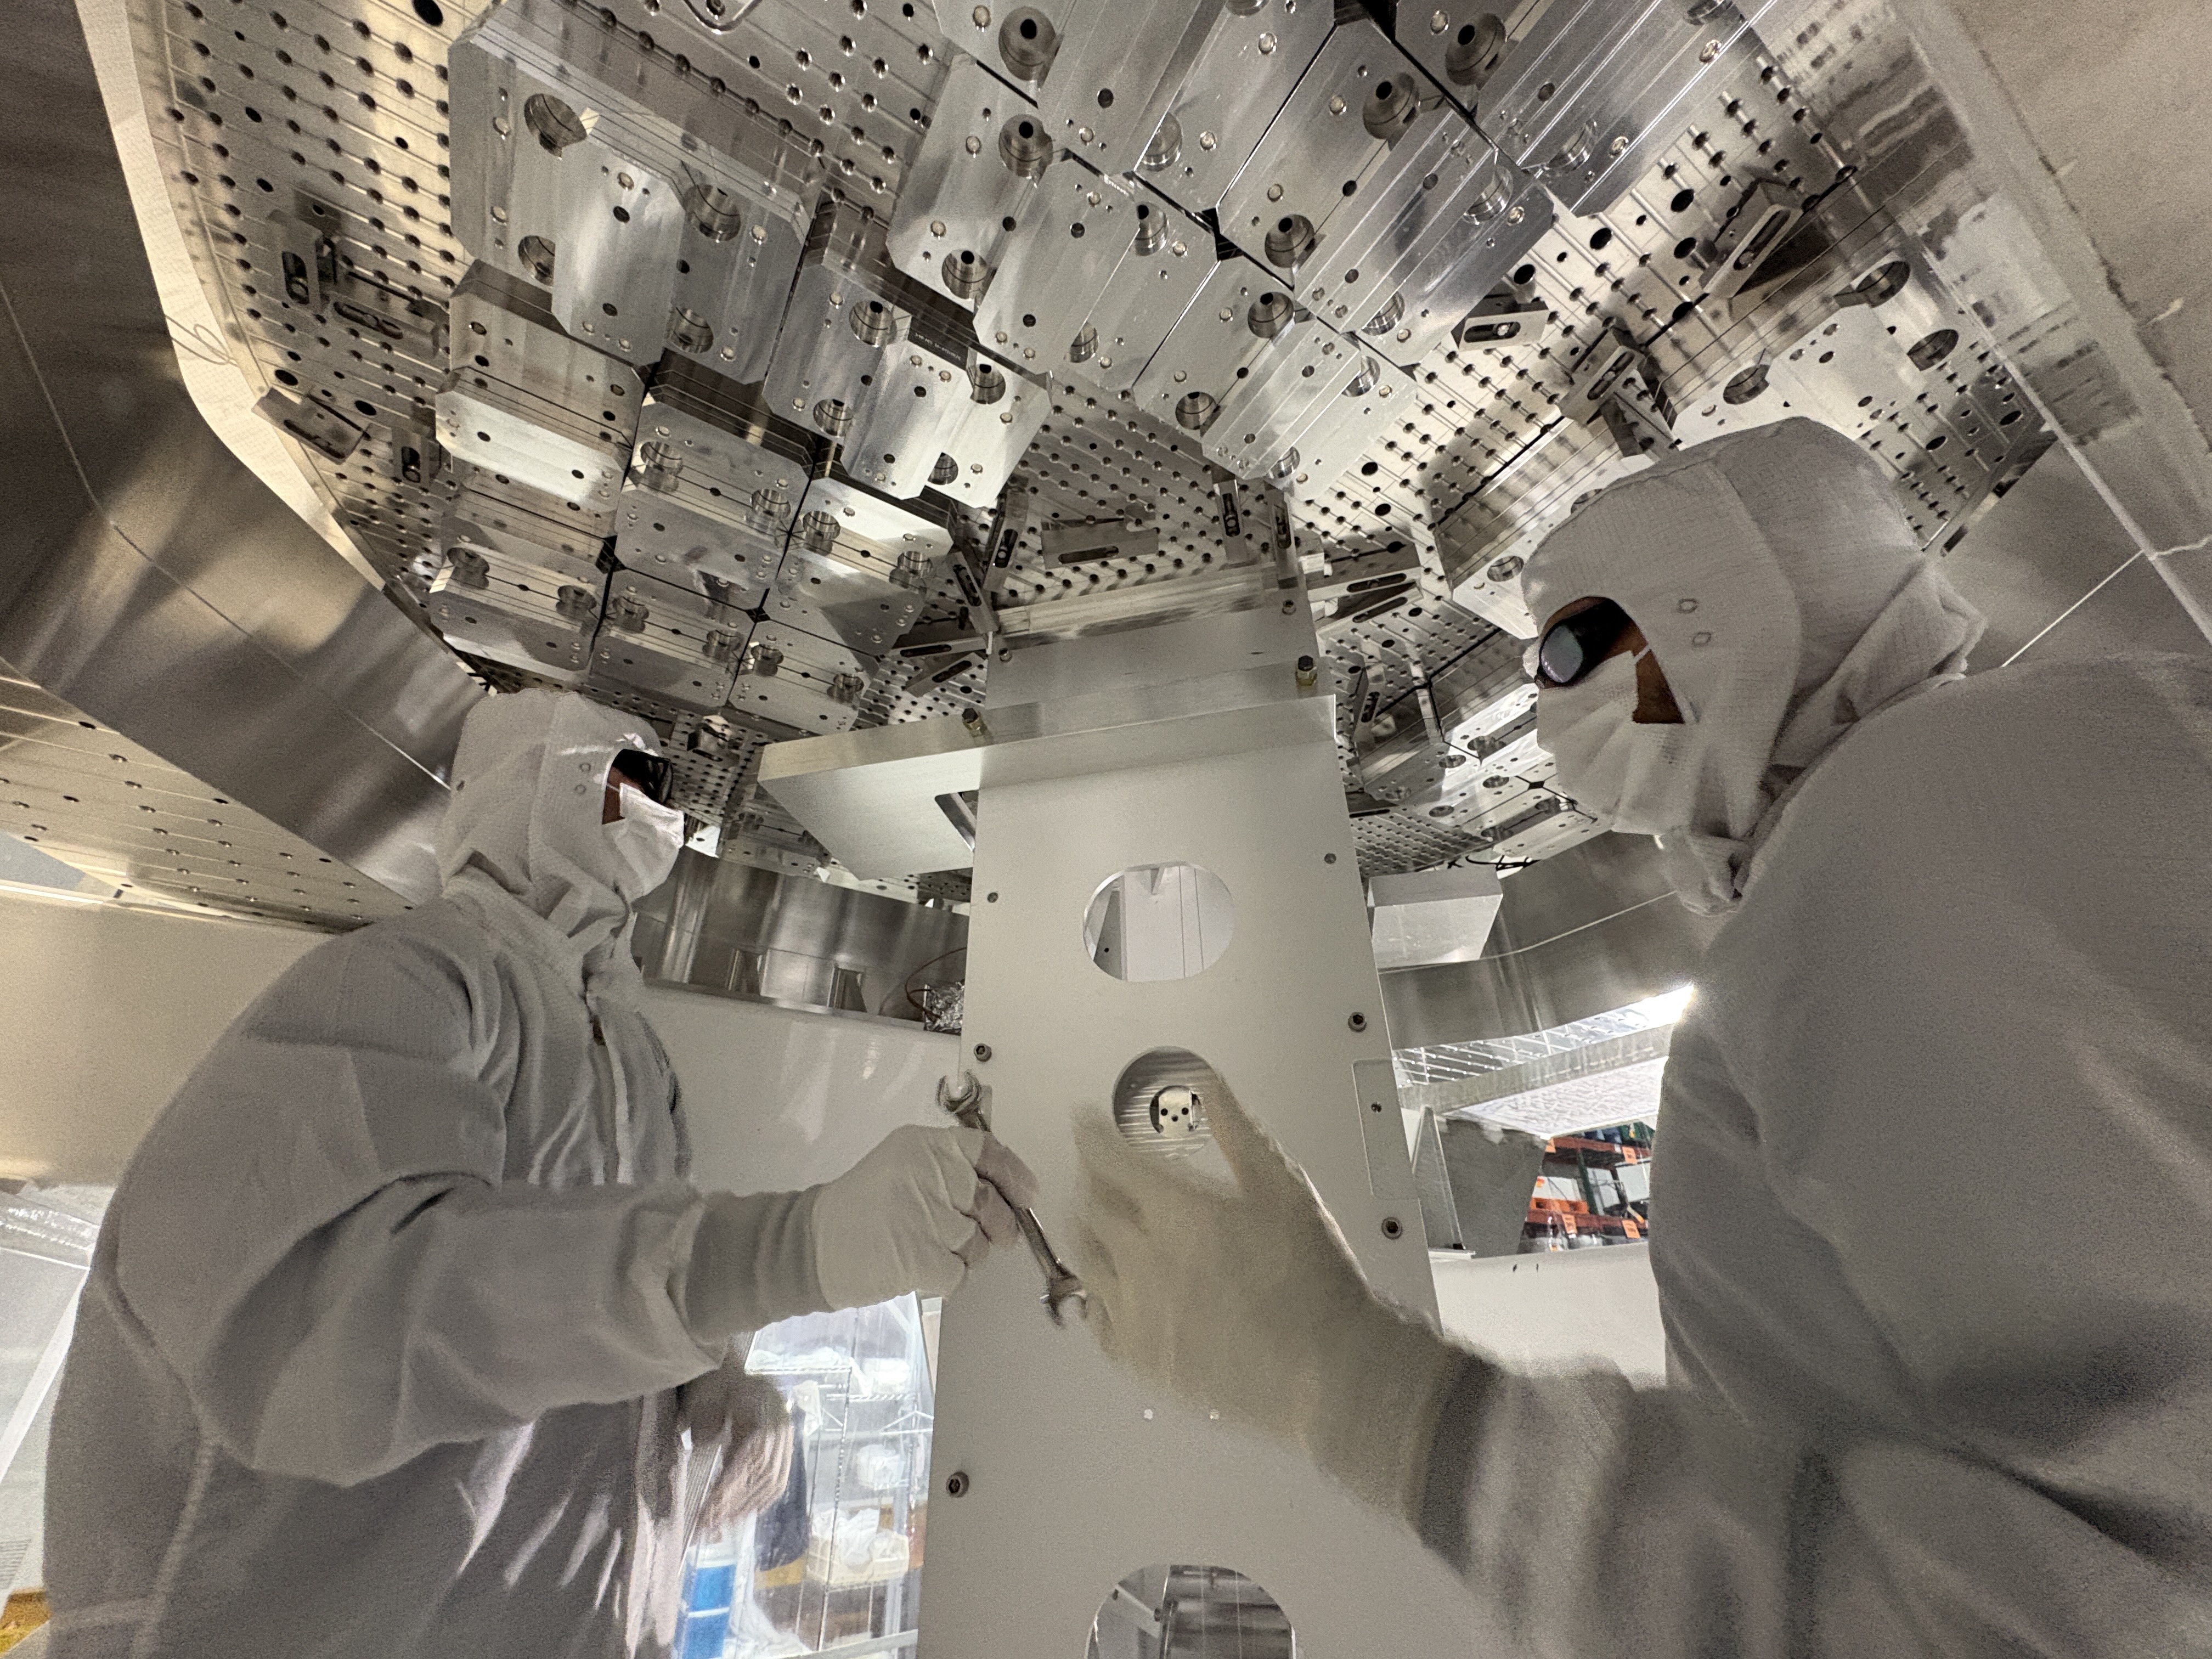
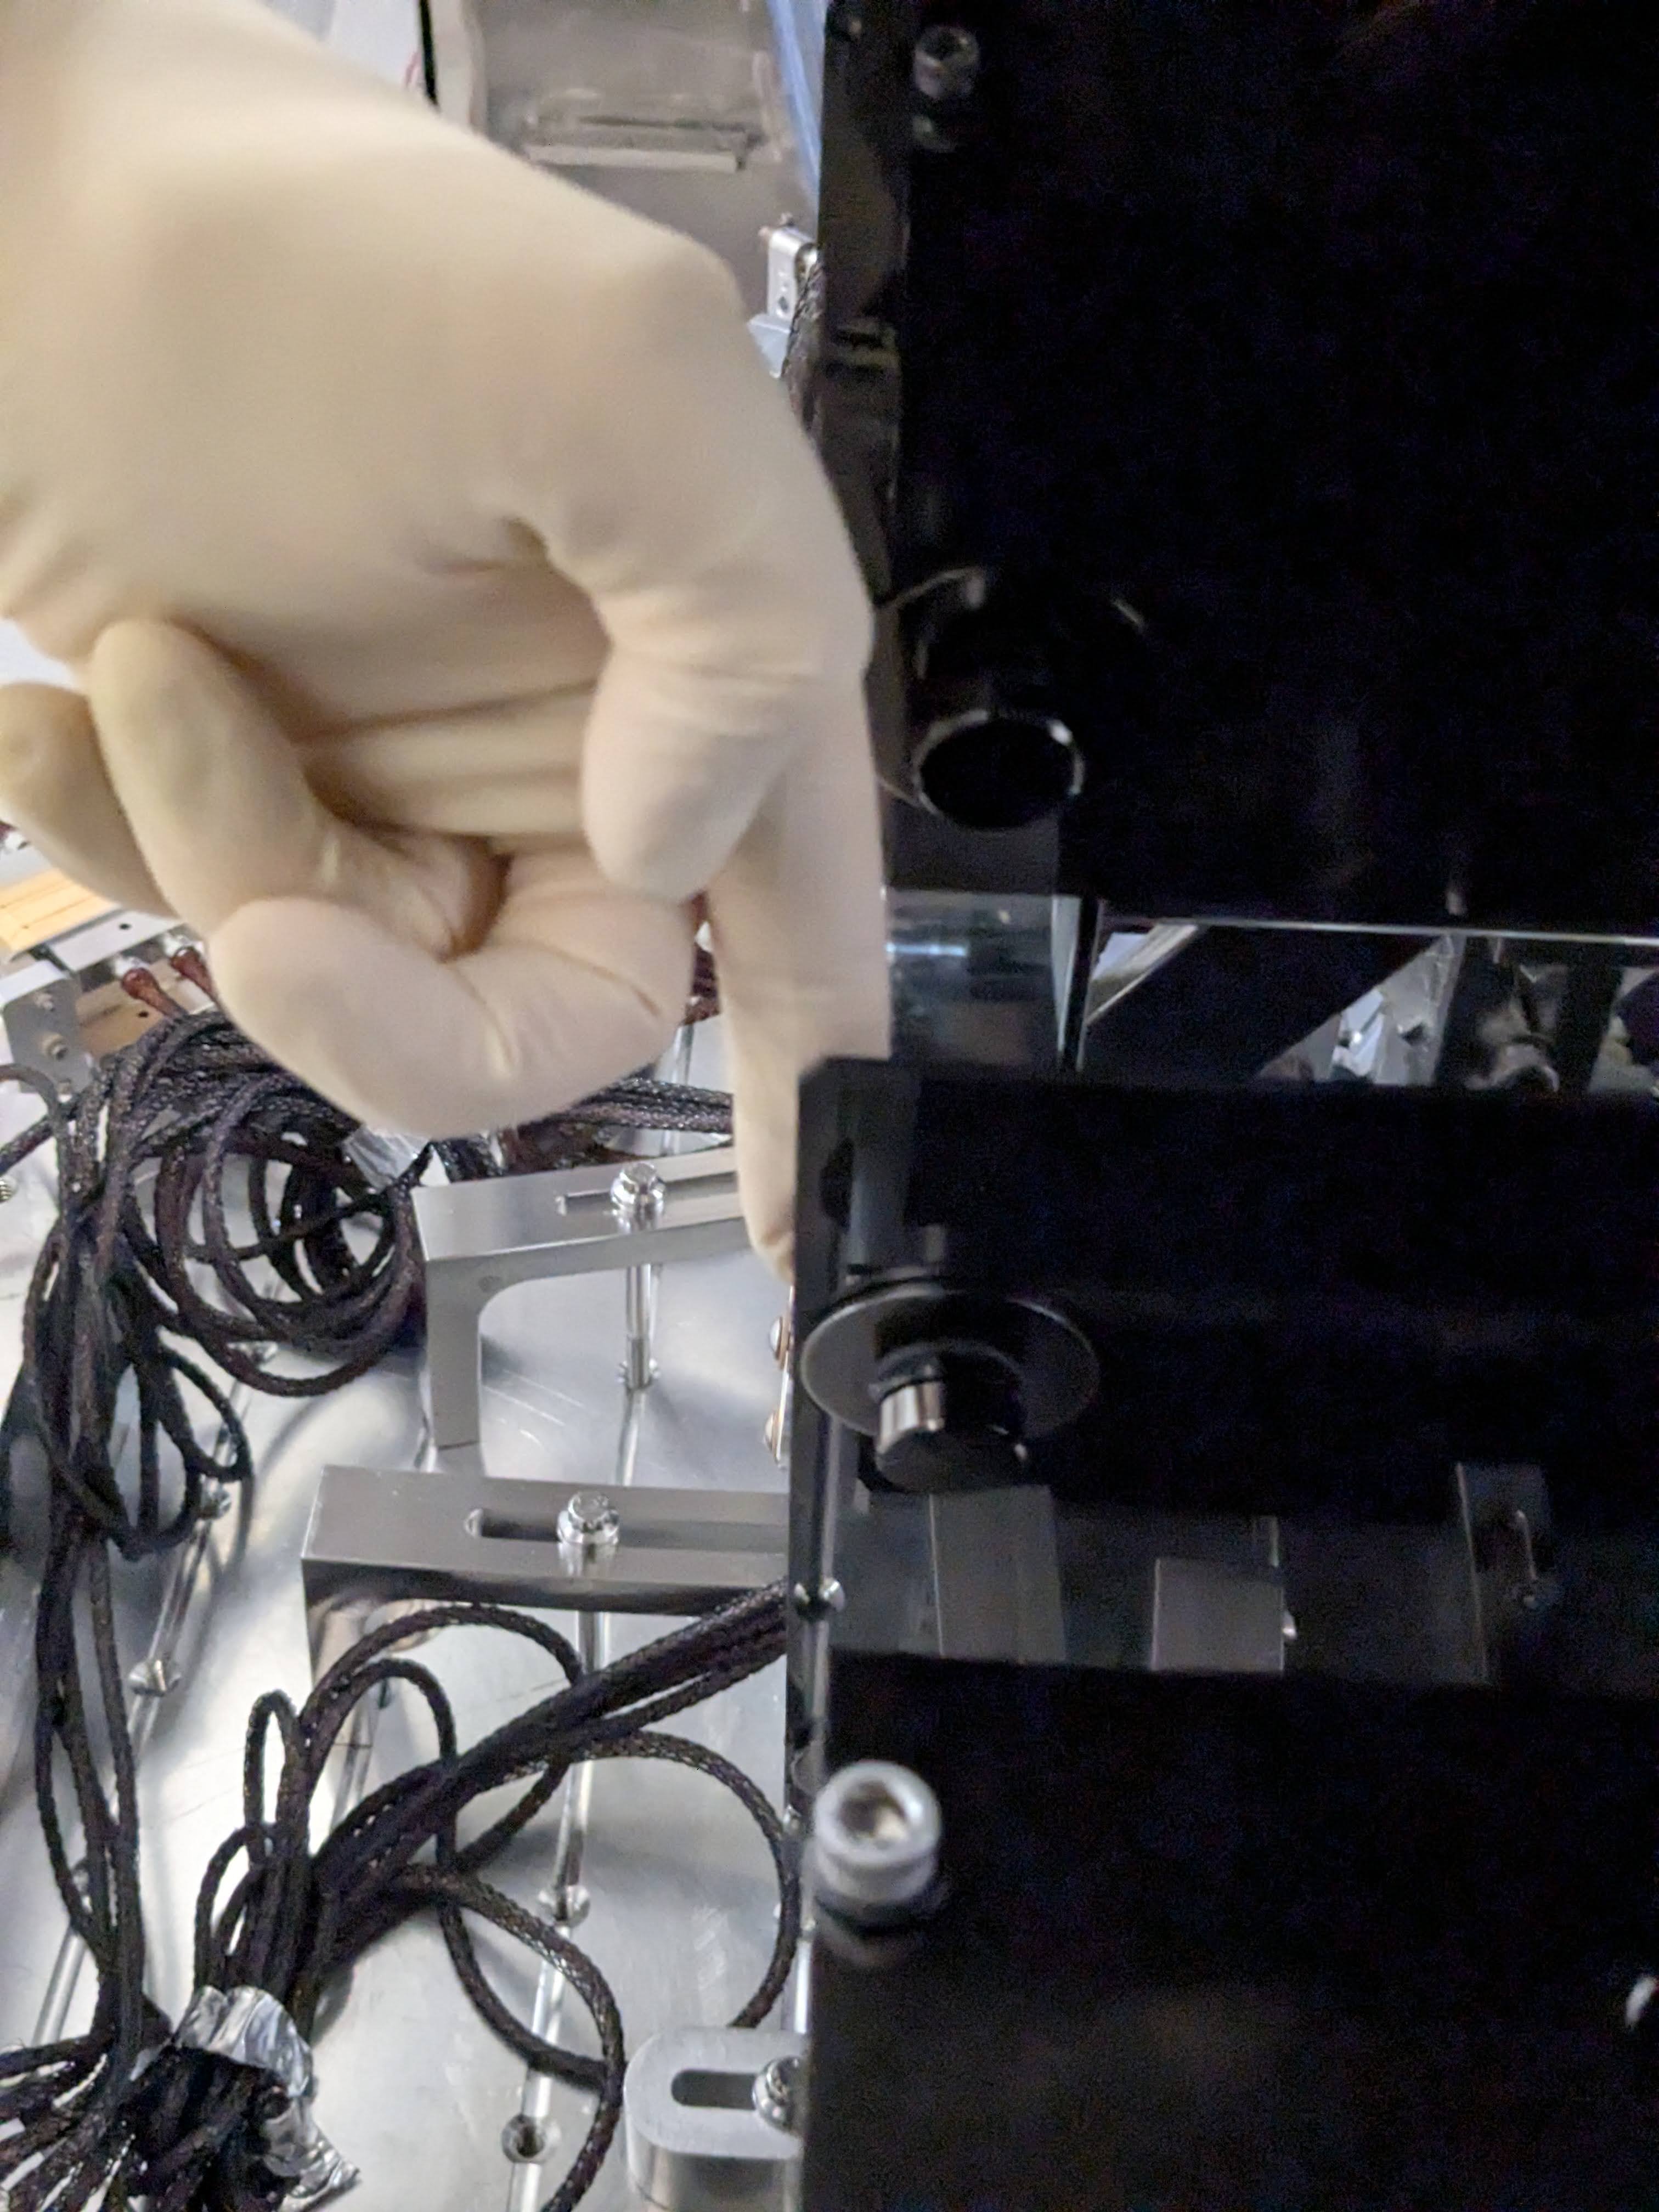
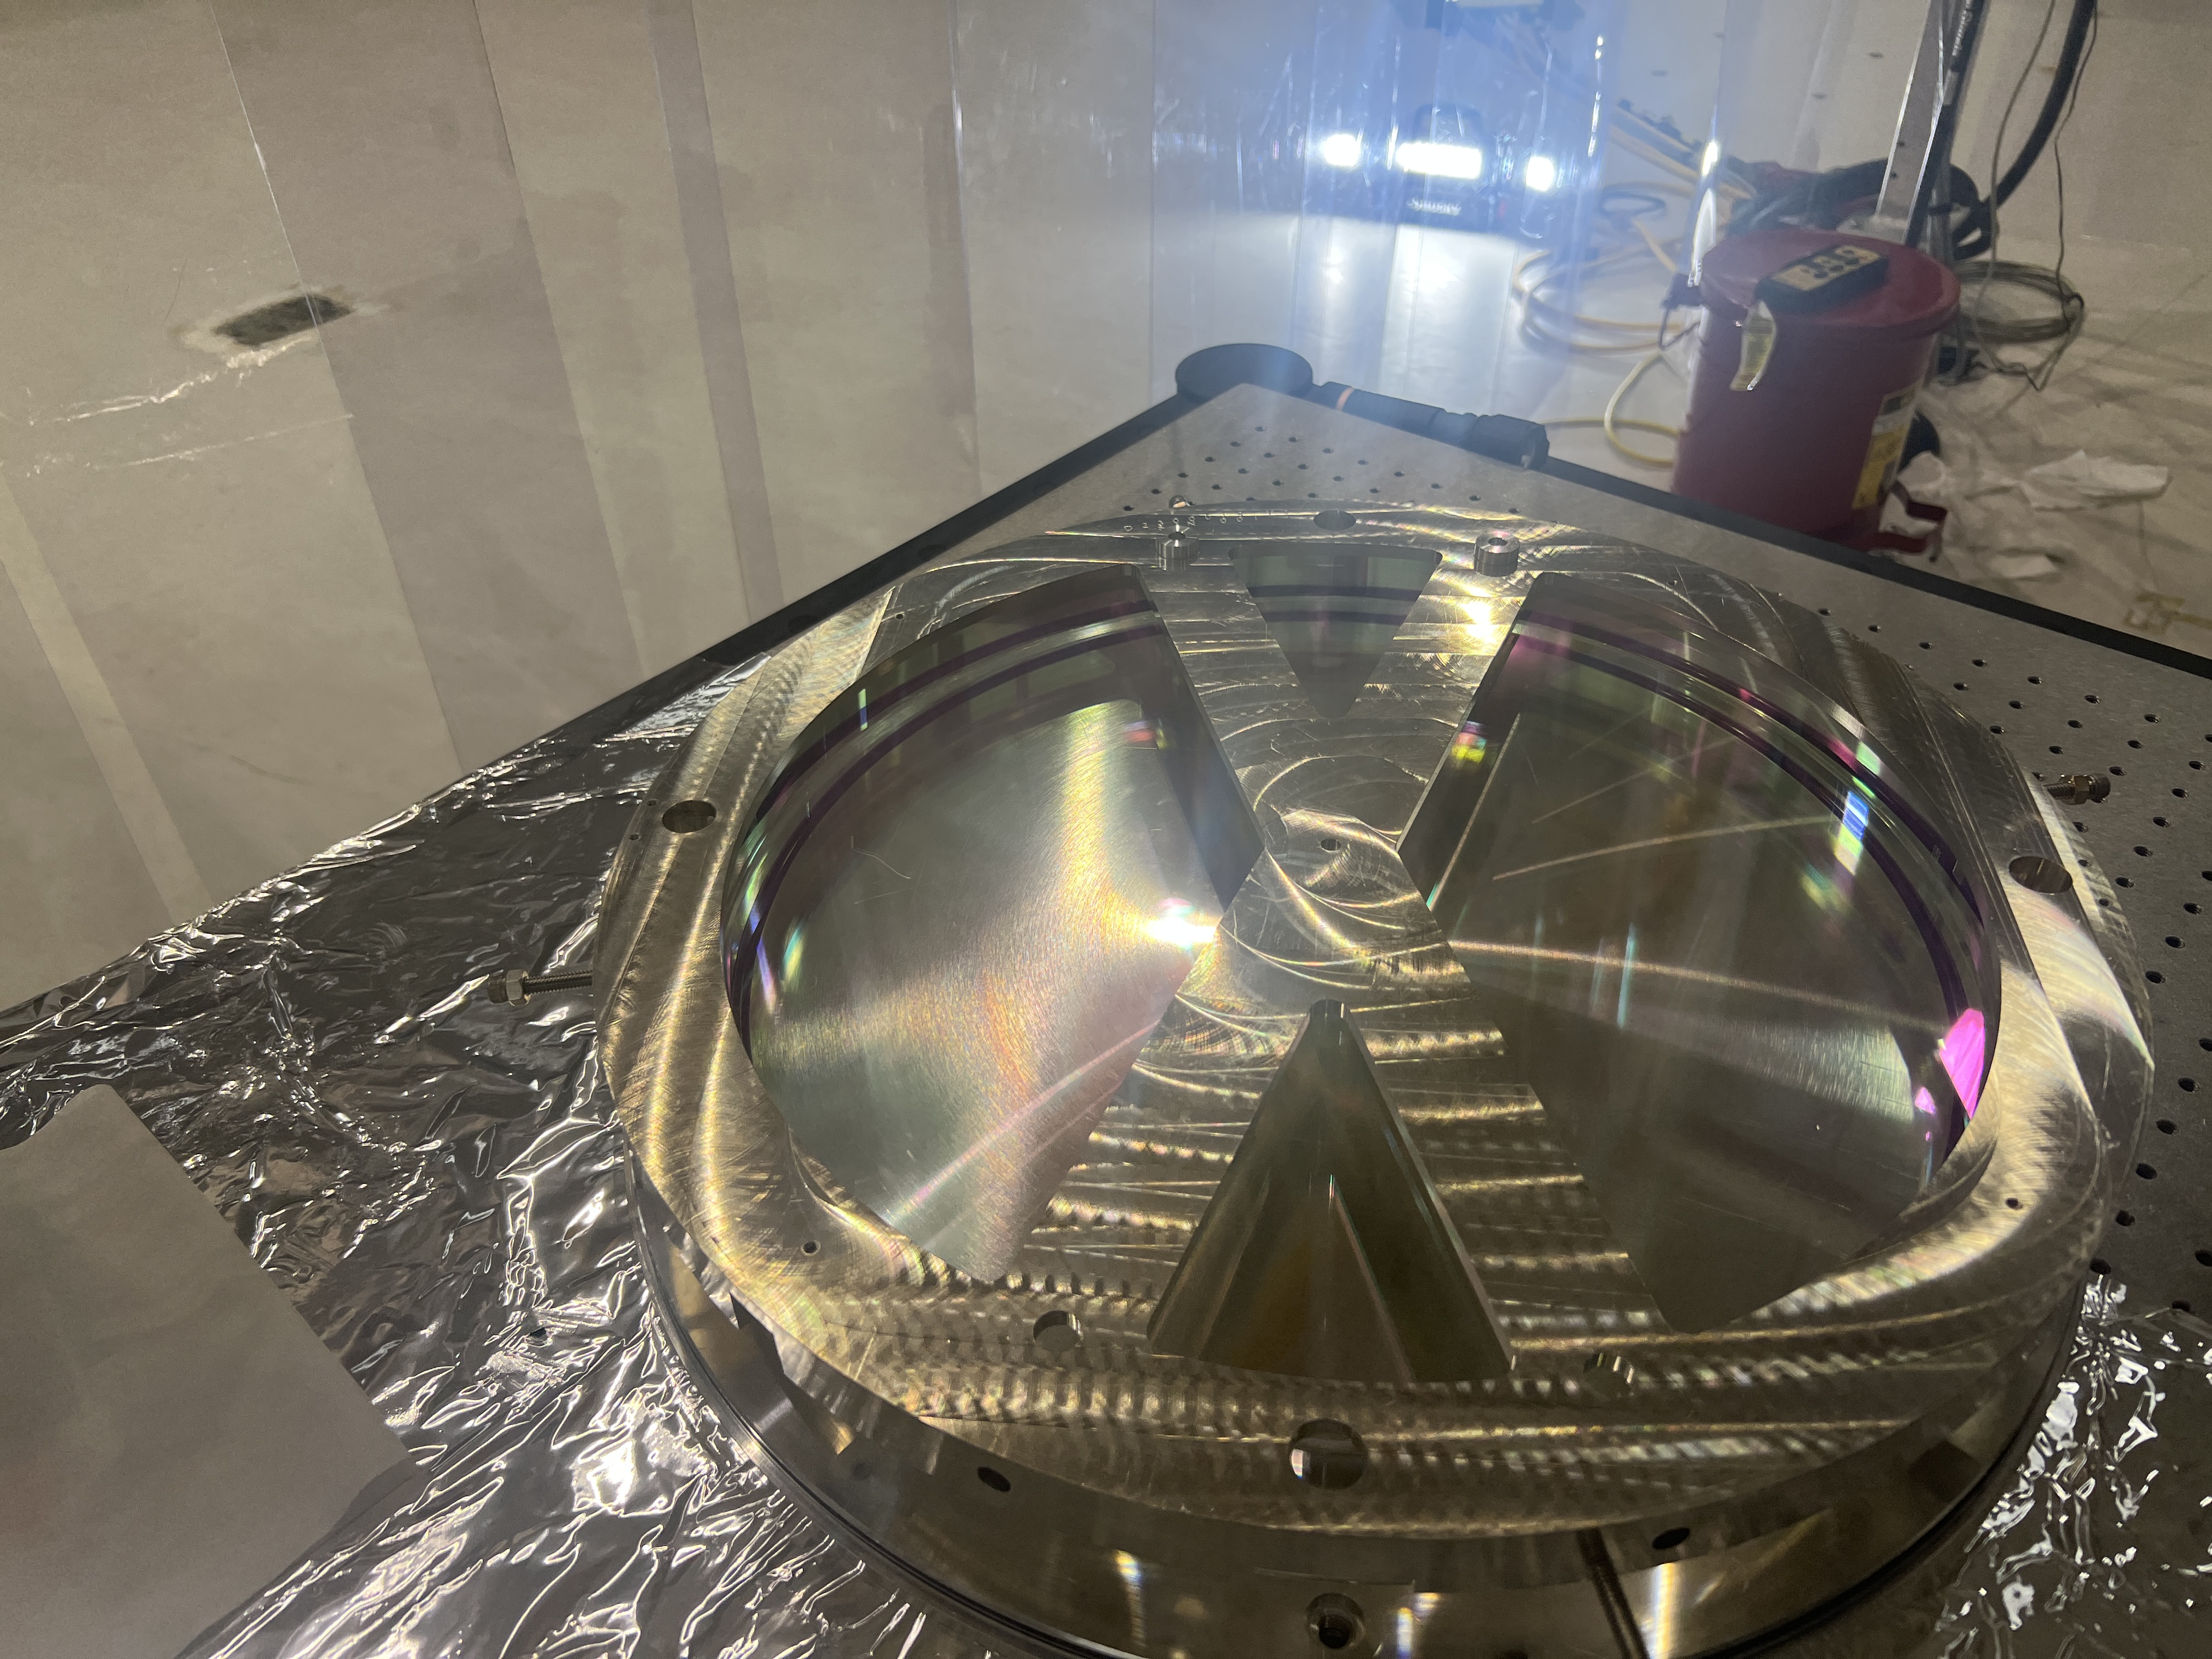
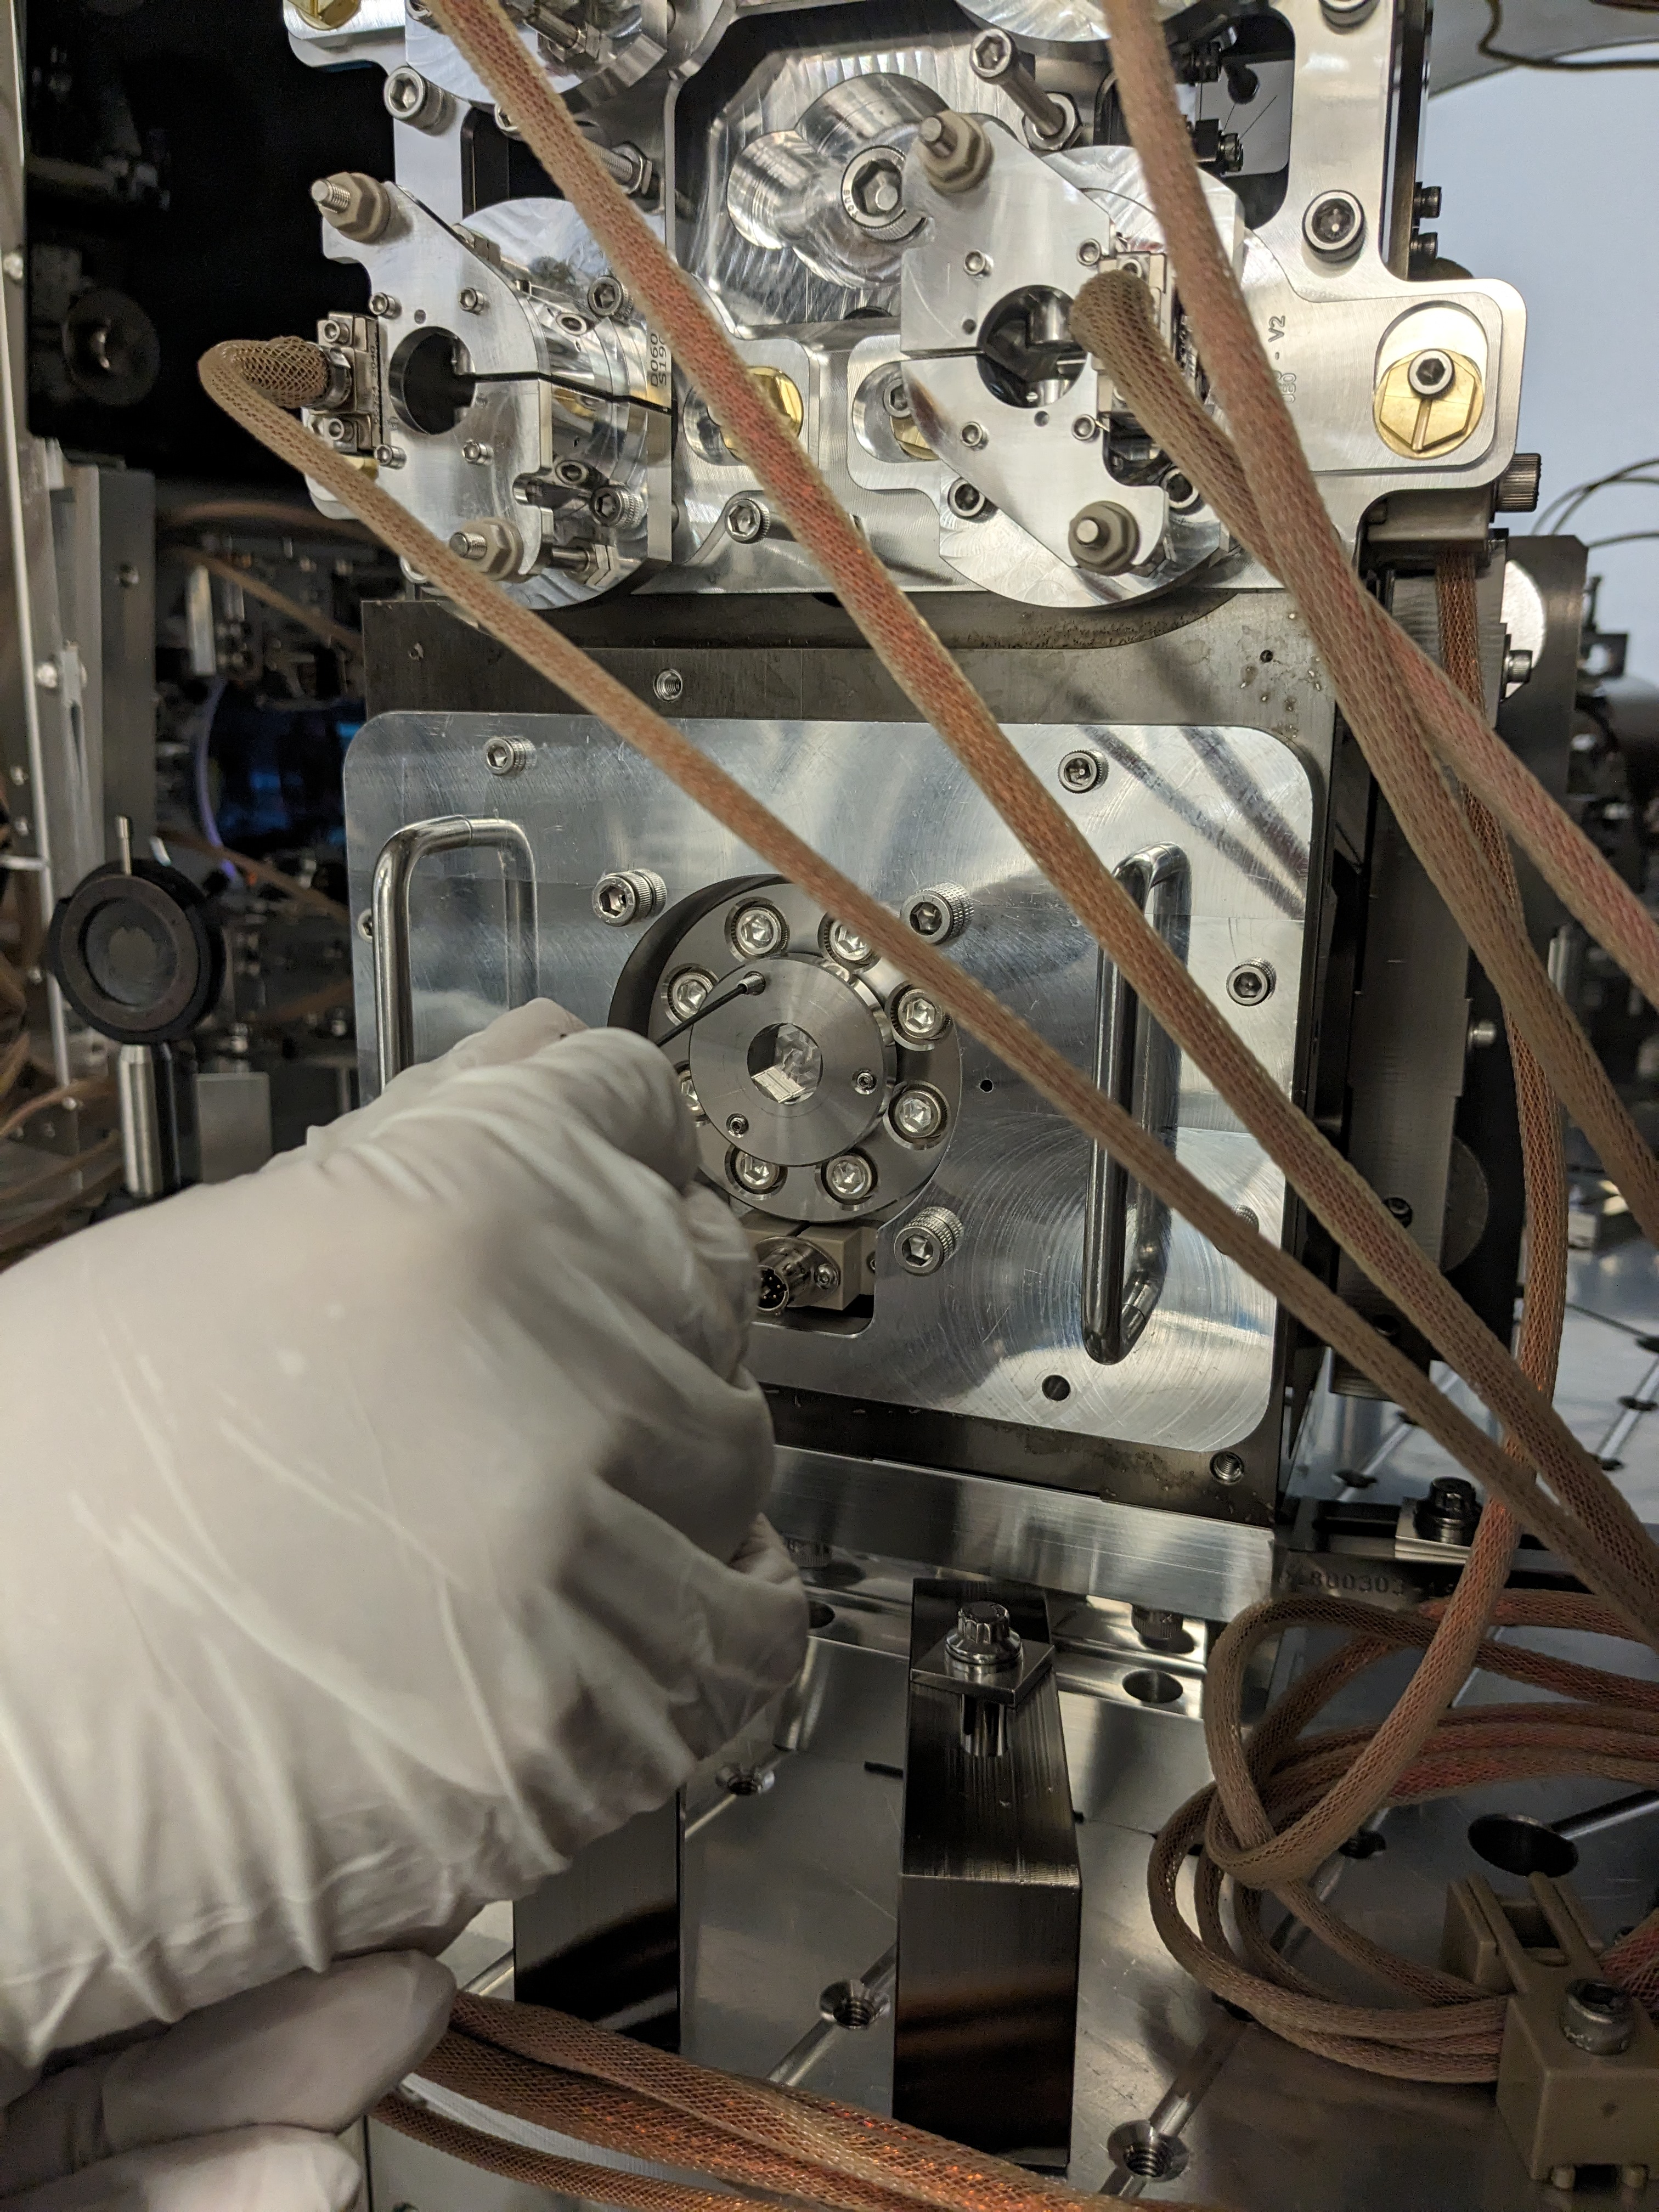
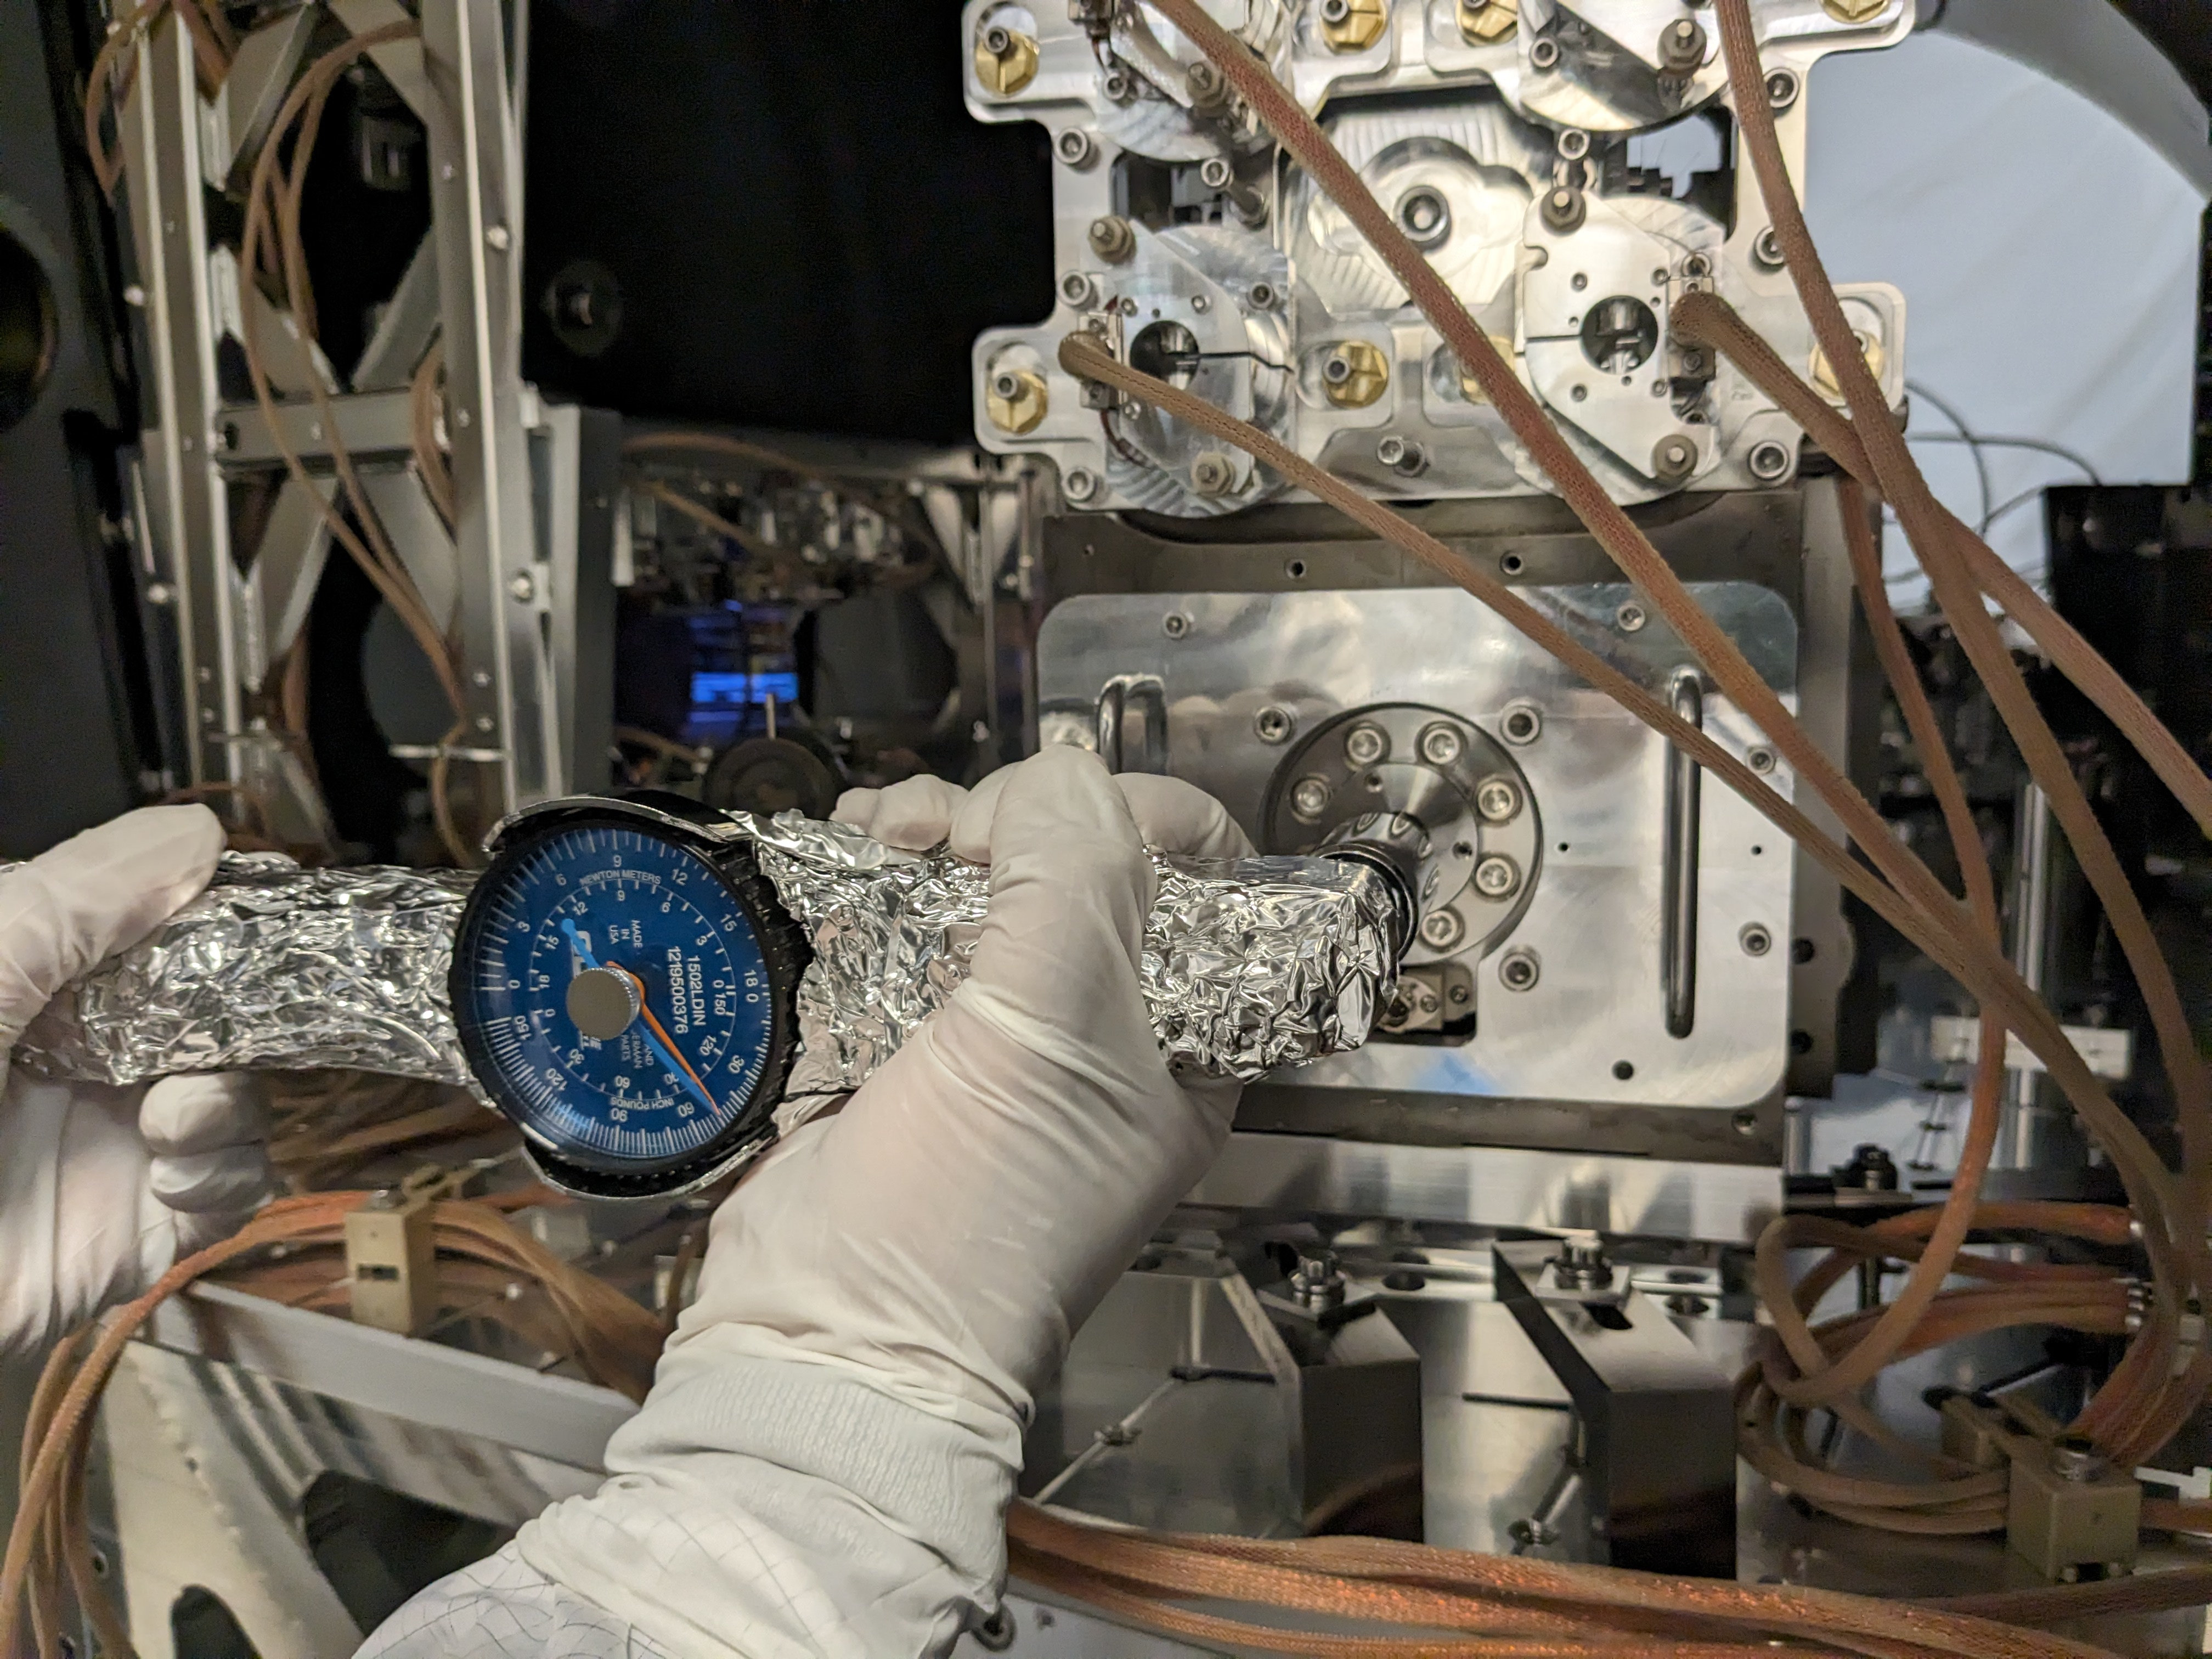
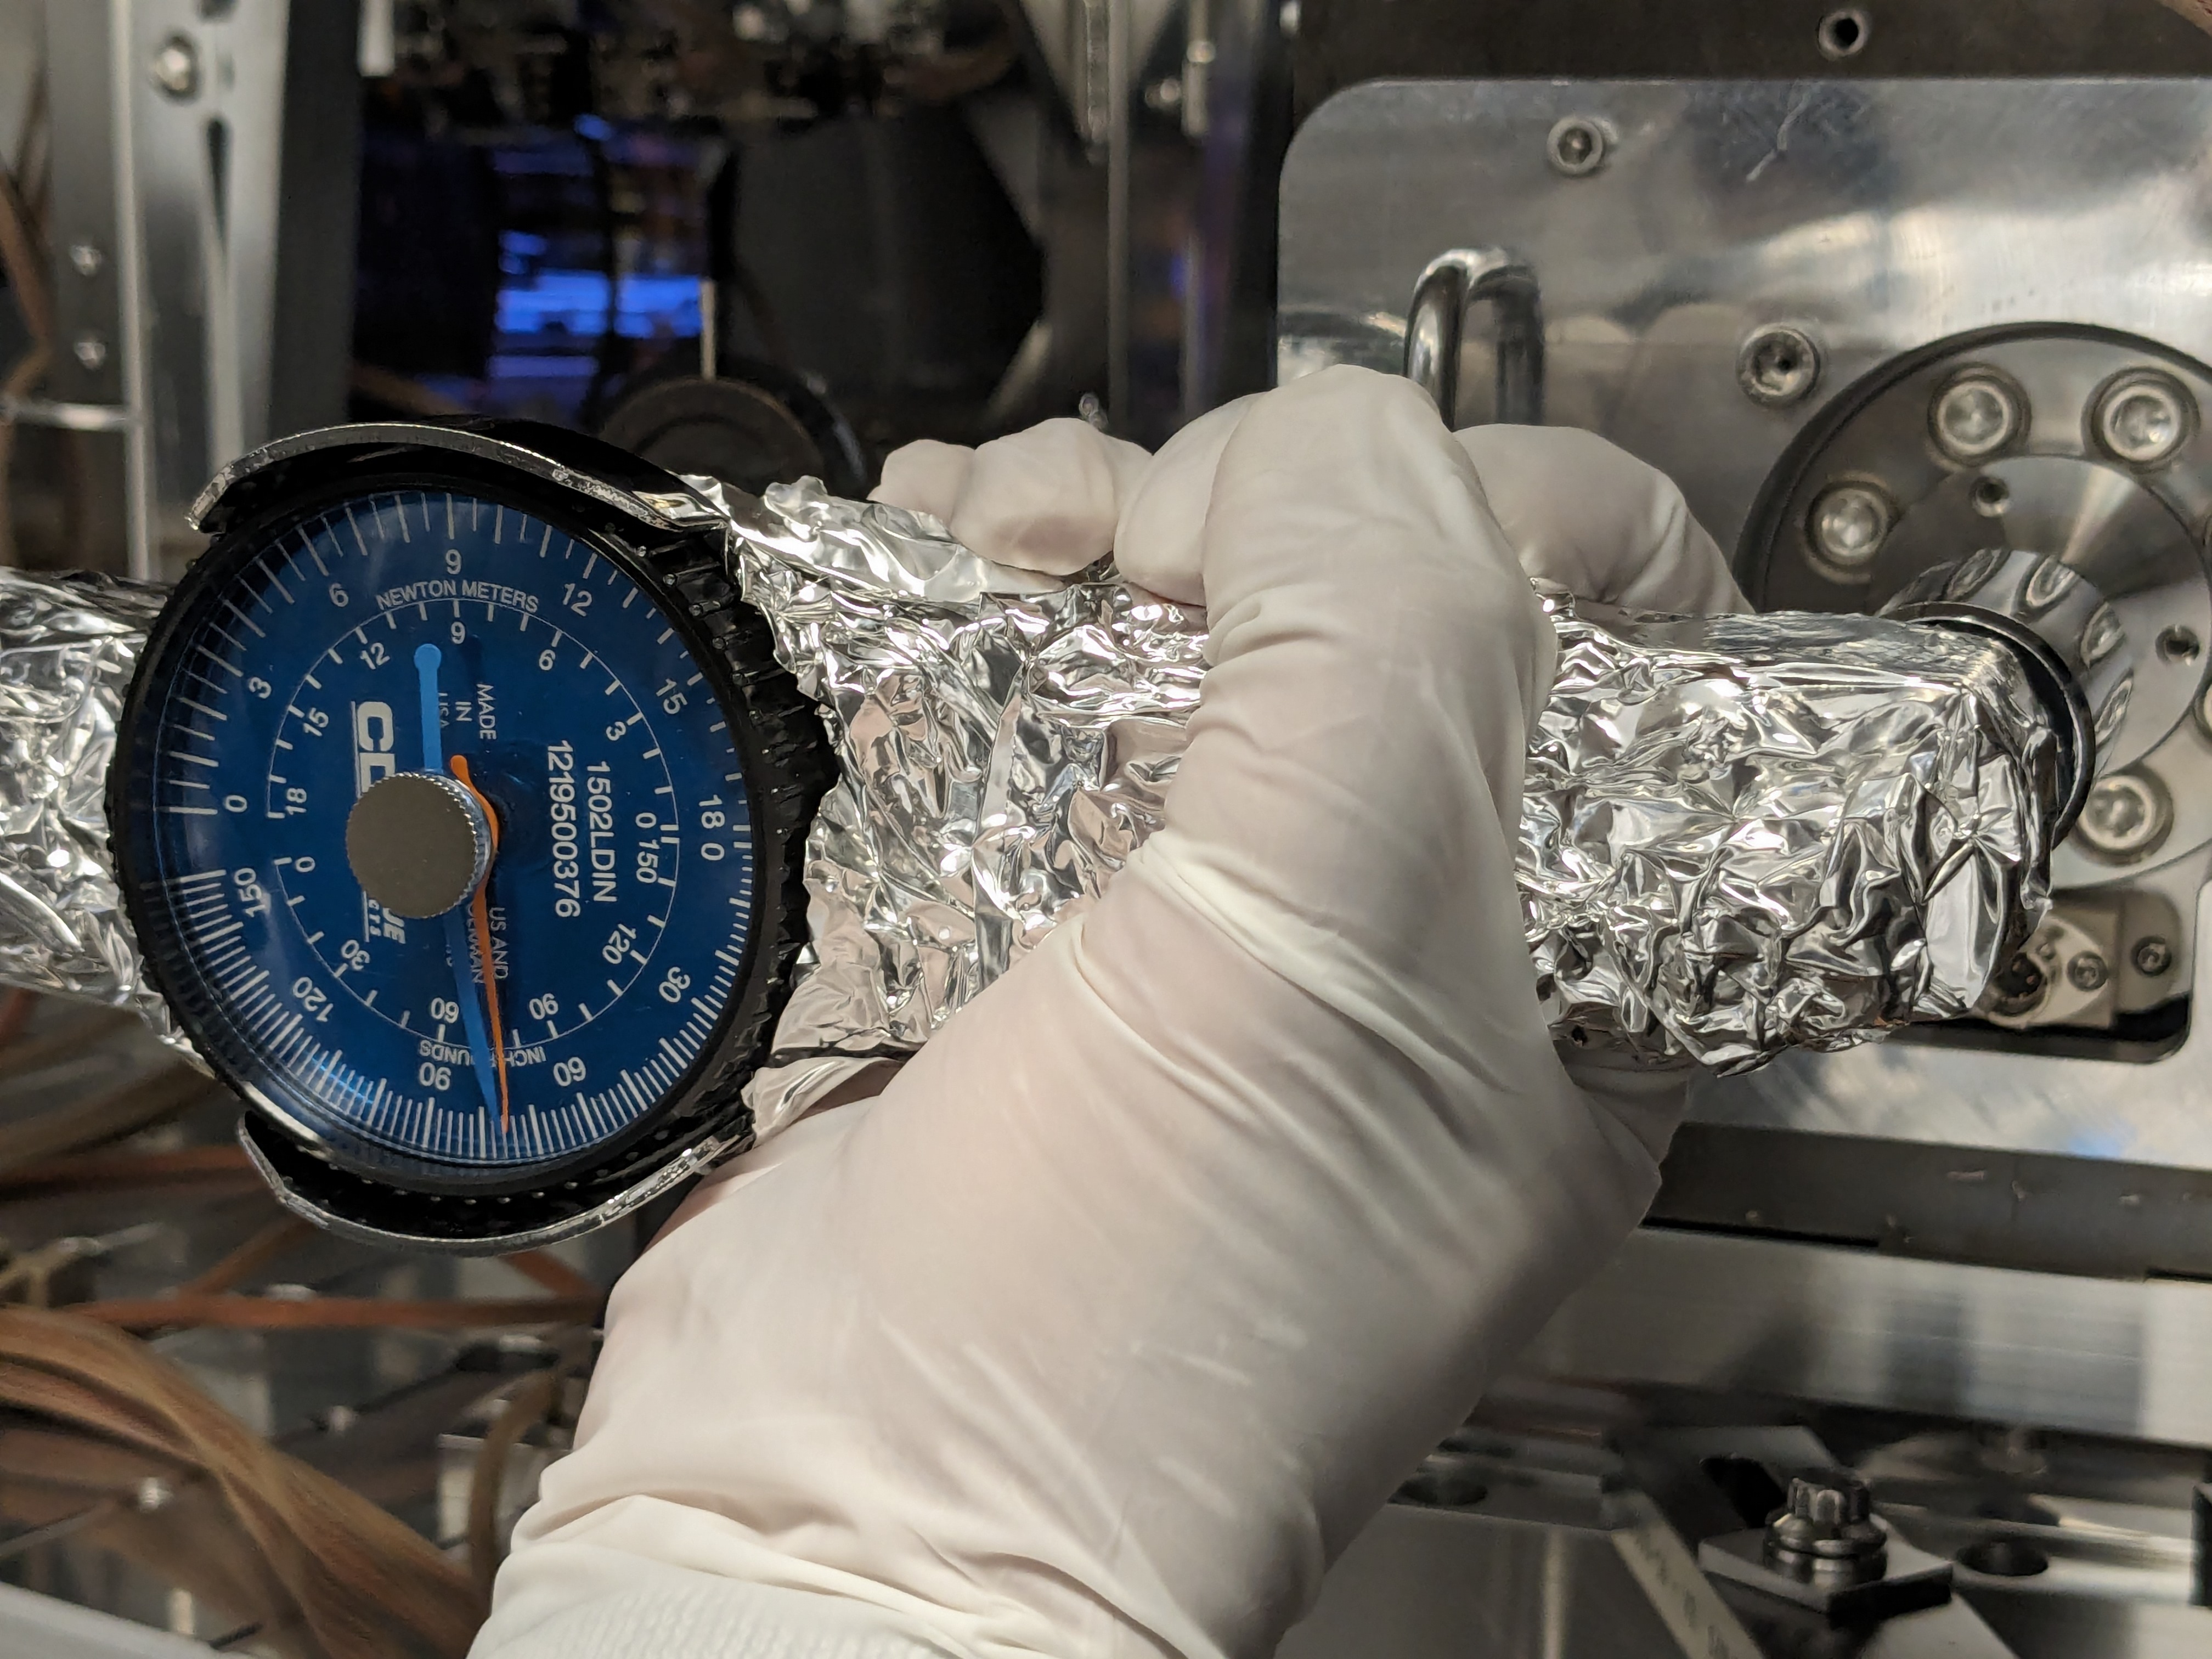
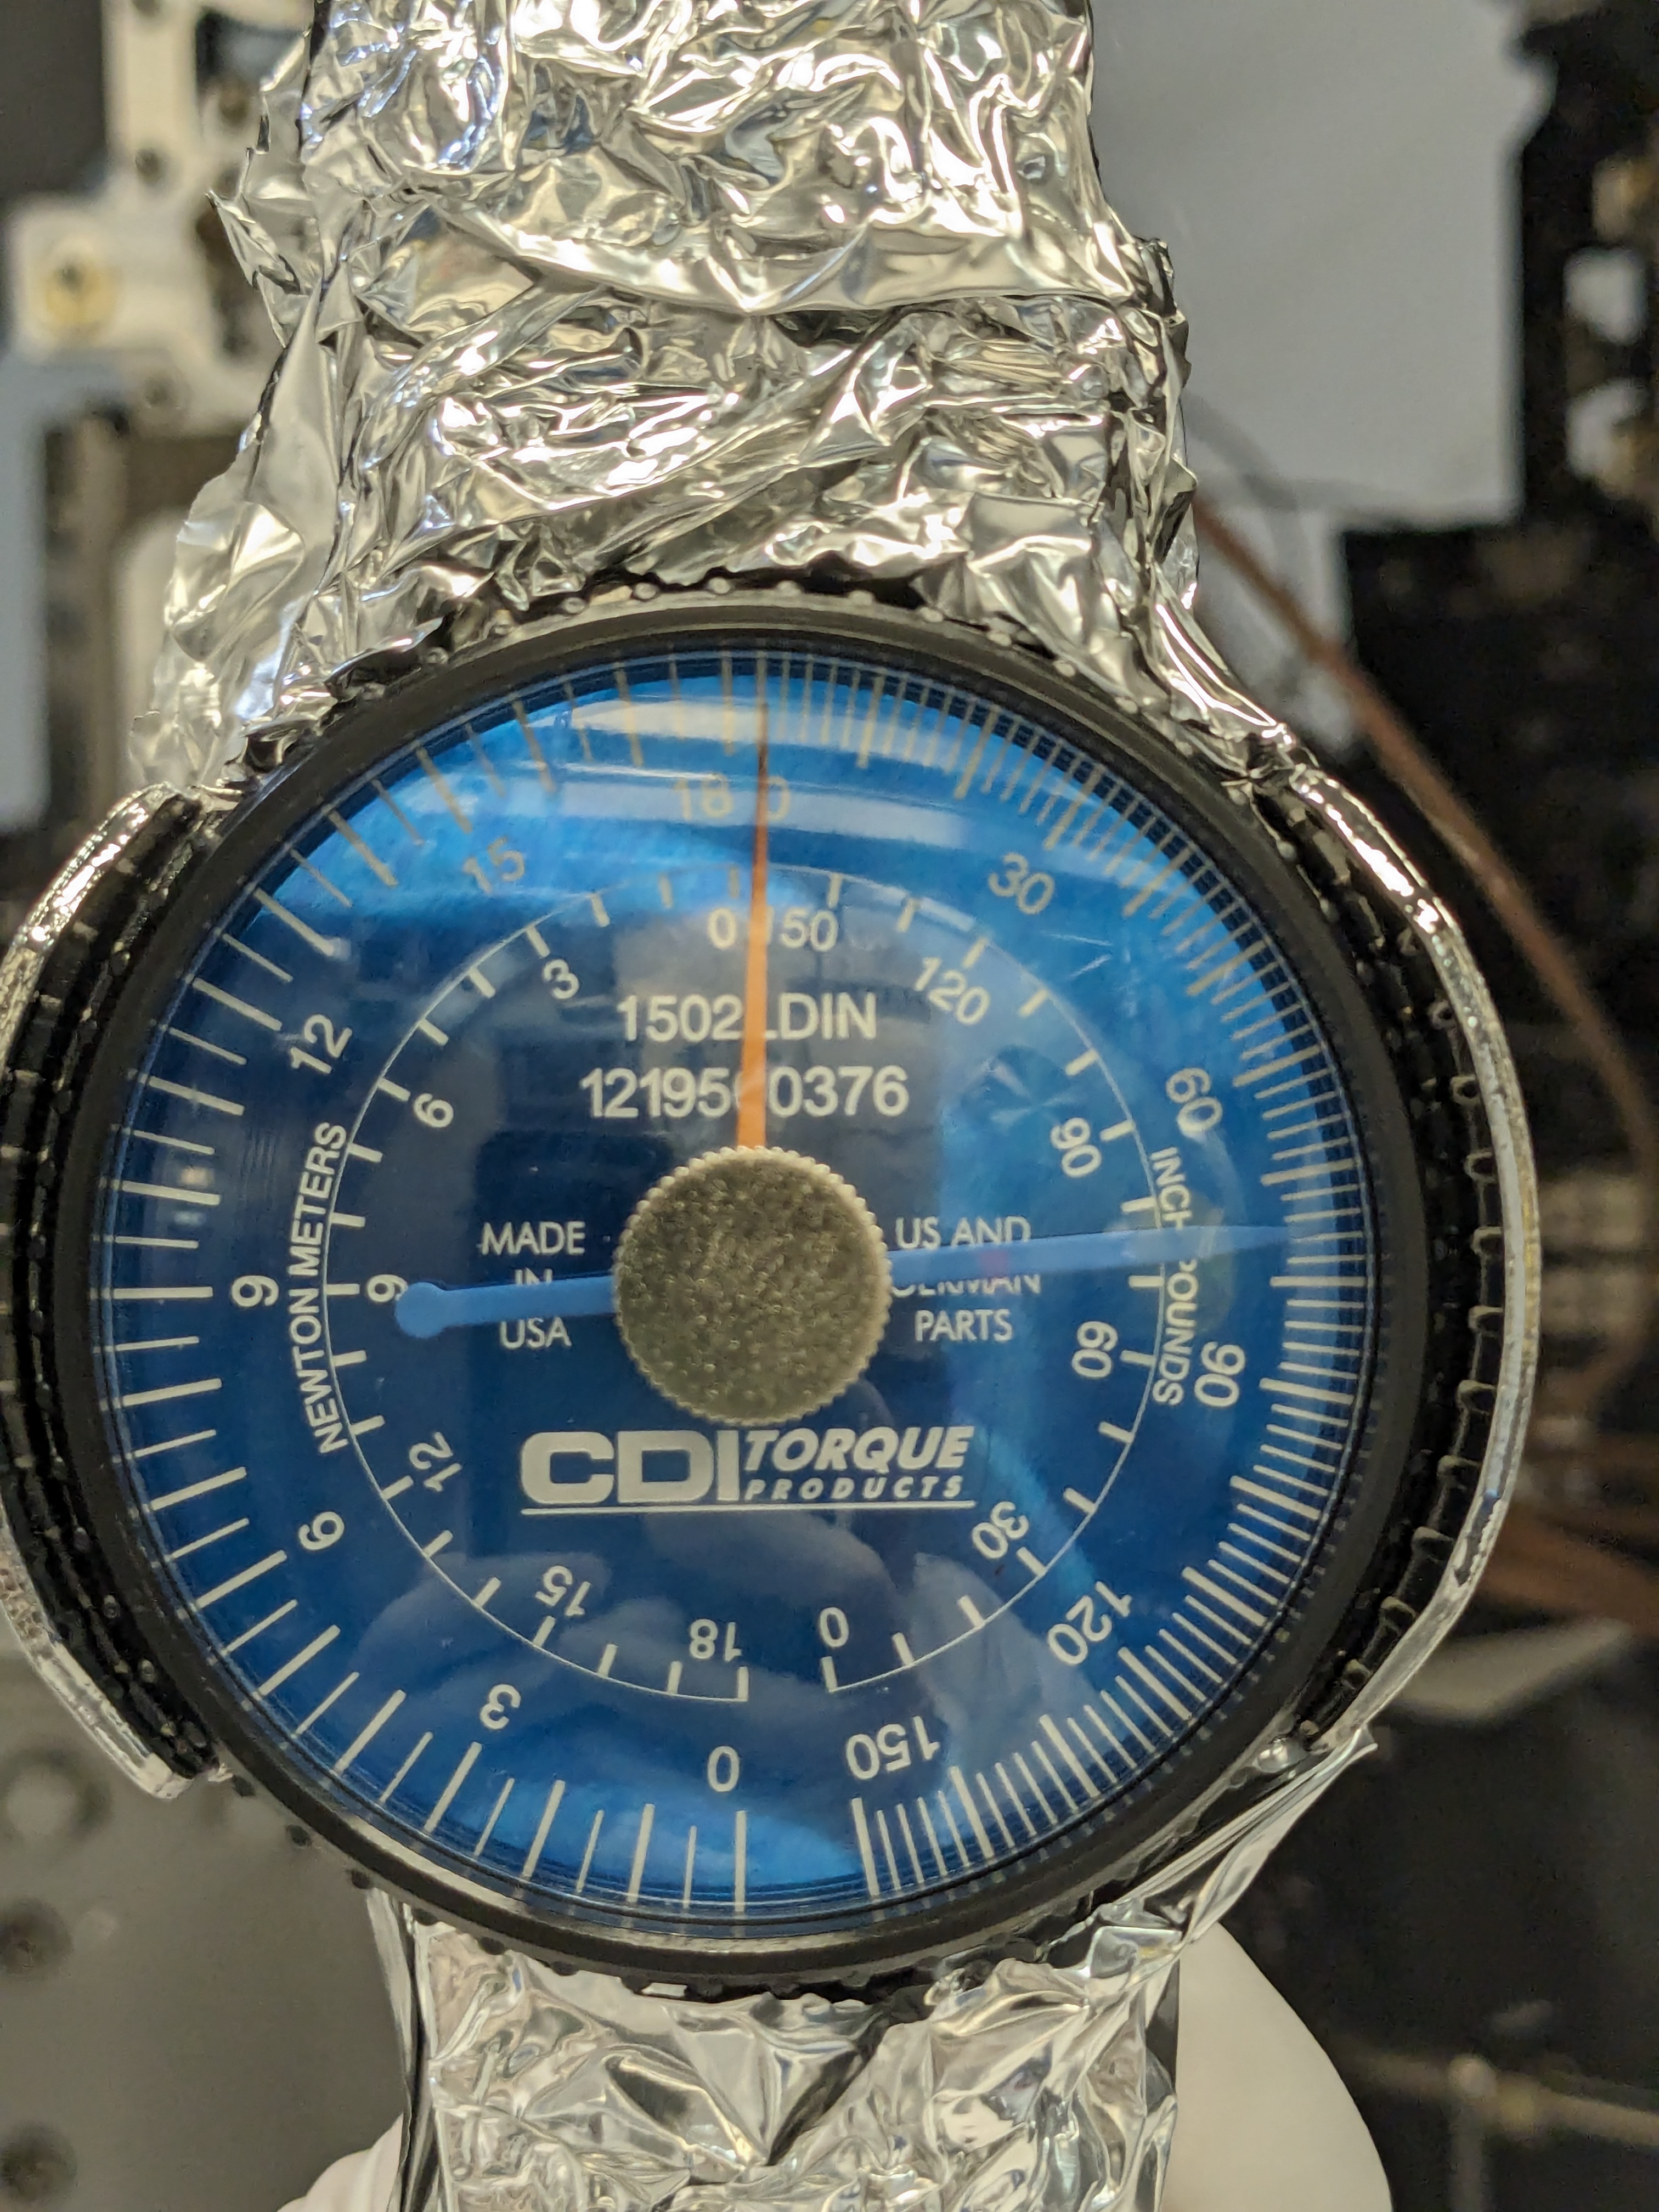
This morning we started moving parts into the lvea to start doing CRS assembly in the H2 PSL enclosure. We should have parts for 2 complete sensors right now (minus HOQIs), and should be getting the remaining parts out of clean and bake soon. We spent a lot of time trying to debug the H2 fans and hvac, but it seems not everything is fully functional yet. HEPA units are running in the anteroom however, which should be enough for us to keep parts clean while we assemble. I put a dust monitor in on a table and took counts, they stayed the in 50-100 range while I was watching. Parts are set on one of the stainless shelving units, we can use the stainless table in the anteroom for assembly for now.
Images attached to this report


