J. Kissel

I've analyzed the reference data taken from 2017-01-03, and re-analyzed the data from 2016-11-12 with updated matlab analysis code that includes the LHO-only bug-fix regarding the gain of the AA/AI filter model (see LHO aLOG 32907). The results are tabulated below.
                                                                           MAP     (68% C.I.)  MAP       (68% C.I.)

 Date                                                  2016-11-12          2016-11-12          2017-01-03
                                                   (former analysis)       (new analysis)       (new analysis)
 Optical Gain                K_C         [ct/m]        1.15e6              1.164e6 (0.09%)     1.086e6   (0.07%)
 Couple Cav. Pole Freq.      f_c         [Hz]          346.7               346.7   (0.4%)      360.4     (0.4%)
 Residual Sensing Delay      tau_C       [us]          2.3                 2.3     (50%)       0.65      (200%)
 SRC Detuning Spring Freq.   f_s         [Hz]          7.4                 7.4     (1.1%)      6.9       (0.5%)
 Inv. Spring Qual. Factor    1/Q_s       [ ]           0.05                0.05    (8.7%)      0.03      (12%)

 UIM/L1 Actuation Strength   K_UIM       [N/ct]        8.164e-8            8.104e-8  (0.2%)    8.091e-8  (0.2%)
 PUM/L2 Actuation Strength   K_PUM       [N/ct]        6.841e-10           6.773e-10 (0.03%)   6.768e-10 (0.02%)
 UIM/L3 Actuation Strength   K_TST       [N/ct]        4.389e-12           4.389e-12 (0.04%)   4.357e-12 (0.02%)


As expected, with the 2016-11-12 reference measurements re-analyzed, the estimated sensing function gain has increased by ~1%, and the actuation function have decreased by a few %.

Further, we see that -- also as expected -- the 2017-01-04 reference measurements show some evolution of the optical sensing parameters, no evolution of the UIM and PUM stage actuation strengths, and a few % change in TST actuation strength change due to charge evolution.

The steps forward from here:
- Convert the actuation strength in [N/ct] to [N/A] or [N/V^2] so we can create an updated reference parameter set for the DARM loop model
- Compare the new open loop gain model against measurements
- Use the loop model tp push new reference values to the front end CAL-CS model (changing the optical plant compensation, and the gain of the actuator compensation, L2/L3 change has already been pushed)
- Use the loop model to push new EPICs records that document model values at calibration line frequencies (the biggest change will be from the L2/L3 cross-over upgrade)   << this is the major problem that's causing bad h(t) calibration flag
- Use the new loop model to push a new set of GDS FIR correction filters (small changes due to better AA/AI model)
- Confirm that time-dependent correction factors are within an expected range  << if/when in range, this should green light the h(t) calibration flag
- Use the new loop model to generate DCS FIR filters to recalibrate the all data from the post-winter break from raw DARM_ERR and DARM_CTRL.
- Push hard for uncertainty estimations for both the first part of O2 and data post-winter break.

There's a ton of librarian information that I need to post that documents where all this data came from and what scripts were used, but I'll post as a comment later today.
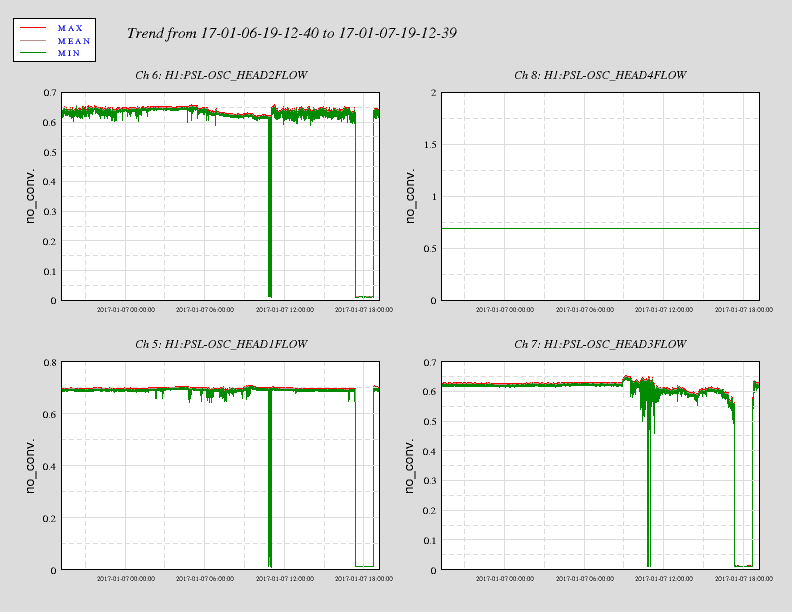
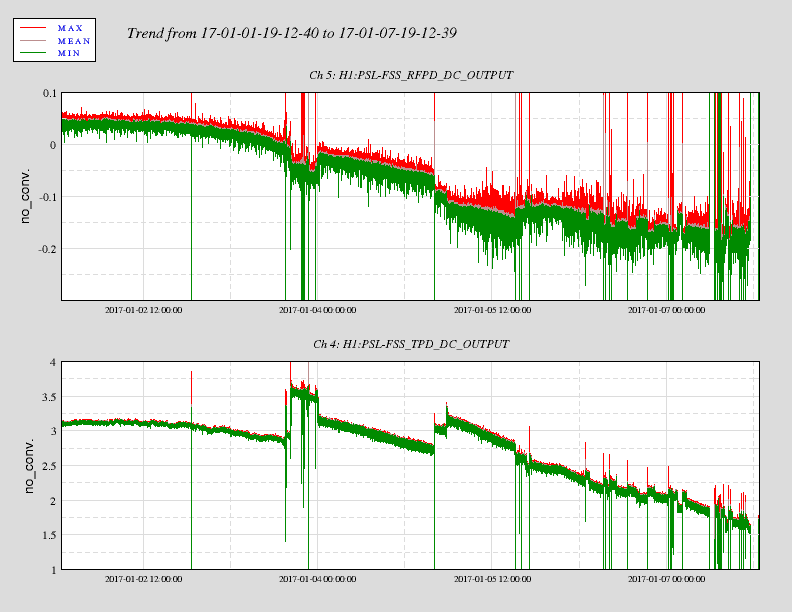

Looking at Terramon and the ground blrms, looks like there was an earthquake near 9:00 UTC, which the interferometer rode through.