J. Kissel
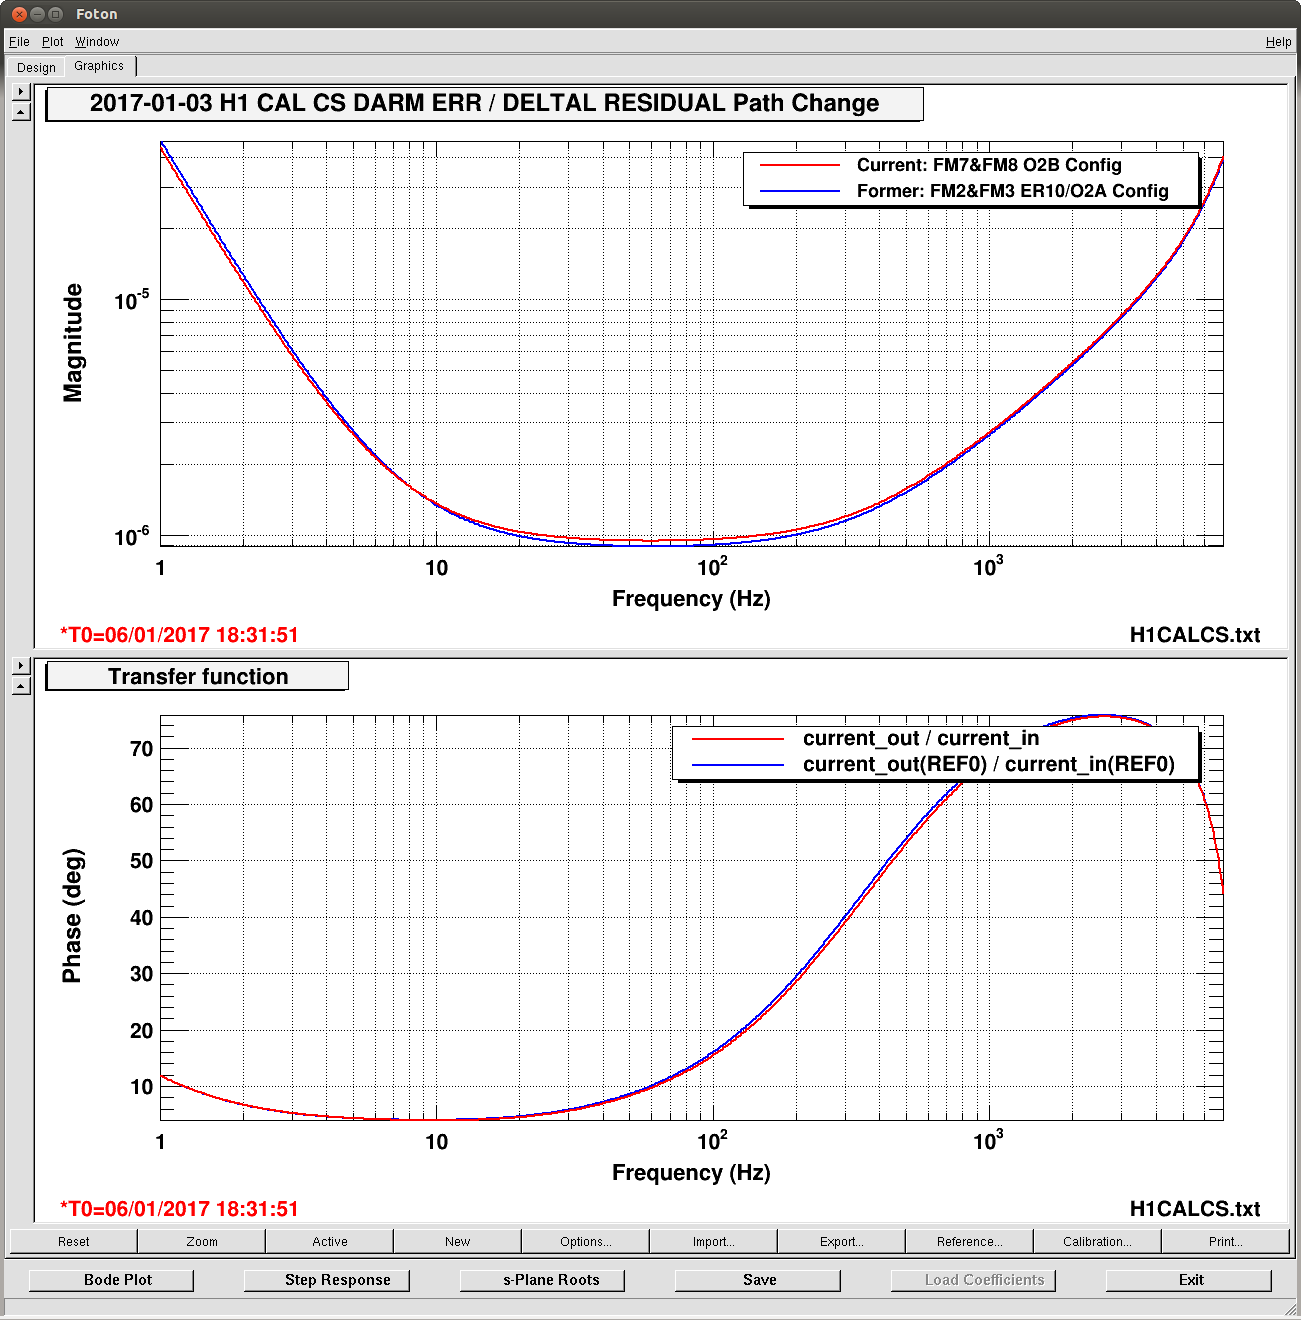
I've completed creating a new parameter set for the matlab DARM loop model that contains the updates from the fit of the new set of reference measurements taken on 2017-01-03. I've then compared those measurements directly to the new model with an update to the function
/ligo/svncommon/CalSVN/aligocalibration/trunk/Runs/O2/H1/Scripts/compareDARMOLGTFs.m
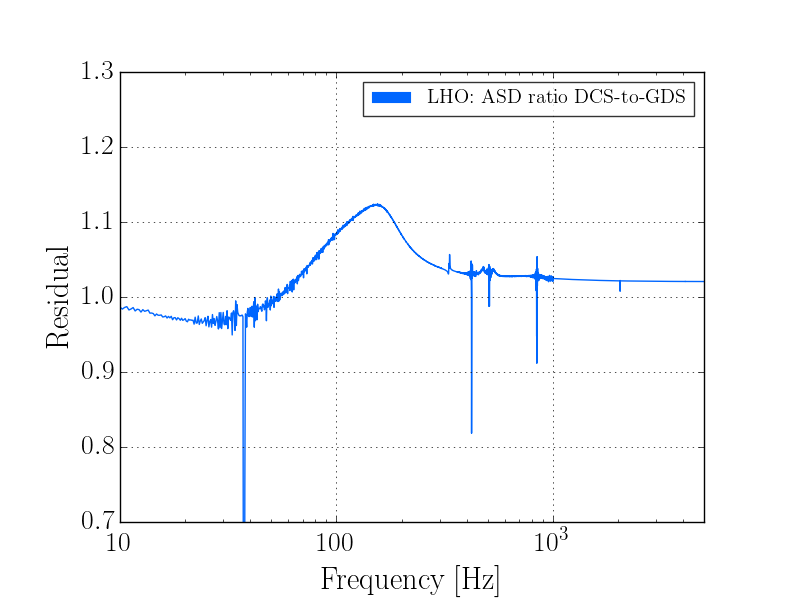
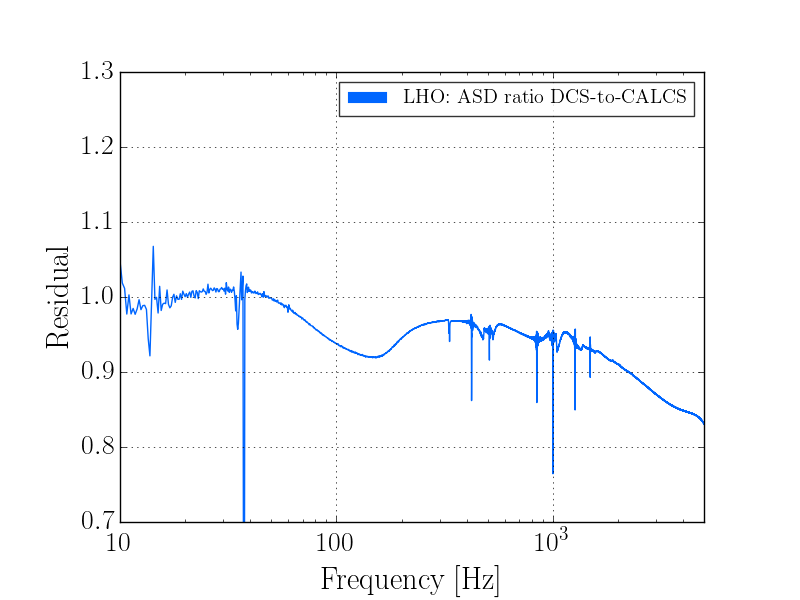
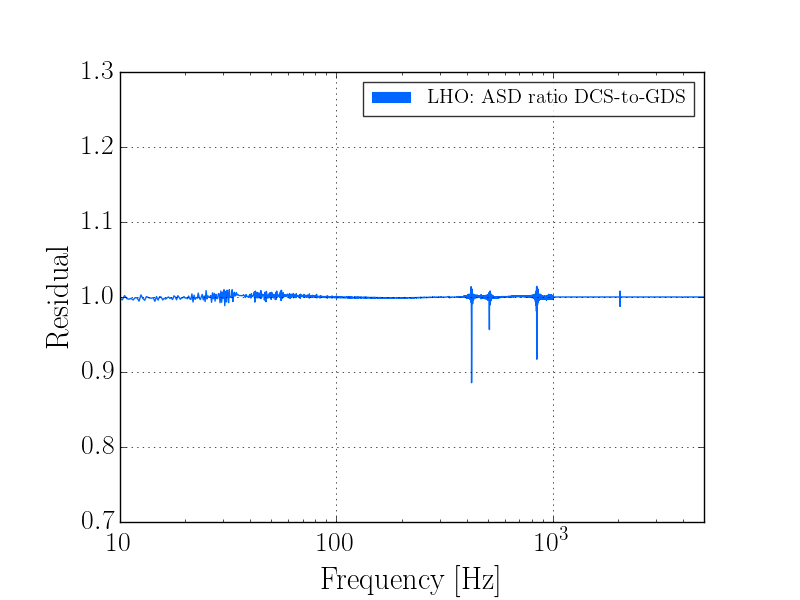
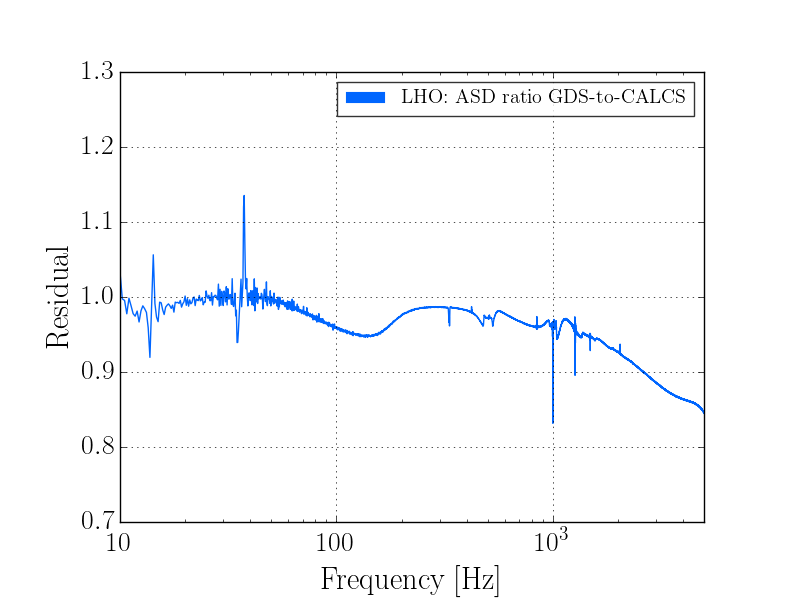
Results are attached. The agreement is quite good, but I expected better. Further discussion below, but I must continue with the facts first.
I also re-attach sensing function fit results, with spruced up information and residuals for the MCMC results, and tabulated below:
Reference Value MAP (95% C.I.) MAP (95% C.I.)
2016-11-12 2017-01-03 (nlinfit) 2017-01-03 (MCMC)
Optical Gain K_C [ct/m] 1.15e6 1.088e6 (0.0002e6) 1.086e6 (0.0002e6)
Couple Cav. Pole Freq. f_c [Hz] 346.7 360.0 (7.6) 360.4 (3.4)
Residual Sensing Delay tau_C [us] 2.3 0.67 (6.7) 0.65 (2.6)
SRC Detuning Spring Freq. f_s [Hz] 7.4 6.91 (0.1) 6.9 (0.06)
Inv. Spring Qual. Factor 1/Q_s [ ] 0.05 0.046 (0.016) 0.03 (0.0081)
UIM/L1 Actuation Strength K_UIM [N/ct] 8.164e-8 n/a 8.091e-8 (0.2%)
PUM/L2 Actuation Strength K_PUM [N/ct] 6.841e-10 n/a 6.768e-10 (0.02%)
UIM/L3 Actuation Strength K_TST [N/ct] 4.389e-12 n/a 4.357e-12 (0.02%)
Upsettingly, with this comparison and revisit of the fitting codes, I've discovered that neither the nlinfit fitting function or the mcmc fitting function pre-filters the measurement data for coherence. I suspect that the highest two data points in the DARM OLG TF measurement, which "only" have coherence on 0.97 and 0.99, and hence large uncertainty, are skewing both fitting functions. This is why the coupled cavity pole frequency is fit to be rather high at 360.4 (-3.03,+3.39) [Hz] (MCMC) and 360.0 (+/- 7.9) [Hz] (nlinfit).
If I manually manipulate the model to have a cavity pole frequency of 350 [Hz], the agreement with measurement is better. However, this stone method of determining physical parameters from eye-balling model residuals is flawed in that it has no inherent quantitative uncertainty.
I spent too much time trying to decide what to do about this, so I have not yet pushed this model (or associated EPICs records) to the front end. And yes, the means the h(t) OK light will not turn green for another night. Updating the calibration is something I'd like to do after a good night's sleep, given I'm the only one working on this and I don't want to mess it up (I've been known to do it before). Perhaps others in the calibration group will have epiphanies over night that may help in the morning as well.
For the time being, I've committed the model parameters and functions. Hopefully all relevant information to begin generating DCS filters is present. Every folder listed below should be updated before proceeding to make anything.
(r = svn revision, lc = last changed revision)
Model Functions:
/ligo/svncommon/CalSVN/aligocalibration/trunk/Runs/
O2/DARMmodel/src/
DARMmodel.m (r3857, lc: r3511)
computeSensing.m (r4040, lc: r4025)
computeActuation.m (r4040, lc: r4003)
Param Files:
/ligo/svncommon/CalSVN/aligocalibration/trunk/Runs/
O2/H1/params/
H1params.conf (r4087, lc: r4087)
O2/H1/params/2017-01-03/
H1params_2017-01-03.conf (r4054, lc: r4044)
measurements_2017-01-03_sensing.conf (r4089, lc: r4089)
measurements_2017-01-03_ETMY_L3_actuator.conf (r4054, lc: r4044)
measurements_2017-01-03_ETMY_L2_actuator.conf (r4054, lc: r4044)
measurements_2017-01-03_ETMY_L1_actuator.conf (r4054, lc: r4044)
Relevant Exports for GDS / DCS filter generation:
/ligo/svncommon/CalSVN/aligocalibration/trunk/Runs/
O2/H1/Measurements/Foton/
2017-01-03_H1CALCS_InverseSensingFunction_Foton_SRCD-2N_and_Gain_Filters_tf.txt (r4083, lc: rev 4083)
Let the record show that I used the most probable values from the nlinfit function values listed above when filling out the sensing function in H1params.conf.
I've done so because
(a) the nlinfit and mcmc results are consistently within the nlinfit's uncertainty.
(b) the nlinfit code produces a foton design string that can be copied directly into a new filter bank
(b) is an essential feature, because the GDS and DCS pipelines need to compensate for the high-frequency warping of the inverse sensing function response. Indeed that's the "relevant export" which was generated in such fashion, with the following design strings:
SRCD2N: zpk([360.0;6.7496;-7.0660],[0.1;0.1;7000],1,"n")gain(4768.4)
Gain: gain(9.191e-07)
(see LHO aLOG 31693 for why the design of the detuning spring frequency doesn't exactly look right.)
I still owe a long aLOG that details all the functions and processes I've gone through to get this far, I know.
Where does this put us on the road map from LHO aLOG 32989?
The steps forward from here:
DONE - Convert the actuation strength in [N/ct] to [N/A] or [N/V^2] so we can create an updated reference parameter set for the DARM loop model
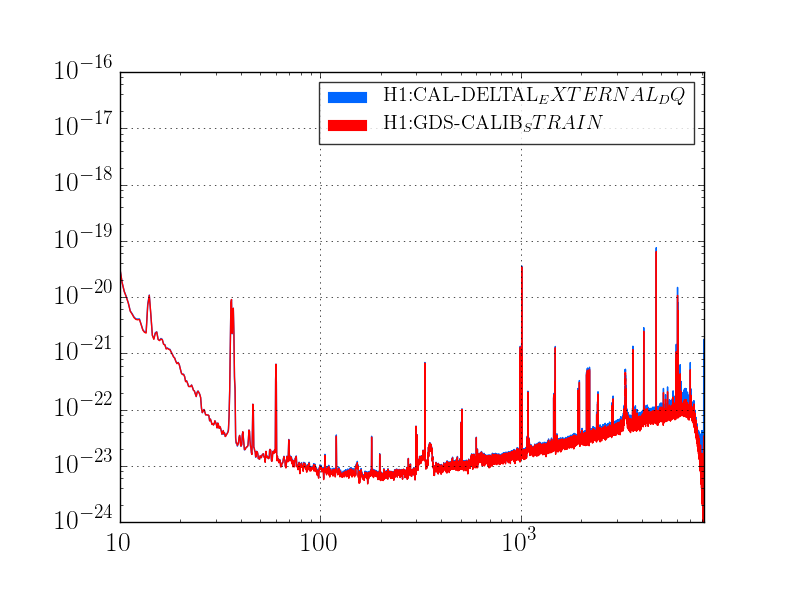
DONE - Compare the new open loop gain model against measurements
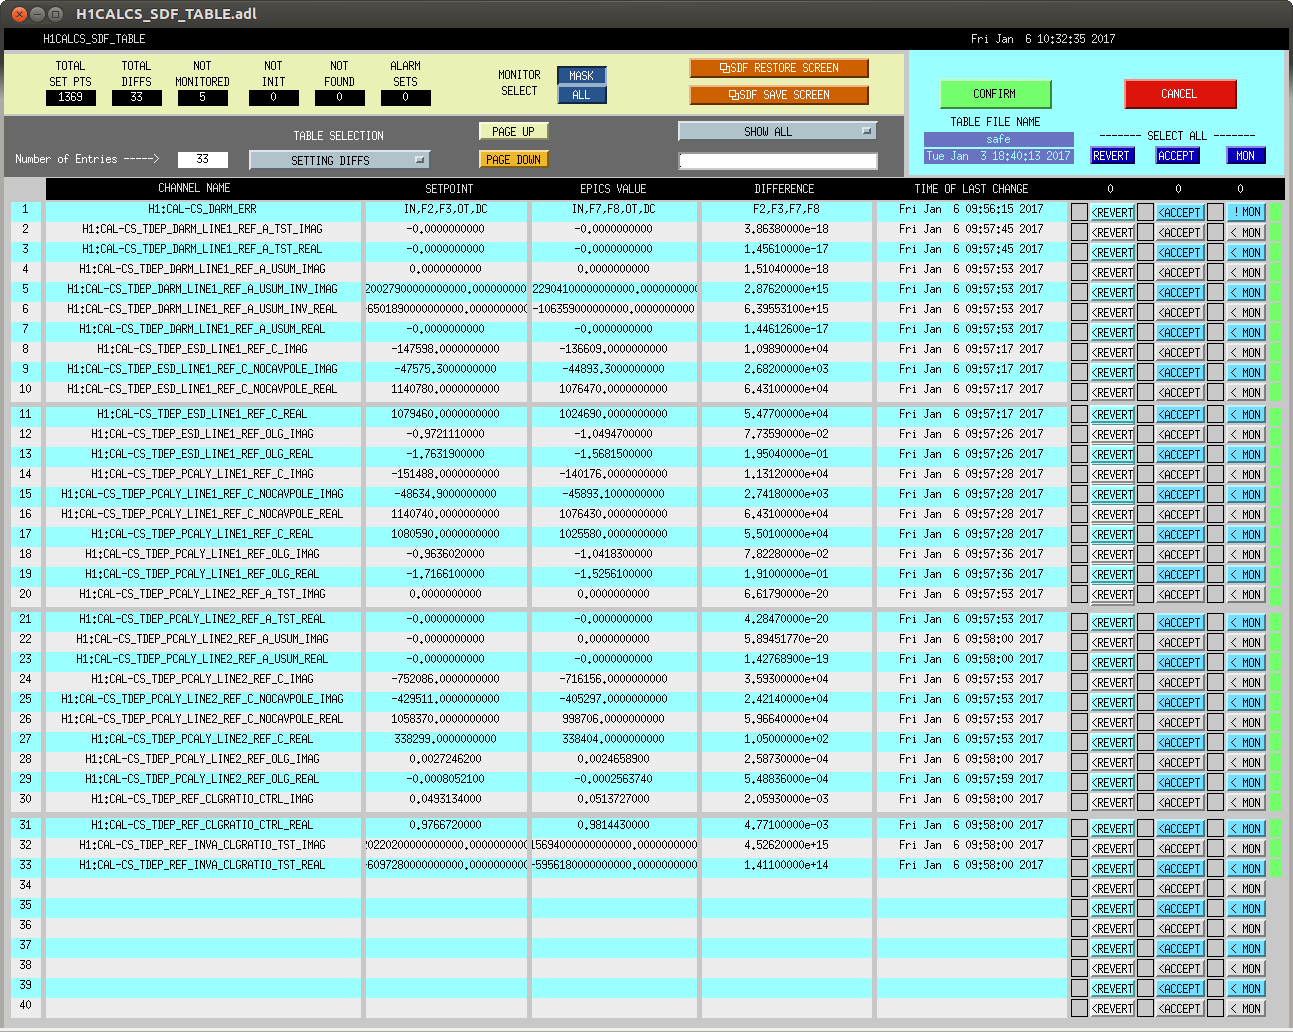
READY, BUT NOT PUSHED - Use the loop model tp push new reference values to the front end CAL-CS model (changing the optical plant compensation, and the gain of the actuator compensation, L2/L3 change has already been pushed)
READY, BUT NOT PUSHED - Use the loop model to push new EPICs records that document model values at calibration line frequencies (the biggest change will be from the L2/L3 cross-over upgrade)
<< this is the major problem that's causing bad h(t) calibration flag
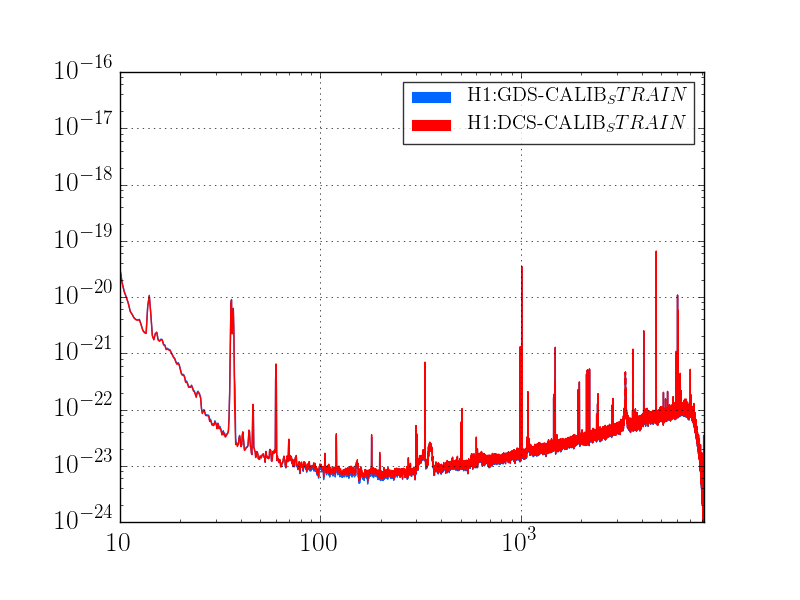
CAN BEGIN - Use the new loop model to push a new set of GDS FIR correction filters (small changes due to better AA/AI model)
- Confirm that time-dependent correction factors are within an expected range
<< if/when in range, this should green light the h(t) calibration flag
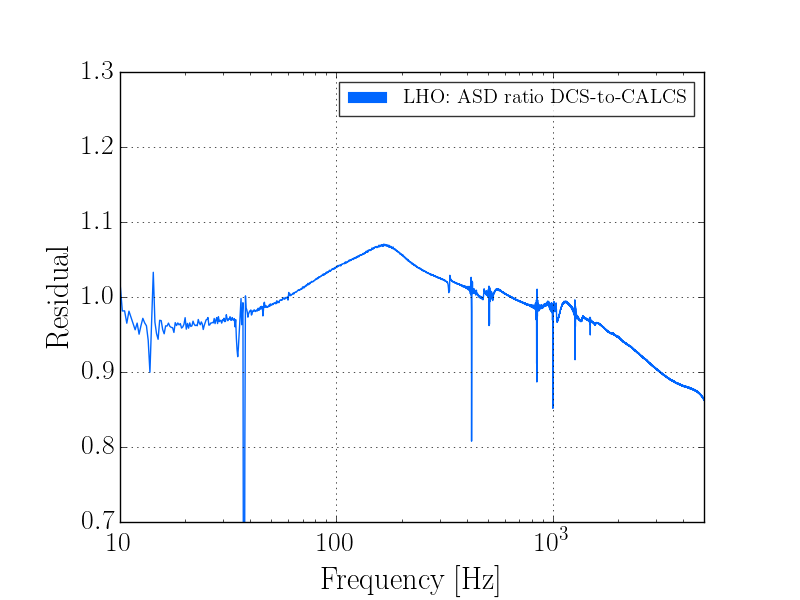
CAN BEGIN - Use the new loop model to generate DCS FIR filters to recalibrate the all data from the post-winter break from raw DARM_ERR and DARM_CTRL.
- Push hard for uncertainty estimations for both the first part of O2 and data post-winter break.