More musings on the wind.
- summary -
Brian suspects that the motion of the building above 20 mHz is caused by turbulence generated at the building by the wind, and that below 20 mHz it is caused by the overall wind velocity.
There is strong evidence of vortex shedding along the building. We see significant lateral tilting of the slab (ie transverse to the wind direction), and the motion along the wind direction shows a change in character which coincides with Strouhal number, which describes the vortex shedding scale.
- not so summary -
Jim W reported a big windstorm starting early in the morning local time on Oct 14.
https://alog.ligo-wa.caltech.edu/aLOG/index.php?callRep=30592
I took a look at the impact of the this wind storm on the tilt of the End Y slab as seen by the ground STS-2 and BRS. We know this slab bends, so this is just the motion near the tank, not of the whole floor.
All the data, plots, and matlab code is in the seismic SVN at
seismic/Common/Documents/T1600506_LHO_wind/wind_data_oct15
Pages 1-3 wind history. - wind is variable, but high
The data spans 21 hours, starting at about 11pm pacific time on Oct 13. The wind really gets going at about 1 am PDT Oct 14. There are several hours where the speed at EY is in the 15-20 m/s (33-44 miles/hour).
The wind speed is different at the two end stations. The wind direction at EX shows that mostly the wind comes from the SW, up along the Y arm towards the corner station. WE ASSUME that the wind direction is similar at EY, even though the direction indicator there remains broken. (see pg 14 for the direction read by the EY station - you can see that it is broken.)
Pages 4-7 Data selection
Because the wind is variable, I decided to use just 3 segments where the wind is pretty steady. These are labeled t3, t12, and t13 for the hour they span.
t12 = avg speed = 15.1 m/s, time span = hour 11.5 - 12.5
t13 = avg speed = 9.2 m/s, time span = hour 12.6 - 13.7
t3 = avg speed = 8.4 m/s, time span = hour 3.0 - 4.2
Pages 8-10: Coherence is very low above 20 mHz
Plot the coherence of various signals at end Y during the three times.
The BRS and the STS-2 Y signals are very coherent from 10 -100 mHz during 15 m/s wind
at 9 m/s, they are very coherent, but the primary microseism is evident at 70-80 mHz as a drop in the coherence.
Below 20 mHz, there is some coherence between the wind speed (also speed^2) and the STS-Y signal. Above 20 mHz there is no coherence between wind speed and anything.
The lack of coherence could be caused by the pixelization of the wind speed, but more likely is caused by turbulence at the building. ie - the speed at the anemometer is not a good measure of the net force on the building at 30-100 mHz because the turbulent flow of the air around the building means that wind speed/ building force at various points across the building at 30-100 mHz (30 sec to 10 sec periods) are not coherence with each other or the anemometer. This does not sound crazy because turbulence is chaotic.
page 11-12: tilt motion of End Y
The wind is blowing in the -Y direction.
The building is tilting in both X and Y - the X motion is 2-3 times larger that the Y motion. This is interesting, and I'm not sure why we see this.
Points to consider:
1) Maybe there is wind blowing in X? I don't think so. All the data we have says the wind is blowing along Y.
2) Vortex shedding - air blowing along the sides of the building causes big vortices, which break off and buffet the building side-to-side. This certainly happens with flag poles etc. I am sure this is happening, but I can't calculate how large an effect this is.
3) STS-2 location on the floor - The floor bends, and the farther you are from the walls, the smaller the tilt is at your location. I think the STS-2 is closer to the big +X wall than it is to either the smaller walls at -Y or +Y (-Y is the wall closest to the corner station). So maybe because the sensor is closest to the X wall, it is seeing more of the tilt in the X direction (rY). Again, this is probably true, but I'm not sure how much of an effect this is.
Whatever the cause, the effect is quite clear at the sensor location, and thus at the location of the ETMY optic.
Second plot on page 12 is the tilt seen by the EY BRS. The spectrum seems to have a corner at about 300-400 mHz.
page 13 - BRS subtraction performance
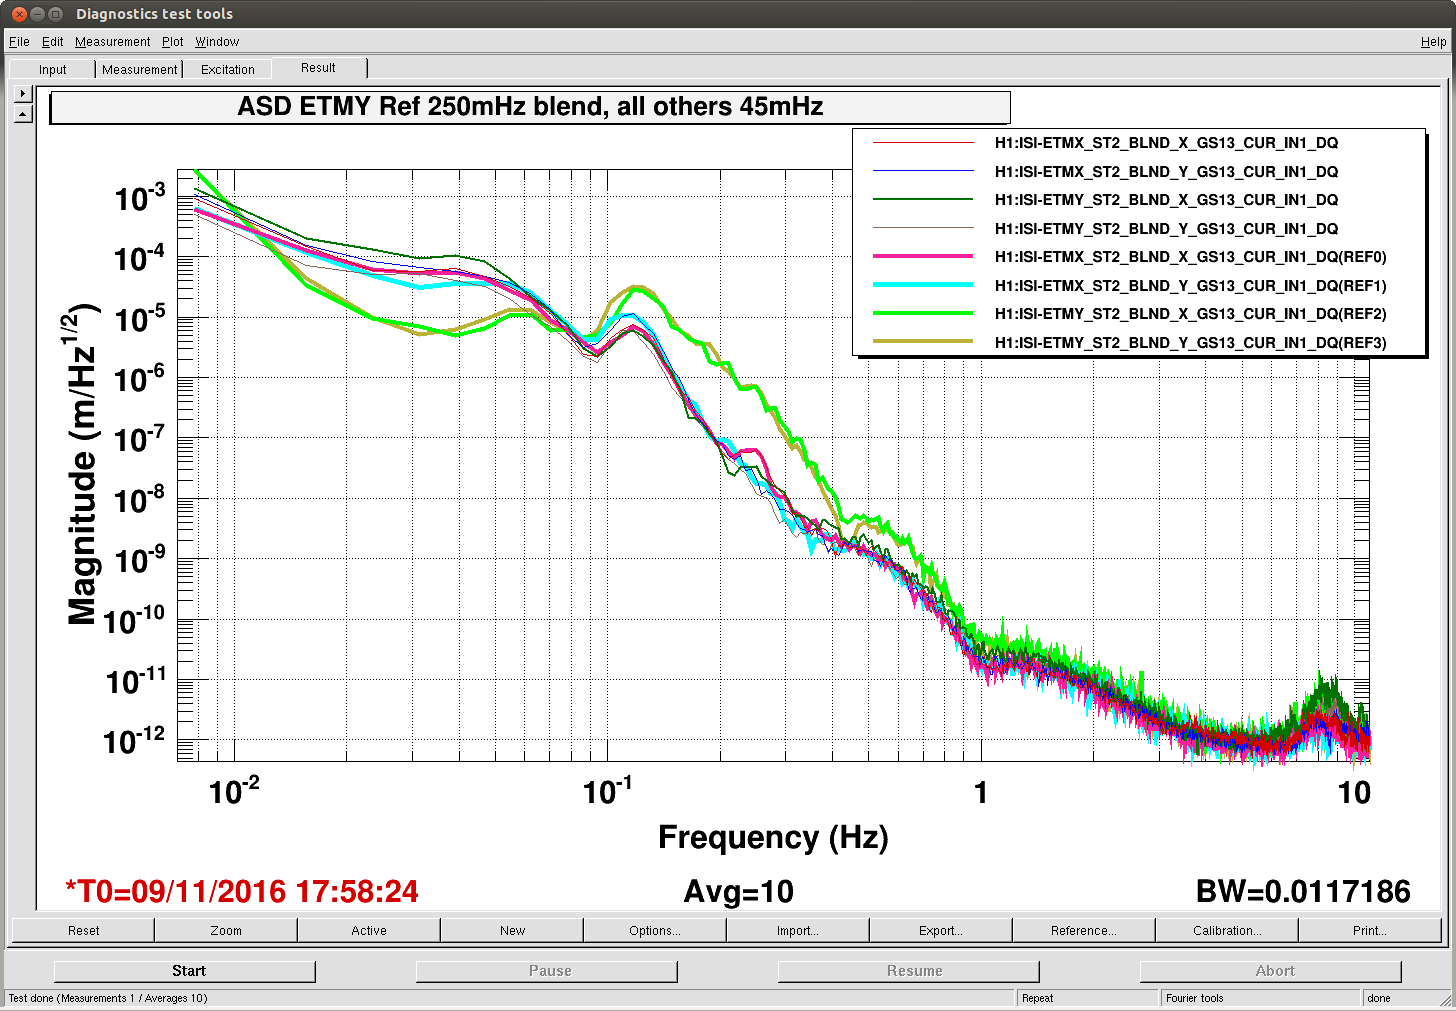
We see the BRS subtraction is beating the End-Y STS 2 above 15 mHz, and doing very well above 30 mHz.
The two plots on page 13 compare the Y motion seen by the STS-2 Y in the corner station with the STS-2 Y motion on the floor in Y-end and with the real-time tilt-corrected signal formed by subtracting the BRS from the STS-2 ('H1:ISI-ETMY_SUPER_Y_OUT_DQ')
It is interesting to see that the y-end station has significant excess motion above 250 mHz in the high wind. this may be affecting the subtraction at 40-100 mHz (mccs2 might be able to tell you, but I have not checked).
Page 14 - tilt scaling with wind speed.
Does the tilt spectra scale like avg wind speed^2?
Nope! Plot 14 shows 3 BRS spectra, each with a polynomial fit.
average wind speeds are:
t12 = 15.1 m/s, t13 = 9.2 m/s, t3 = 8.4 m/s,
(t12/t3) = 1.81, (t12/t3)^2 = 3.3
(t13/t3) = 1.1, (t13/t3)^2 = 1.2
(t13/t12) = 1.64, (t13/t12)^2 = 2.7
If the ground tilt were simply a shaped spectrum which scaled as wind^2, then
the dashed blue curve would be a flat line at 3.3,
the dashed red line a flat line at 1.2, and
the dashed purple would be a flat line at 2.7.
Clearly this is not the case.
turbulence? more turbulence at high wind speeds?
Page 15 - EY wind direction indicator is still busted.
EX sensor says the wind is mostly blowing in the -Y direction.
EX sensor signal is wierd and crappy.
Only processing I did was to take the the sensor readings, and if they were > 180, then I subtracted 360 from them.
EY is still busted, but we knew that already.
On the shape of the BRS rotation curve:
A casual look at the ground rotation indicates there might be some change in the slope of curve at about 200 mHz for the blue, 15 mps curve, and a similar bend at about 130 mHz in the red/ yellow curve for the 8-9 meter/sec wind speed.
This corner is very close to characteristic frequency given by the Stouhal number for vortex shedding. Interesting!
WARNING - These dimensionless numbers are intended to give a sense for the scaling of what is going on, NOT to predict what will happen (unless you happen to have a perfectly spherical building with no ground nearby)
Strouhal number for vortex shedding
(https://en.wikipedia.org/wiki/Strouhal_number)
For a Reynolds number of 1e7, the Strouhal number, St, is ~0.3.
St = f * L / v.
here the characteristic length is the length of the building
so L is about 80 ft = 24 meters
f = 0.3 * v /24
for v = 15 m/s, f = 0.19 Hz
for v = 9 m/s, f = 0.11 Hz
Reynold's Number
The flow is turbulent; the reynolds number is ~10^7
(https://en.wikipedia.org/wiki/Reynolds_number)
Reynolds number = ( velocity * L)/(kinematic-viscosity)
kinematic-viscosity = 1.460×10⁻⁵ m2/s for the atmosphere at sea level.(wikipedia)
L = 18 meters (building width) or 12 meters (building height)
v = 9 to 15 m/s
R1 = 15 m/s * 18 m / 1.46e-5 (m^2/s) = 18* 10^6
R2 = 9 * 12 / 1.46e-5 = 7 * 10^6
-
so if you are breaking off vortices at something like the frequency given by the Strouhal number, then I guess it is not crazy to think the building rocking will show that characteristic frequency. Need to follow up with someone who knows about these things!