It seems like there are some PI modes that we are no longer damping that are slightly run up according to the dtt. I also wonder if the peaks at around 13000hz are modes that we had not had issues with before, or maybe something else entirely? I don't see any mention of them on the PI medm and they are currently the highest. I will try to damp some of the other ones if they get any higher.
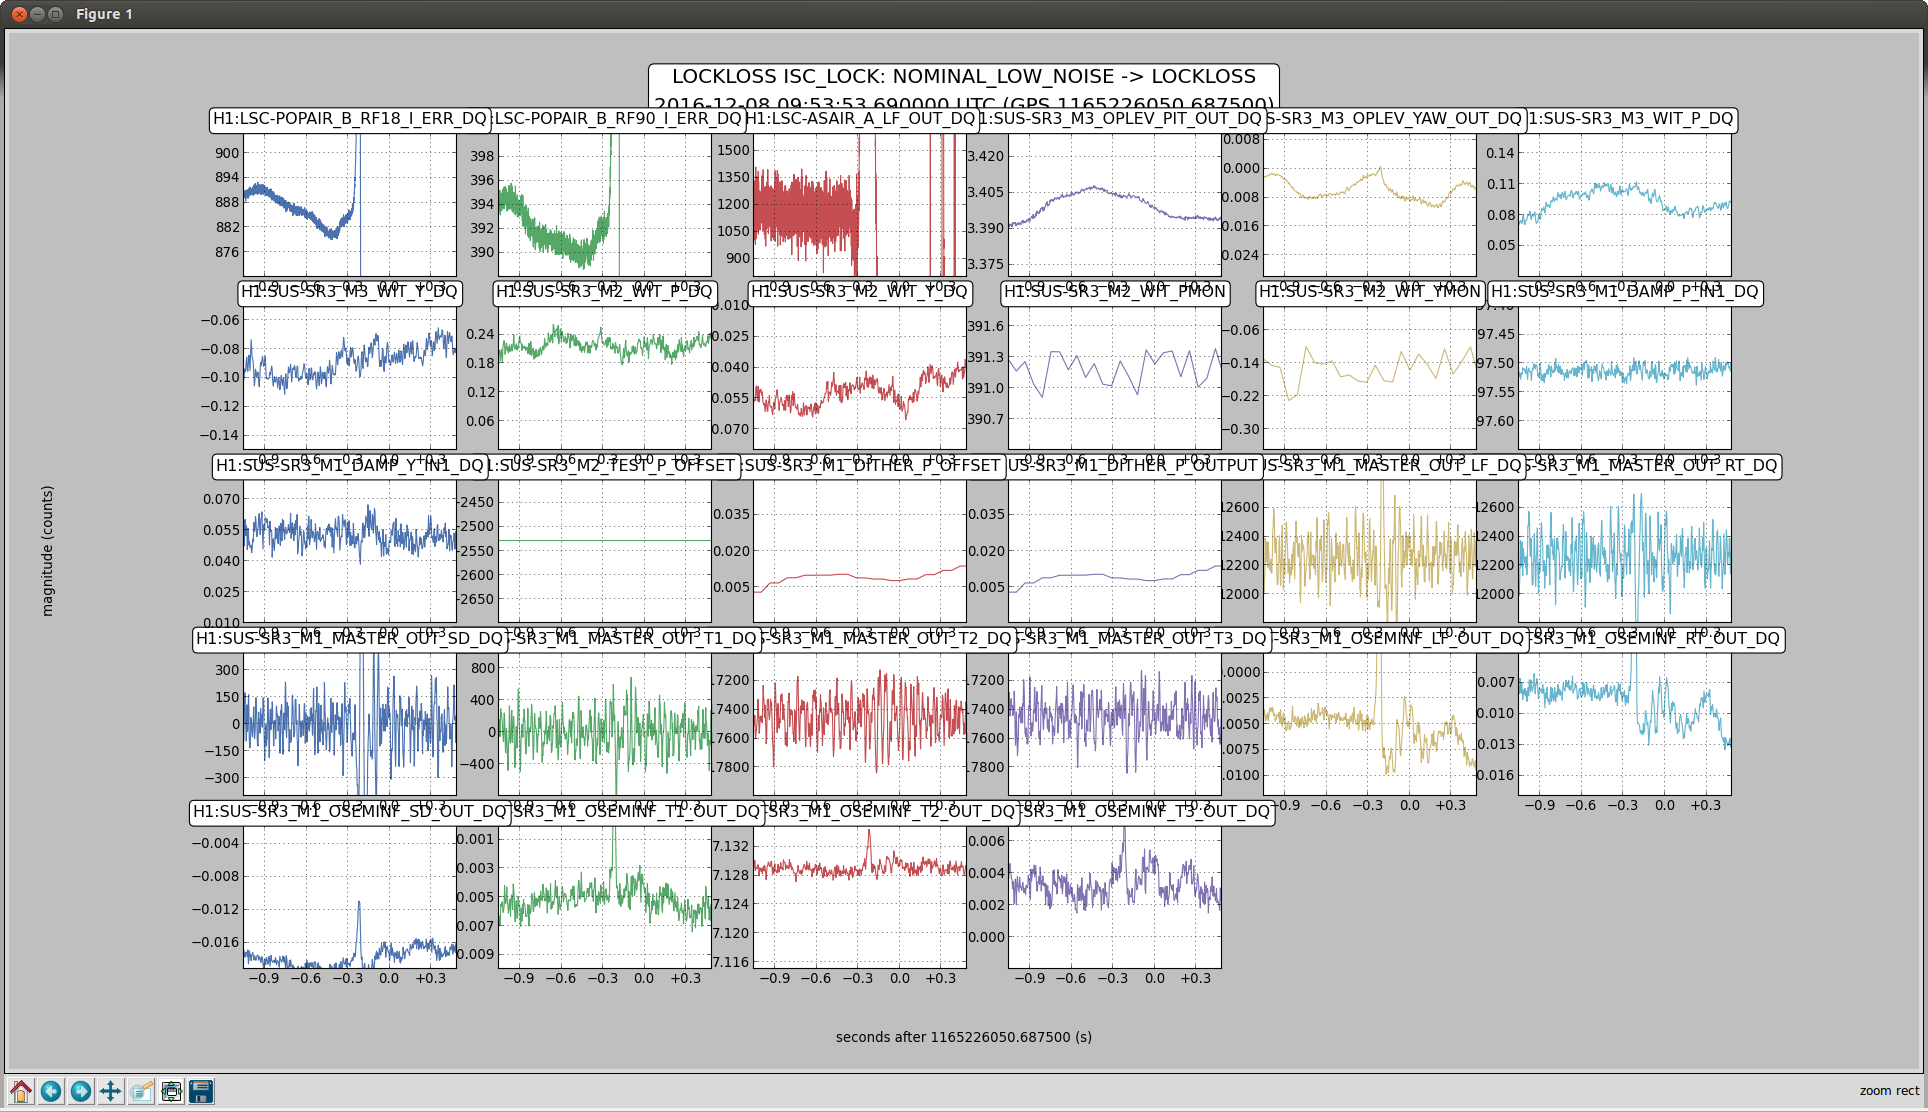
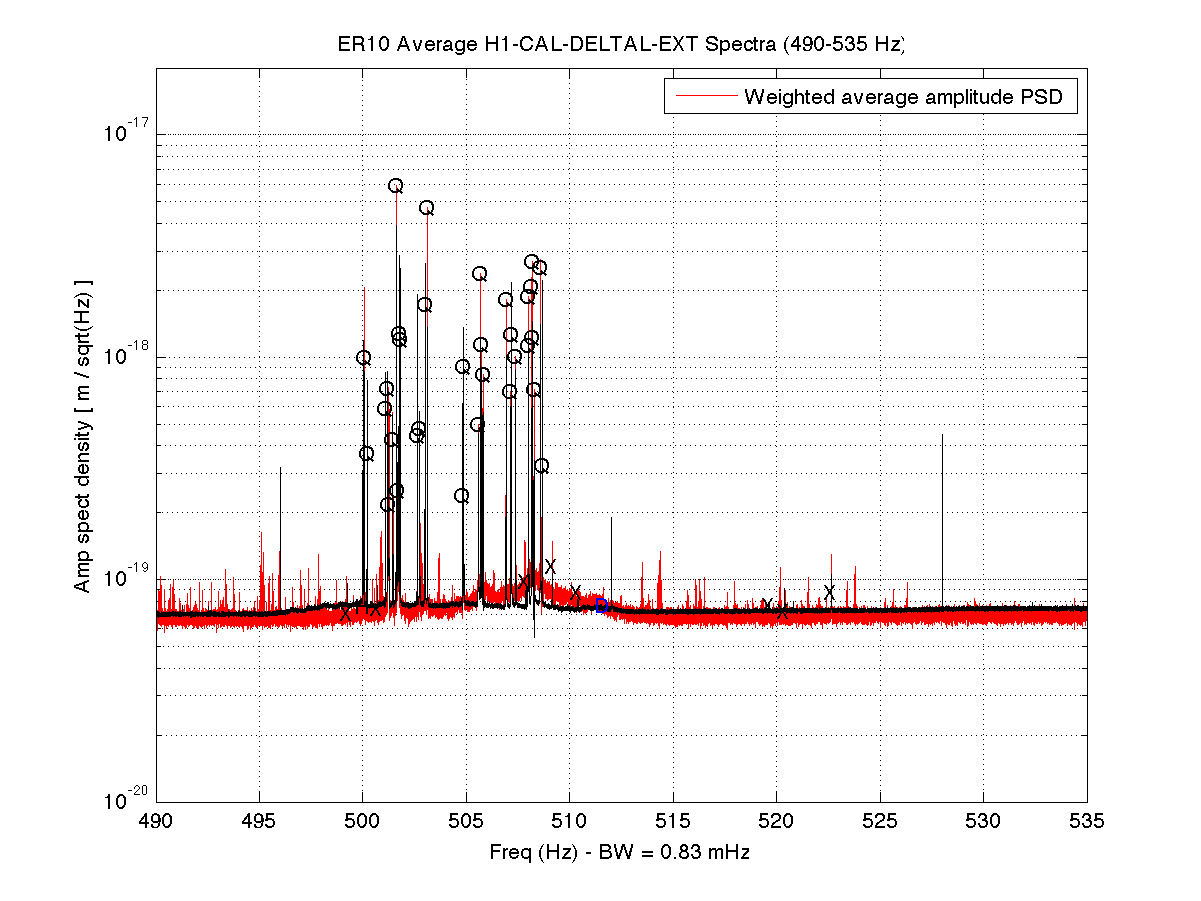
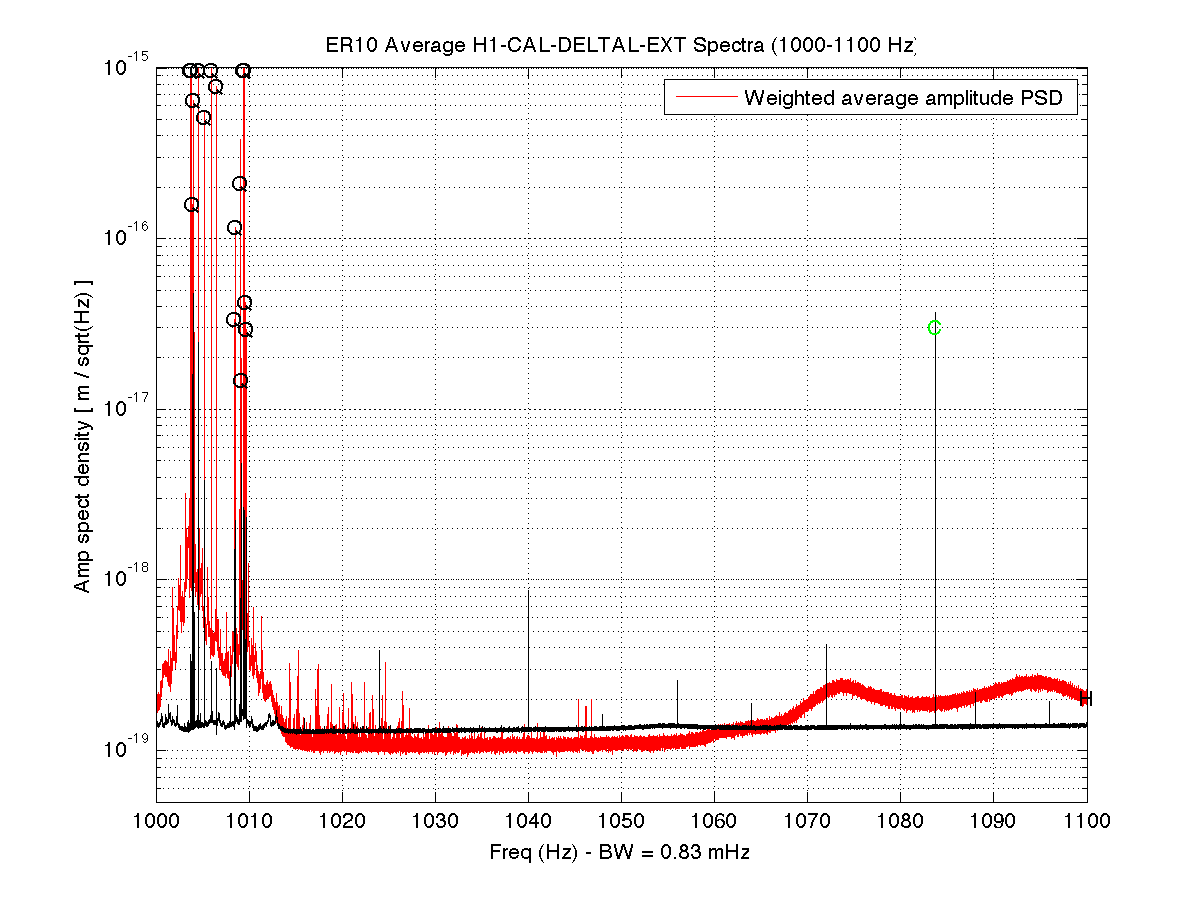
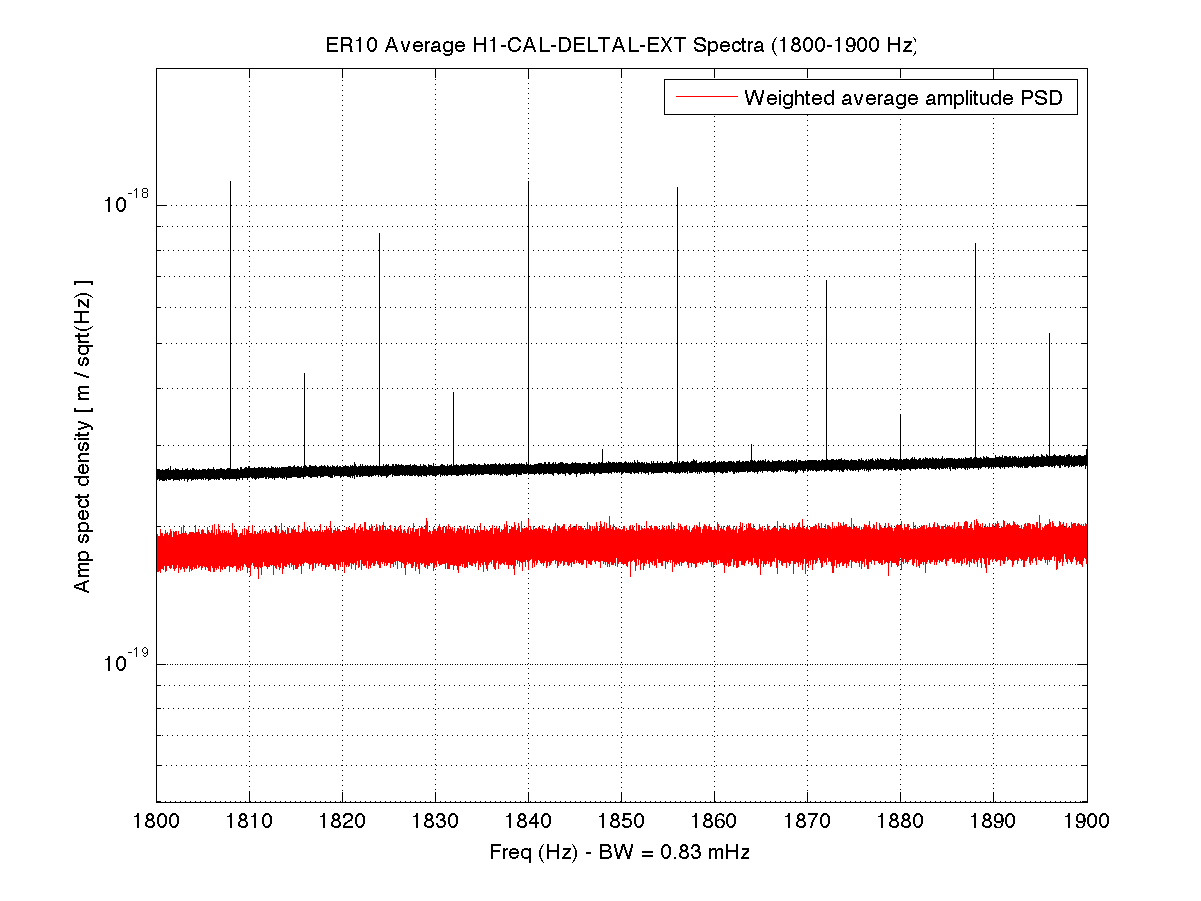
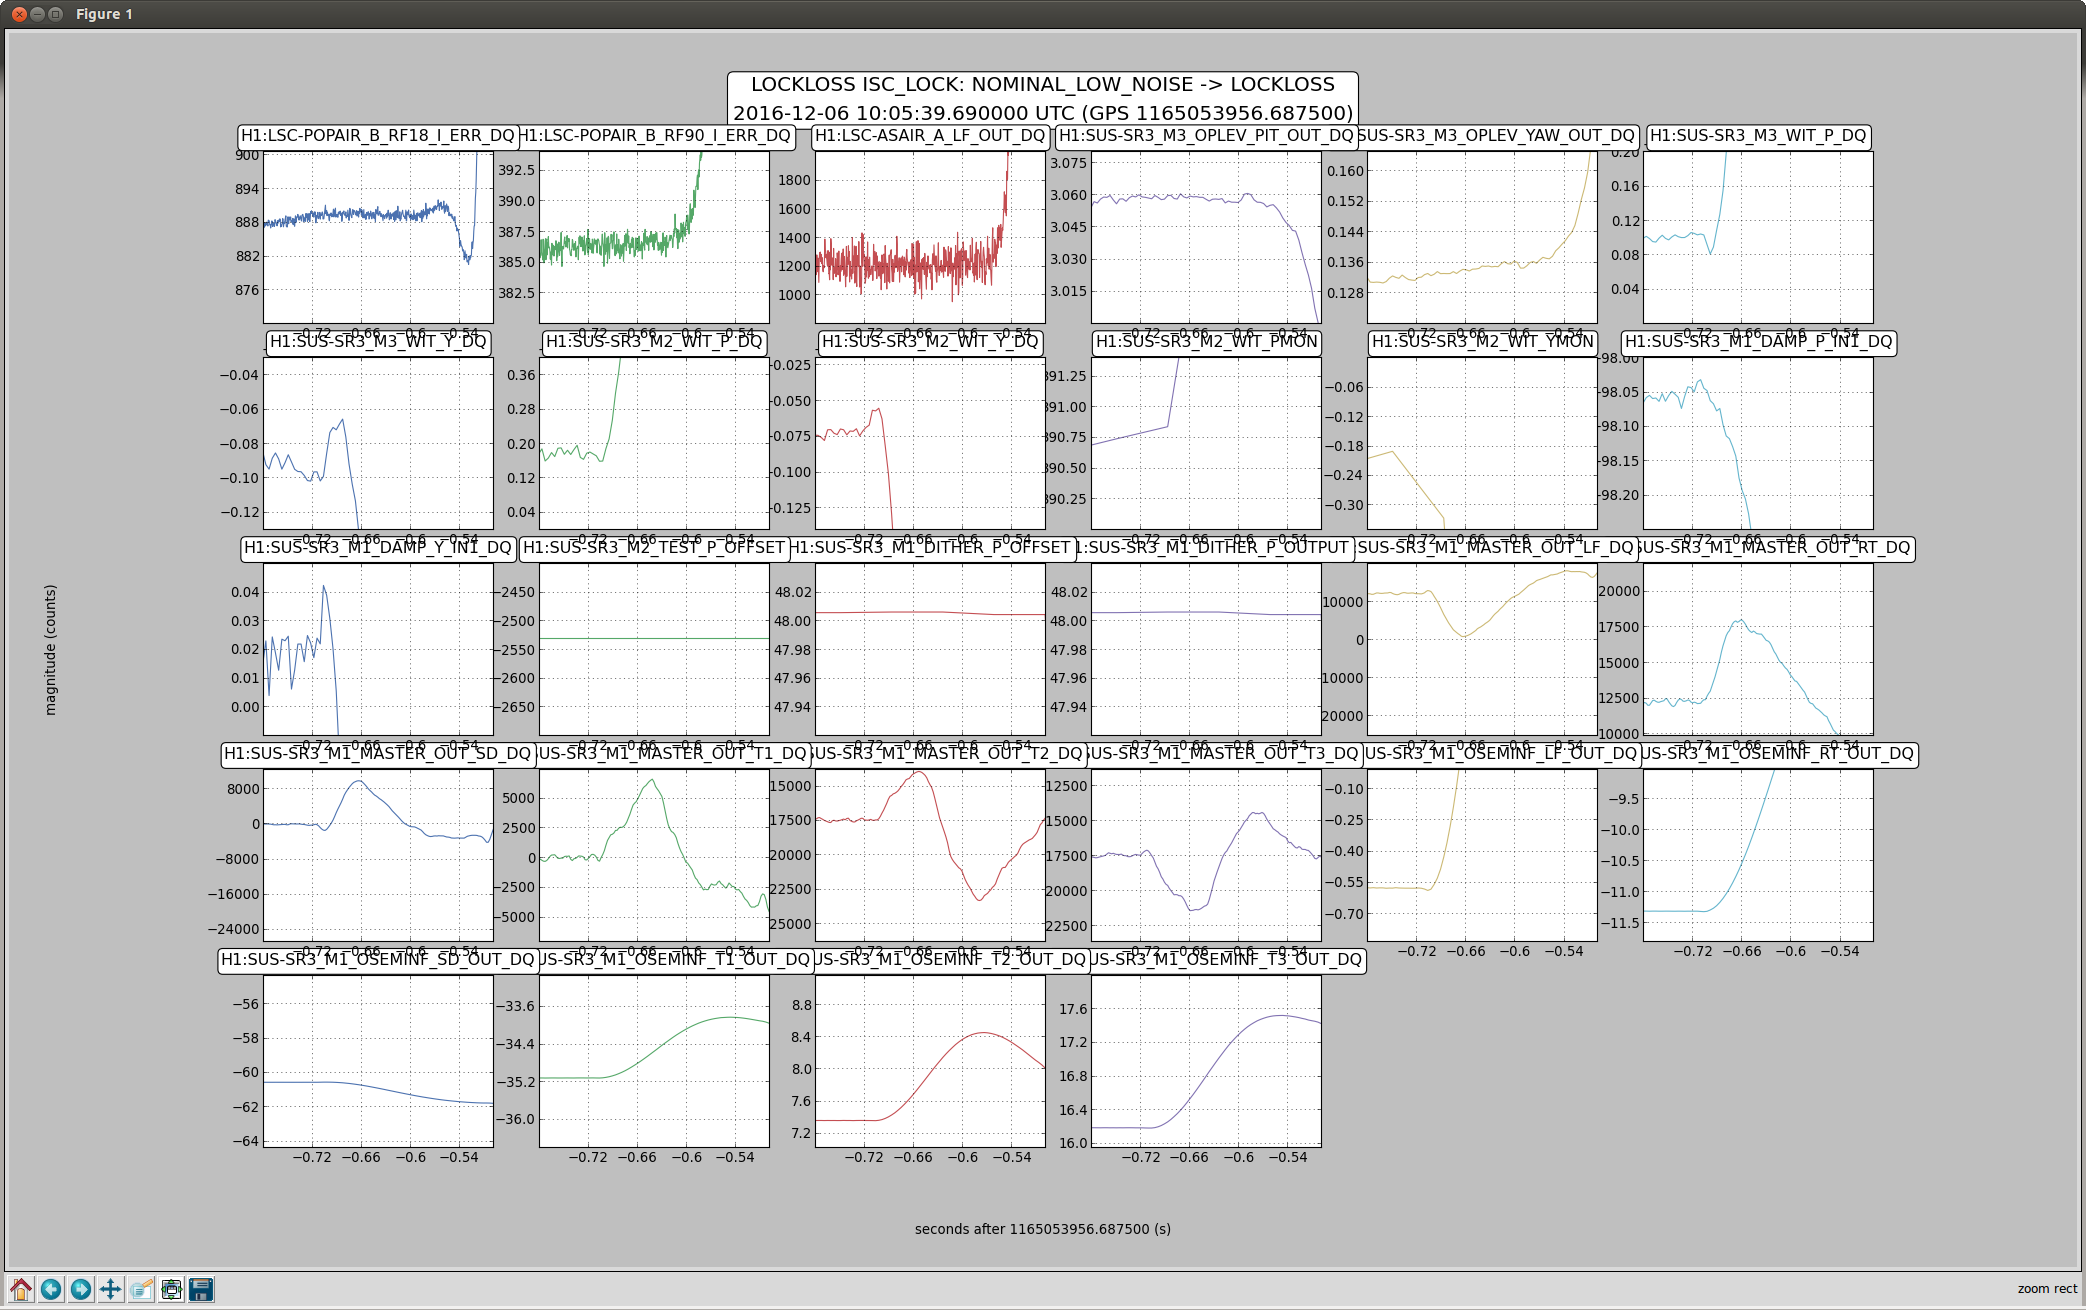
The attached shows the PI dtt just after reaching low noise.
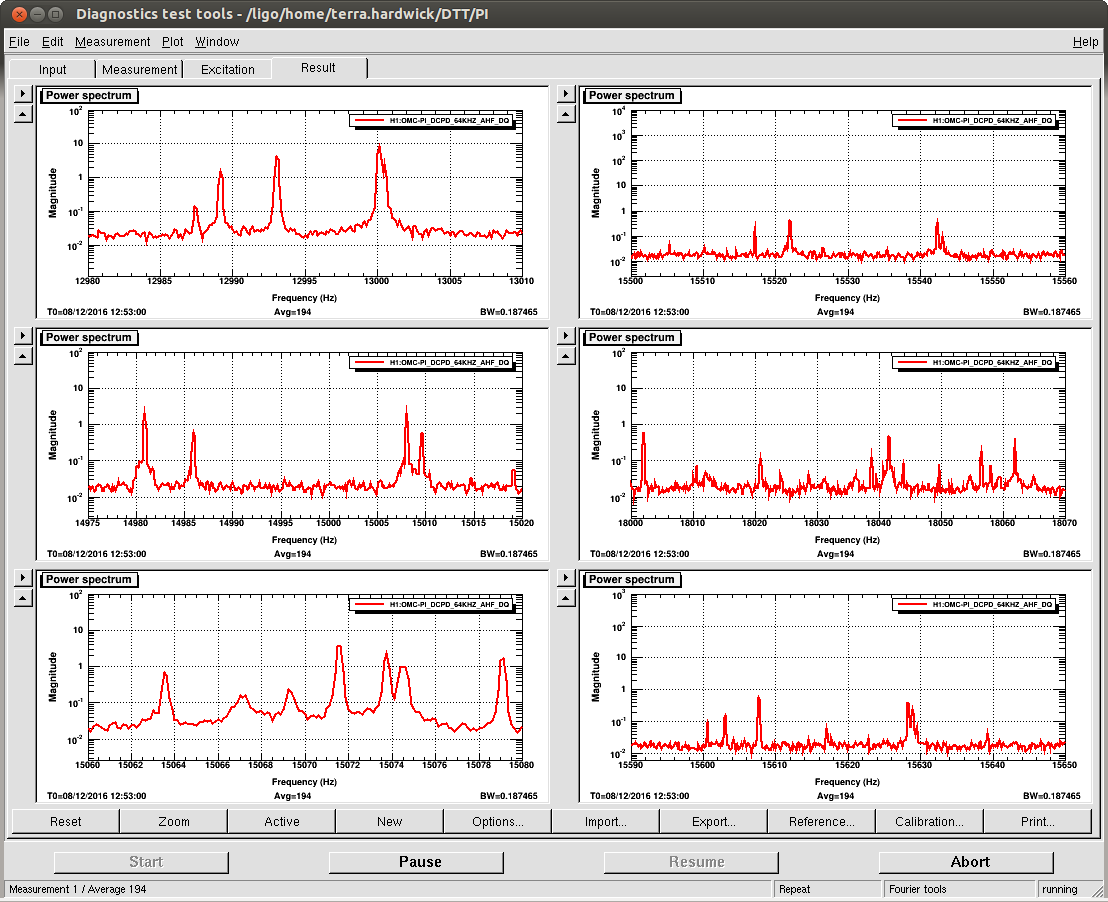
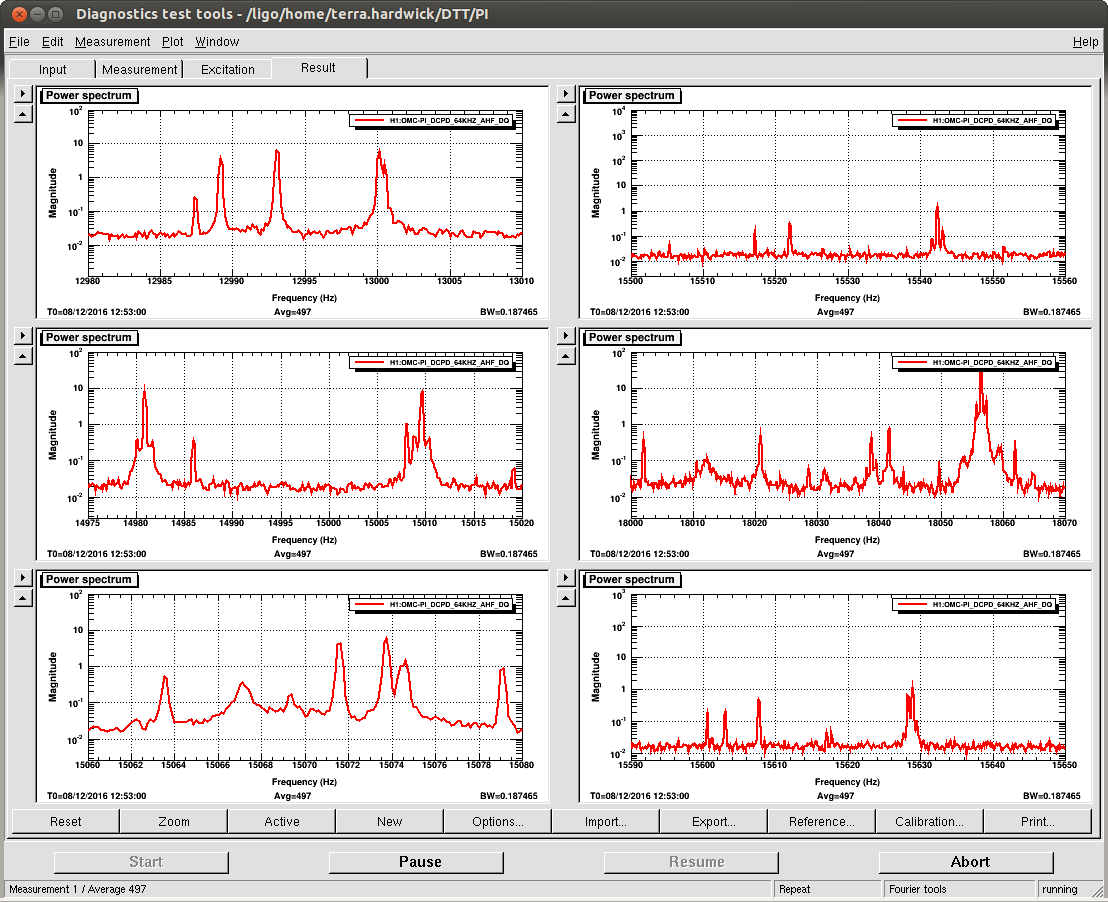
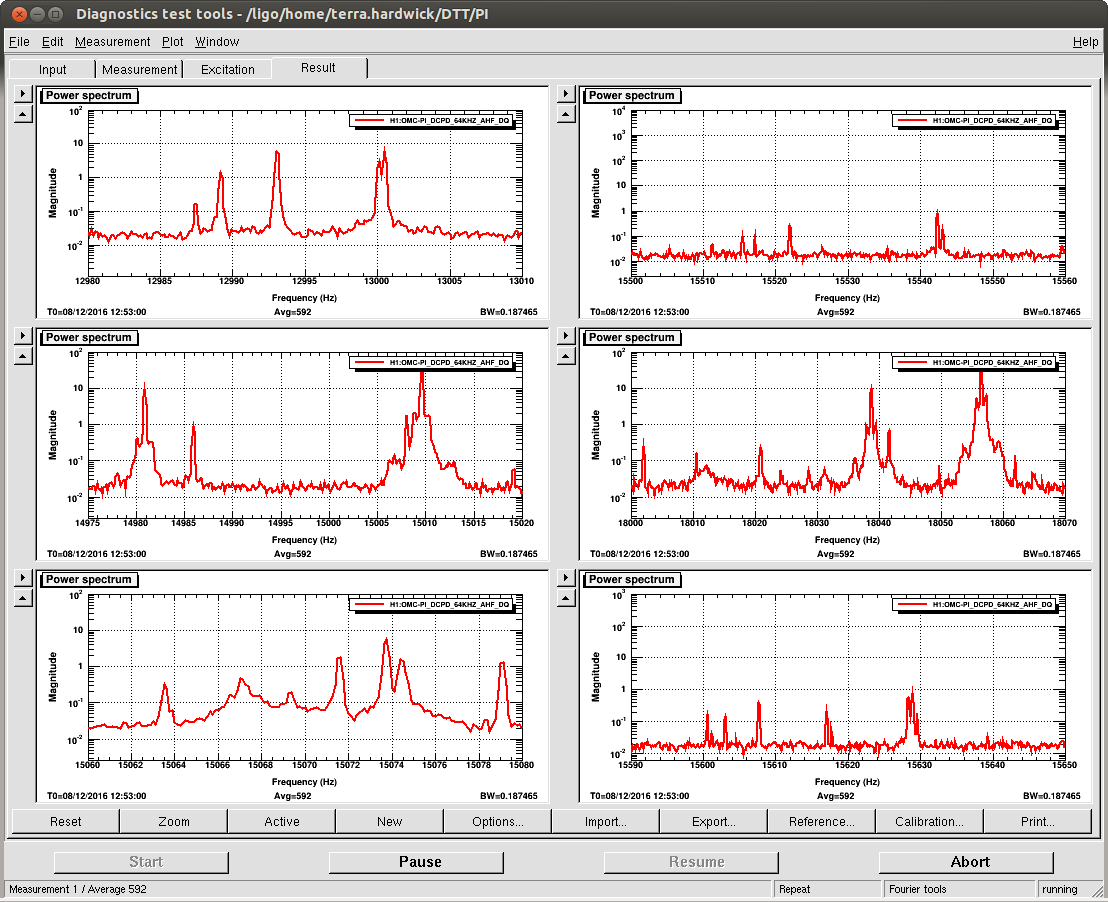
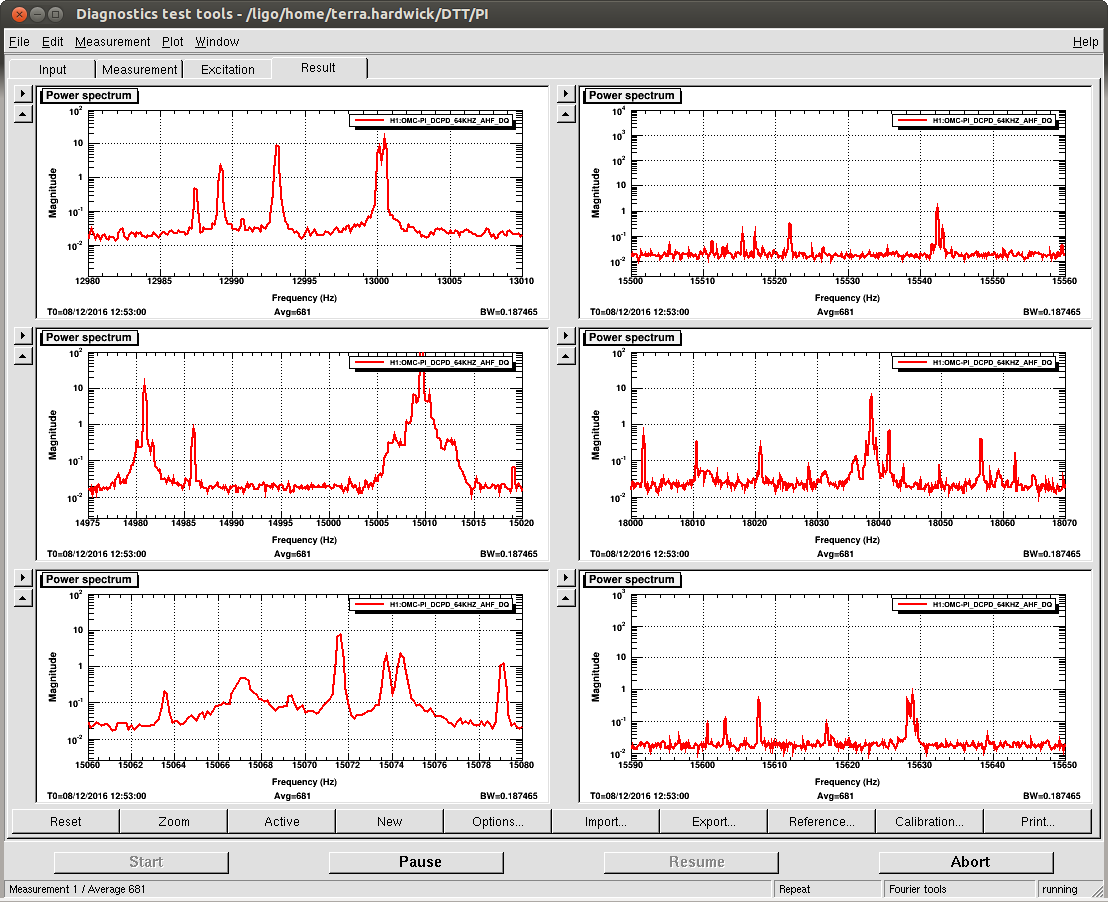
Well I think things are stable now. I ended up flipping the sign for the both the phase and gain on mode 27. Mode 26 also came up and changing the phase got it to, very slowly, go down. I took some screen shots of the dtt template at 20min, 26min, and 32min into the lock. The modes that the Striptools said were ringing up, didnt necessarily agree with the dtt. I dont remember how much the modes can shift in frequency, but it seems like some of them were off by a couple of hz.
A couple things:
- I'm not sure what you're referencing that seems 'a couple Hz off', could you elaborate? I checked the band pass filters against the frequency of the peaks at the times you listed and the most I found was Mode28 was off by 1 Hz. I have since changed the BP filter to account for this shift.
- Remember that if a peak's frequency in DTT is different than the bandpass filter frequency, you should switch to a different band pass. There are explicit directions in the PI Wiki (which you can open from the PI medm screen and which I just updated to make more clear) and I've walked through this process individually with each operator. If something is still unclear, you can always still call me at anytime (number on the whiteboard). This shouldn't be much of an issue these days but is worth checking if you're having damping problems.
- Modes 27 and 29 have to be carefully watched during the first hour of lock. These have been successfully damped for weeks now but must be reacted to immediately.
- Again, if you lose lock from a PI, you must wait in DC readout to give that mode time to ring down. You can watch the ringdown in DTT. If you try locking again, the mode will still be rung up.
- There are some modes that always have higher amp, such as the 13kHz modes TJ noted, that are not unstable - TJ that DTT from low noise you first posted is totally normal. You can always look at a reference from an eariler stable lock time to compare the amplitudes. I will add a good reference to the PI DTT in the background so it's easy to see what's 'good'
- Regarding DTT and StripTool not seeming to match - we use different error signals for different modes, while the DTT is just looking at one of those signals. The result is that Modes 27,28 look very rung up on the StripTool but their peaks in the DTT dont look so high. This is done on purpose, because those modes need to be damped faster.
Please any operator contact me at any time if help/explanations/etc is needed.
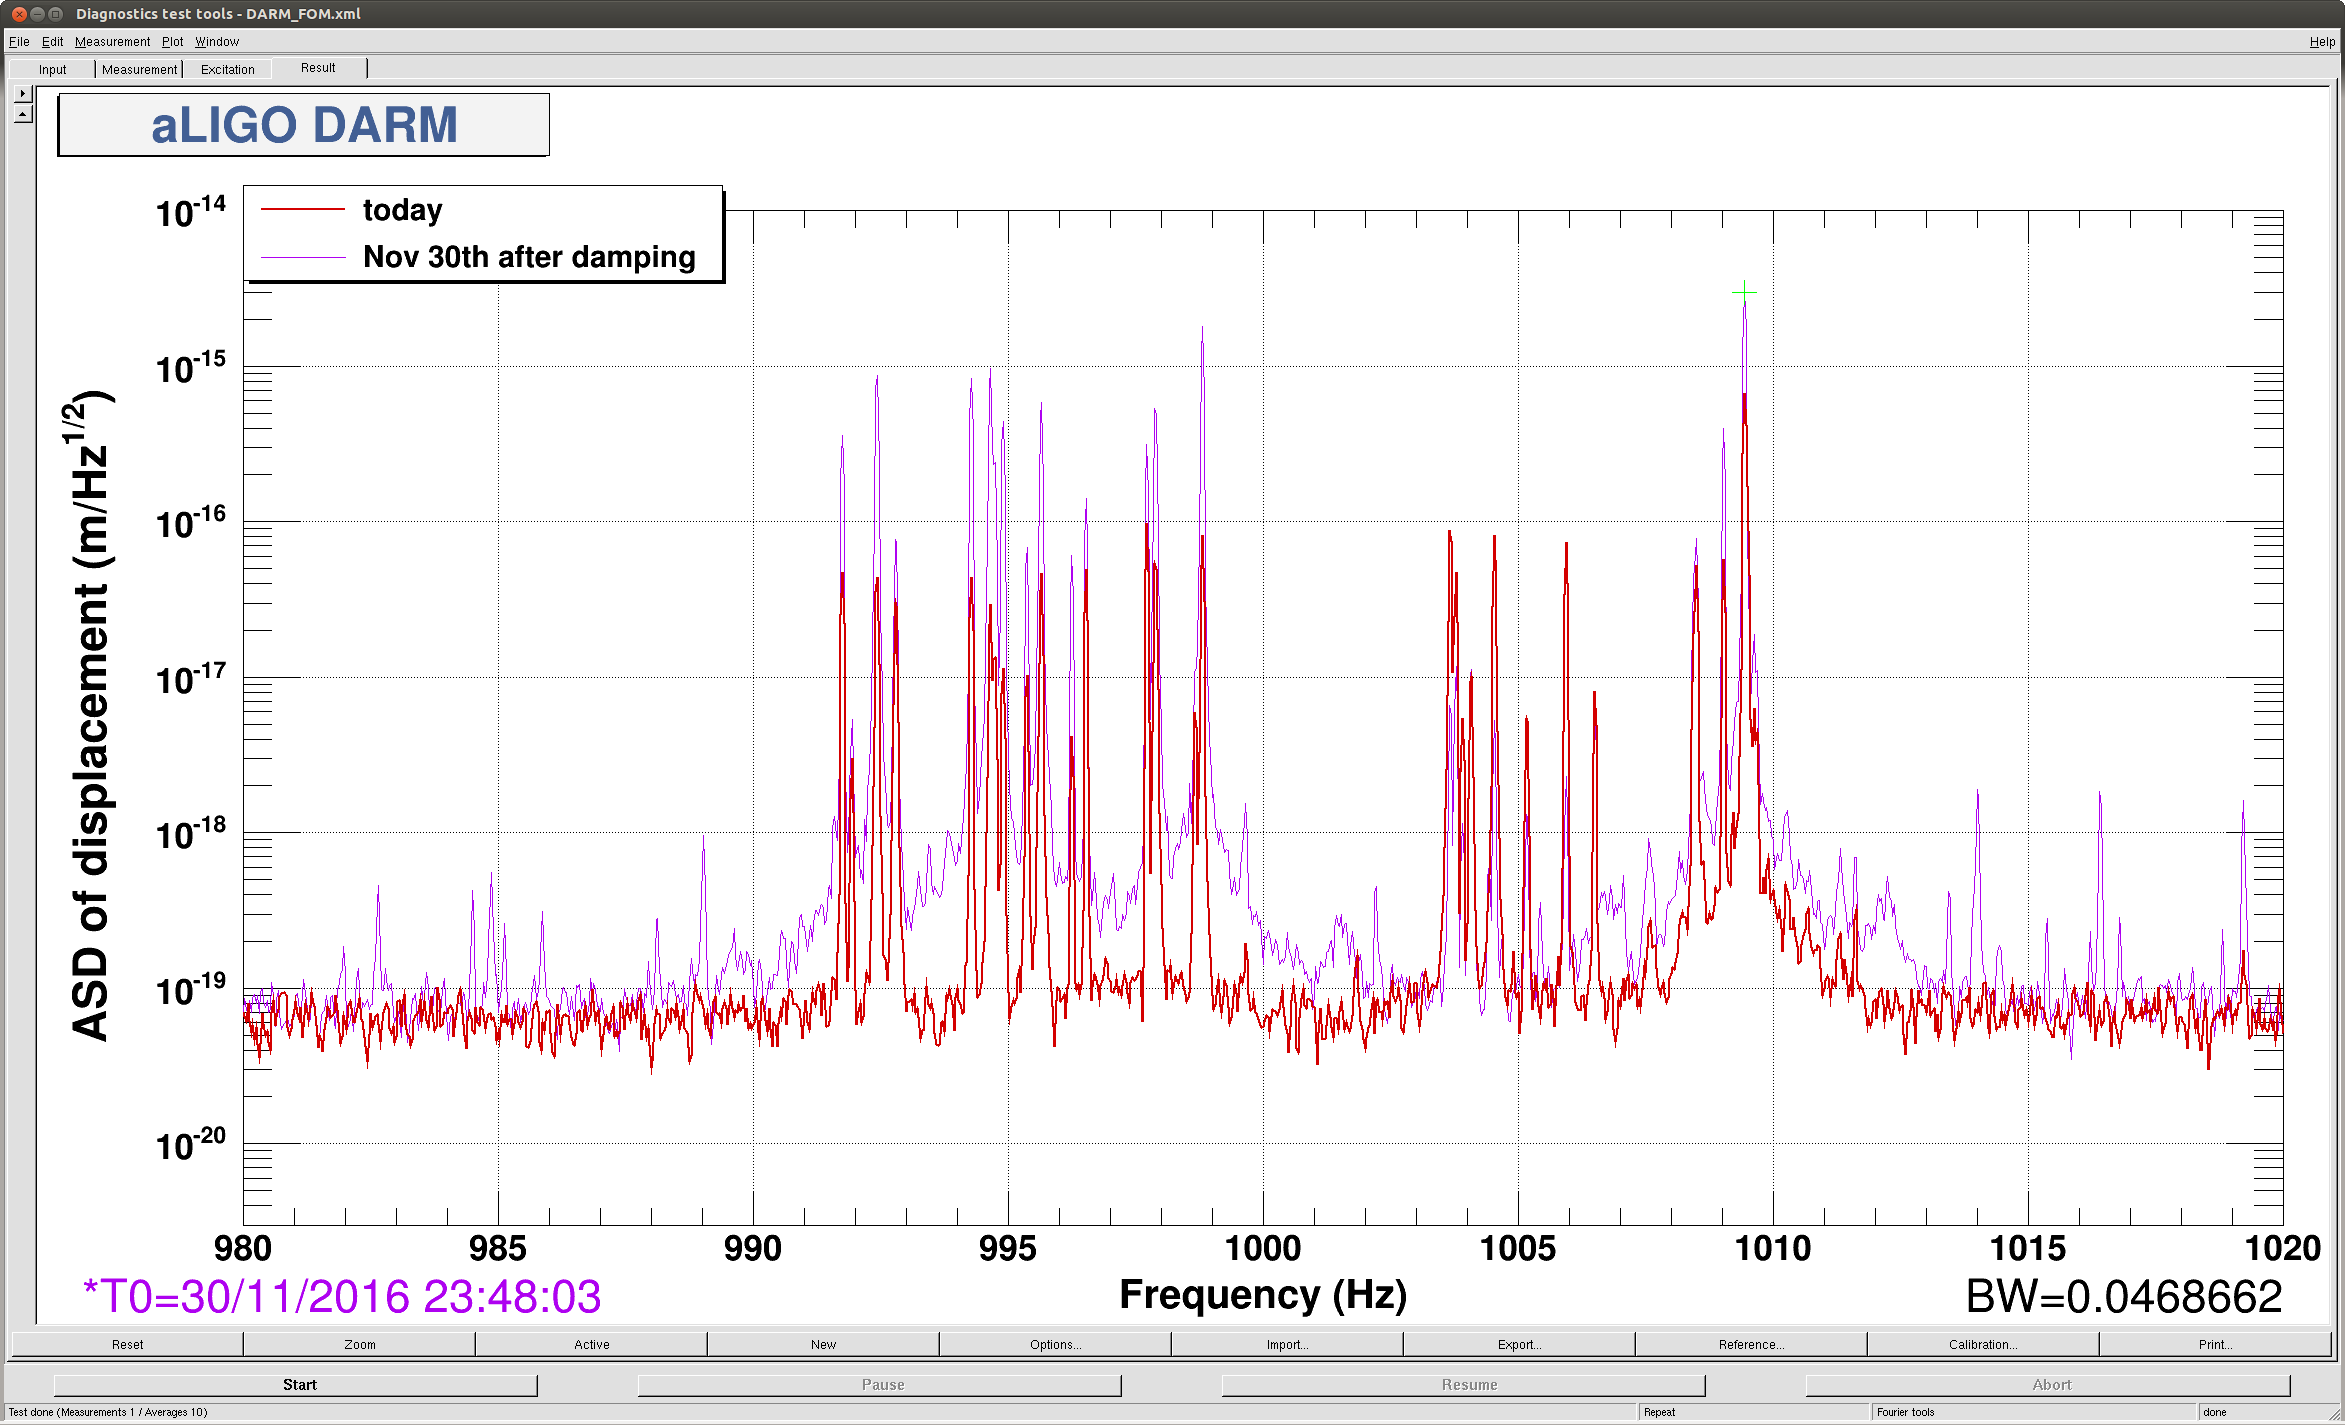
For the couple hz off thing, I was mainly refering to the frequencies listed on the medm above the modes. I'm not sure how accurate these are suppose to be, but like mode 27 says 18041, and the dtt was saying that 18038 seemed to be more rung up (see second attached). I didn't remember how much they shifted, and I did not look at the actual filters themselves at the time.
I was able to make it work (on the second try) with just changing phase and gain so I didn't look into it too much after that. But, yes, following your instructions and changing the BP would have been next on the list.
In alog32385 you mention that you will put a reference trace to show what is normal and what is not. I would love this because I looked at the dtt picture that is on the wiki and saw that it was much different. Either way, it was a good learnign process for me since I have only ever had to change phases for PI modes.

