J. Kissel, D. Barker As Darkhan caught last week (LHO aLOG 28126), when we installed the new individual stage oscillators on the QUADs (LHO aLOG 27733), we neglected to store the excitation channels in the frames. Today, I've added those channels to the ETM QUAD master model, stored inthe science frames at 512 Hz, and restarted the SUS. Channels: H1:SUS-ETMY_LKIN_P_LO_DQ 512 H1:SUS-ETMX_L1_CAL_LINE_OUT_DQ 512 H1:SUS-ETMX_L2_CAL_LINE_OUT_DQ 512 H1:SUS-ETMX_L3_CAL_LINE_OUT_DQ 512 H1:SUS-ETMX_LKIN_P_LO_DQ 512 H1:SUS-ETMY_L1_CAL_LINE_OUT_DQ 512 H1:SUS-ETMY_L2_CAL_LINE_OUT_DQ 512 H1:SUS-ETMY_L3_CAL_LINE_OUT_DQ 512 Model Change to: /opt/rtcds/userapps/release/sus/common/models/QUAD_MASTER.mdl
As found, RGA was valved-in to Y-end -> Will take a few scans in an hour or so
Took advantage of laser being down (aLOG #28142 & 28145) to change the water filters in the chiller room. Swapped out the Diode Chiller filter. The filter looked fine, but changed it out anyway to see if this had any effect on the rising PSL chiller pressures. Did not change the Chrystal Chiller filter. The filter bracket is poorly mounted to the wall and is coming loose. Need to secure the filter bracket to the wall before unscrewing the filter canister.
48 hours after changing the Diode filter the PSL chiller pressures and flows seem to be flattening out. Will continue to monitor over the next several days. The plan is to swap out the Crystal chiller filter in conjunction with remounting the filter housing.
With the measured sensing function (28123) in hand, we did an MCMC-based numerical fitting for the sensing function (see E. Hall, T1500553).
The fitting results are
[New sensing function form]
As reported by Evan (27675), it seems that the extra roll off in the DARM response at low frequencies are due to an SRC detuning (or something equivalent). While such detuning should be suppressed by some control loop ideally, we decided to include the detuning-induced functional form in addition to the ordinary single-pole response. We use the following approximated form for the DARM response
S(f) = H / (1 + i f / fc ) * exp( -2 * pi * f * tau) * f^2/(f^2 + fs^2)
where H, fc, tau and fs are the optical gain, DARM cavity pole, time delay and spring frequency. Some details of the derivation will be reported later. Apparently, we now have an additional quantity (i.e., fs) to fit.
Note that since H1 seems to be in (unintentionally) an anti-spring detuning, fs should be a real number whereas it should be an imaginary number for a pro-spring case. Obviously, Q is set to infinity for simplicity.
[MCMC-based numerical fitting]
Following the work by Evan (T1500553), we adapted his code to include the spring frequency as well. In short, it is a Bayesian analysis to obtain posteriors for the parameters that we want to estimate. We gave a simple set of priors as follows for this particular analysis.
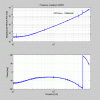
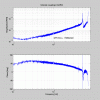
The quad plot below shows the fitting result. The estimated parameters are obtained by taking the mean values of the resutling probability distribution. As usual, the two plots on the left hand side show a bode plot of the measured and fitted data. The two plots on the right hand side show the residual of the fit. As shown in the residuals, there are several points which are as big as 20% in magnitude and 6 deg in phase below 10 Hz. Otherwise, the residual data points seem to be within 10-ish % and 4 deg. The code is attached in pdf format.
EDIT: I am attaching the actual code as well.
A detailed derivation of the new functional form can be found at https://dcc.ligo.org/LIGO-T1600278
EvanG noticed that we have unintentionally included high frequency poles in the previous analysis (28157). So we made the same fitting for the data with all the high frequency poles removed.
Here are the fitting results for the latest data:
Since the bode plot looks very similar to the one posted above, I skip showing it here. Observe that the time delay is now smaller than it was because we now don't have the high frequency poles.
C. Cahillane, K. Izumi I have added in a new term to our sensing function fit, an optical spring Q factor to gain back phase information. From the functional form f^2/(f^2 + f_s^2) we only get a magnitude correction from detuning, but we also expect detuning to slightly affect phase in the sensing function response. This can be clearly seen in lower right subplot Figure 1 of this comment, where Kiwamu originally plotted the full RSE sensing function. Here we see that when we have 1 degree of detuning we also have +1.5 degree phase difference at 10 Hz when compared to the sensing function without detuning. In the phase residual plot in the original post you can see this phase loss in the actual ER9 sensing measurement. In order to try and gain back some of this phase information, we have added in an additional term to the detuning function:f^2 f^2 ----------- ===> ----------------------- f^2 + f_s^2 f^2 + f_s^2 - i*f*f_s/Q
This adds another parameter to our fit, but lets us get back phase information lost to detuning. ********** Figure 2 shows Kiwamu's original fit parameters posted above in red alongside my new results in green. I argue that including the optical spring Q factor has improved the phase fit significantly. Quantitatively, here are the phase Χ-Square values:With Optical Spring Q Χ-Square = 85.104 Without Optical Spring Q Χ-Square = 819.28
********** I have modified Kiwamu's SensingFunction.ipynb into a SensingFunctionSimulation.ipynb which fits to both phase and magnitude of the sensing function. SensingFunctionSimulation.ipynb is attached as a zipped file in this aLOG and is also in a Git repo called RadiationPressureDARM owned by Kiwamu. Fit parameters:Optical gain = 9.124805e+05 +/- 8.152381e+02 [cnts/m] Cavity pole = 3.234361e+02 +/- 5.545748e-01 [Hz] Time delay = 5.460838e+00 +/- 3.475198e-01 [usec] Spring frequency = 9.975837e+00 +/- 5.477828e-02 [Hz] Spring Inverse Q = 1.369124e-01 +/- 3.522990e-03
(I choose to parametrize using inverse Q = Q^{-1} because Q^{-1} can be zero.)
WP 5984--Addressing a couple month old bug, see SEI log 989 for details. Summary: We had added a condition to turn off Damping if a platform trips but this code is common for HEPI and the ISI and the HEPI does not have a damping state so there was an error. This was reverted and Friday Arnaud added a conditional to the code that excluded the HEPI from this action; it was tested at LLO. I've updated the python code and restarted all the HPI nodes--no impact to the platforms. See attached for keystrokes. WP closed.
Duh, of course since the code is common, I actually need to restart all the SEI and ISI guardians as well. This has been done and the platforms were not affected--thanks guardian programmers! And thanks to Arnaud for pointing this out to me. The txt file attached has the restart record.
microphones | Vincent | calibration |
LVEA | Joe | batteries |
CR | Dale | tours at noon |
all buildings | Christina-Karen | cleaning |
all buildings | Fil | electorinics inventory |
all buildings | Joe-Sprague | spraying |
LVEA | Kyle | energizing turbo pumps |
all buildings | Huge | checking HEPI pumps |
EX and EY | JeffK | charge measurements |
EX and EY | Kyle | energise RGA filaments |
laser | Peter-Jason | take PSL offline |
LVEA | DavidM | physical measurements |
LVEA | Nutsinee |
swap TCS sled and drain AOM |
Since last alog:
in LVEA:
In end stations:
coming up:
Diodes 3/4 are seemingly kaput.
Filed FRS 5822.
Came in to find the laser was off due to the power watchdog being tripped. Both chillers were still running. I have turned the laser back on but it hasn't returned to where it normally returns to. Looking into what happened.
The laser tripped around 4:15 this morning.
Looks like the NPRO tripped out. Maybe due to a minor power surge due to the start of the week? Pre-modecleaner had some problems locking irrespective of the reference level. Found that a small tweak to the horizontal alignment brought things back right away. Note in passing: with no light the output of the locking photodiode was ~ +29 mV. Unlocked (ie with light incident on the pre-modecleaner) the output was ~ -230 mV. Which is sort of low, which might be consistent with a small mis-alignment. The locking photodiode is a 1 mm InGaAs photodiode after all.
The beam position on the test masses is estimated from the a2l gains from the last minimization (method explained in alog 22426)
The gains values before and after the mimization are attached in a2l_gains_1151366417.mat.
The corresponding beam positions are reported in each suspension base in the Fig.1 attached. We can see that the beam is not more off-centered than previously.
However, we can observe that the beam hits the ITM and ETM in differents vertical places now in each cavity, suggesting an increase of the beam tilts in PIT with respect to the optical axes (HARD PIT).
That is what I tried to represent with the projection in Fig. 2, where you can imagine the cavities facing you: the figure axis orientation is the ETMs coordinates orientation.
The YAW tilts are reduced in both cavities. But their directions were opposite before the a2l minimization whereas now both cavity axes have a negative YAW tilt (in the ETM coordinates).
I don't know when the script was run for the last time before that, but it could give an indication that the beam is now more tilted in HARD PIT at 40W, and it enters the cavities from the lower area of the ITMs.
Arm | Before a2l | After a2l |
X |
D pit = 1.3 mm D yaw = 9.4 mm |
D pit = 7.8 mm D yaw = 2.4 mm |
Y |
D pit = 2.3 mm D yaw = 6.5 mm |
D pit = 8.0 mm D yaw = 6.3 mm |
Sheila, Jenne, Haocun
We took measurements on the C/DHARD yaw Loops with low bandwidth last Friday.
We firstly turned on the new filter to move compensation peaks for C/DHARD Yaw, then turn off the boost to win more phase. The gain was then lowered to ~half (CHARD_Y: -0.7 ---> -0.3, DHARD_Y: 40 ---> 19), and the new cutoff filters can be turned on.
These steps has been added in the Guardian, and we took measurements with the low noise loop, as attached below.
Both of the UGF are about 3.5Hz at 40 W now, which were ~5Hz before.
Engineering Run 9 (ER9) will begin next Wednesday. Here are some important details for operations:
Please see https://wiki.ligo.org/LSC/JRPComm/ER9 for more details.
Filled CP3 at ~ 1:50 UTC , 6:50 PM LOCAL Time Sunday.
Opened valve 1/2 turn and observed liquid after 5 minutes, 15 seconds. Windy on site.
Thanks, John!
Jeff K, Darkhan
Summary
Three DQ channels need to be added to the H1SUSETMY front-end model:
H1:SUS-ETMY_L1_CAL_LINE_OUT_DQ
H1:SUS-ETMY_L2_CAL_LINE_OUT_DQ
H1:SUS-ETMY_LKIN_P_LO_DQ
Details
SUSETMY model (both at H1 and L1) was updated to use synchronized oscillators to inject calibration lines into L1, L2 and L3 actuation stages to track temporal variations in the strengths of the drivers (LHO alog 27733). An additional calibration line is injected through Lock In oscillator (see attached screenshot 1).
In order to analyze time-dependent calibration of the drivers we need the excitation signals to be stored in the frames.
Hopefully, we will update the H1SUSETMY model on next Tuesday, Jul 5, 2016.
Darkhan suggests these are the channels to use:
TST / L3 35.3 0.11 H1:SUS-ETMY_LKIN_P_LO_DQ
PUM / L2 34.7 1.1 H1:SUS-ETMY_L2_CAL_LINE_OUT_DQ
UIM / L1 33.7 11.0 H1:SUS-ETMY_L1_CAL_LINE_OUT_DQ
With his help, for the pcalmon SLM pipeline looking at these "new" frequencies here,
https://ldas-jobs.ligo-wa.caltech.edu/~gmendell/pcalmon_new_freqs/daily-pcalmonNavigation.html
the configuration is now set to:
set channelFrequencyList {H1_R,H1:SUS-ETMY_LKIN_P_LO_DQ,35.3aup;H1_R,H1:SUS-ETMY_L2_CAL_LINE_OUT_DQ,34.7aup;H1_R,H1:SUS-ETMY_L1_CAL_LINE_OUT_DQ,33.7aup;H1_R,H1:CAL-PCALY_EXC_SUM_DQ,35.3aup,34.7aup,33.7aup,331.9aup;H1_R,H1:CAL-DARM_ERR_WHITEN_OUT_DBL_DQ,35.3aup,34.7aup,33.7aup,331.9aup;H1_R,H1:CAL-DARM_CTRL_WHITEN_OUT_DBL_DQ,35.3aup,34.7aup,33.7aup,331.9aup;H1_R,H1:CAL-PCALY_TX_PD_OUT_DQ,35.3aup,34.7aup,33.7aup,331.9aup;H1_R,H1:CAL-PCALY_RX_PD_OUT_DQ,35.3aup,34.7aup,33.7aup,331.9aup;H1_R,H1:CAL-DELTAL_EXTERNAL_DQ,35.3aup,34.7aup,33.7aup,331.9aup;H1_HOFT_C00,H1:GDS-CALIB_STRAIN,35.3aup,34.7aup,33.7aup,331.9aup}
I've regenerated the SLM data for July 1. The suggested channels above do not yet exist, and SLM will put 0's in for these until they do.
These new channels has now been added to the frames. See LHO aLOG 28156
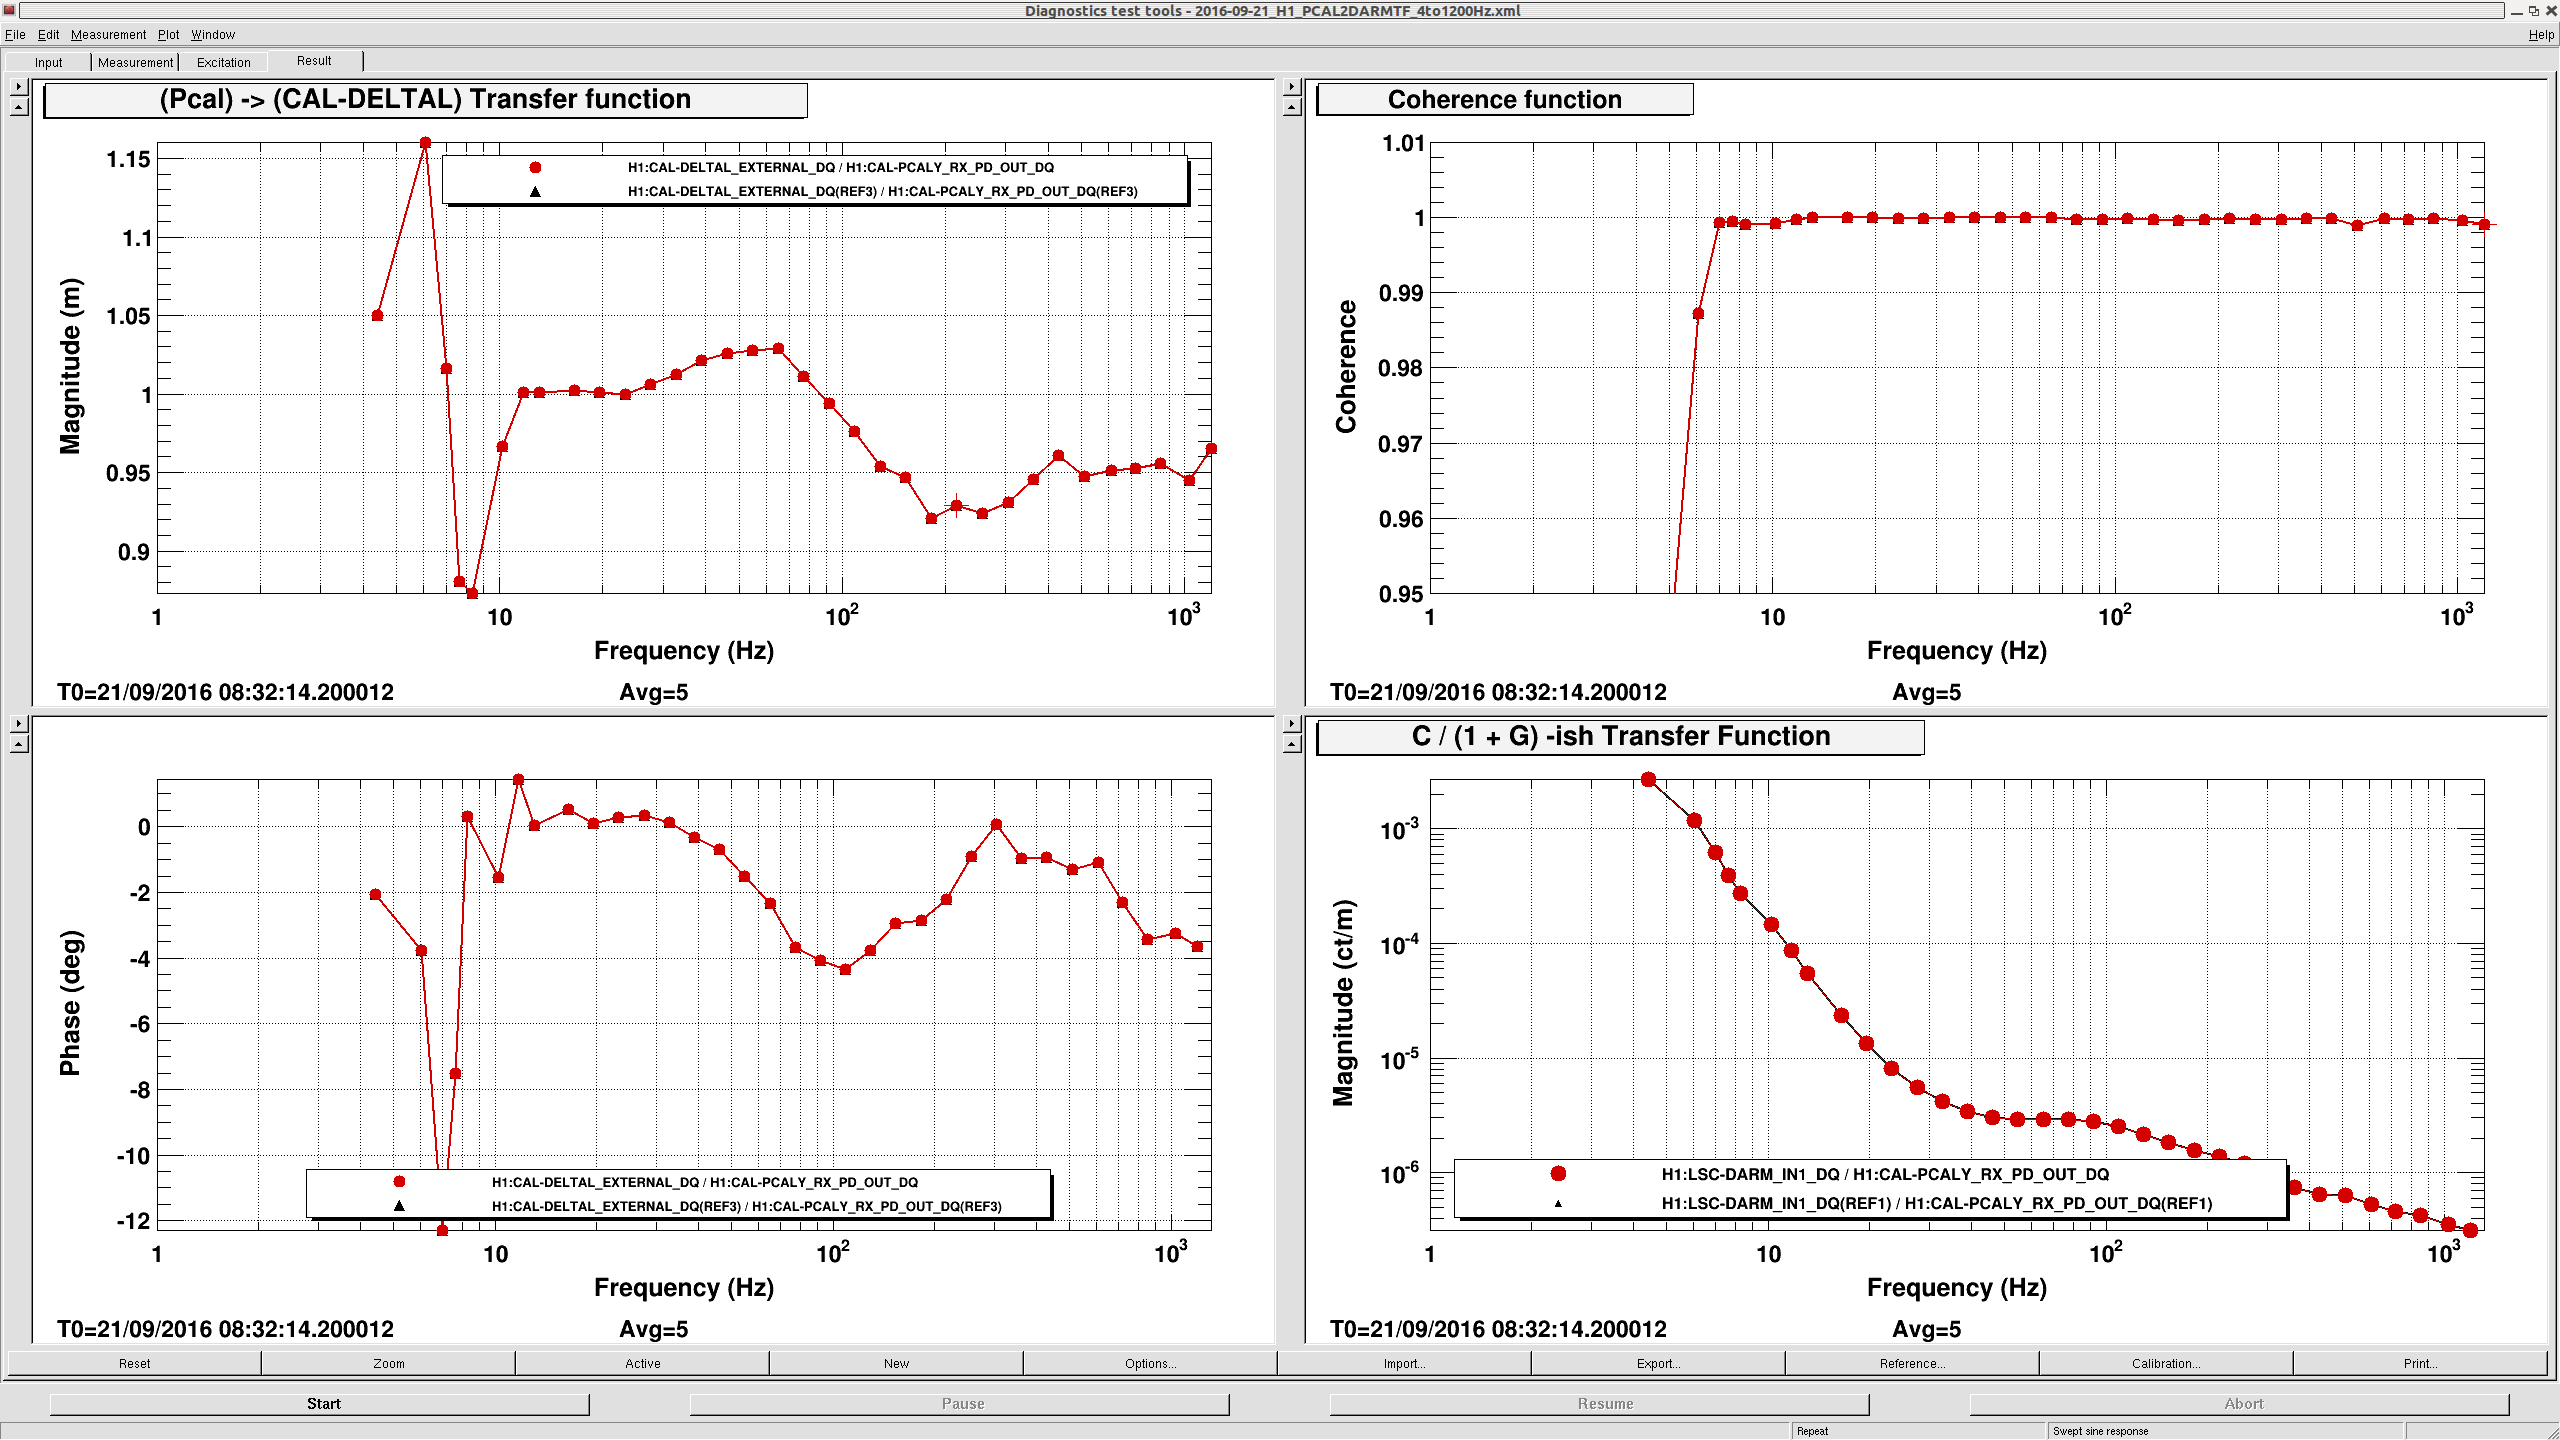
J. Kissel, J. Driggers, T. Shaffer, D. Tuyenbayev, E. Goetz, K. Izumi Over two ~1-2 hour lock stretches, I've managed to get the measurements needed for a baseline calibration update for ER9. Complete success! We'll work on the data analysis tomorrow, but I list the locations where all measurements have been committed to the CAL repo below. Of particular notes for the configuration of the IFO while doing these measurements: - The OMC DCPDs have *no* stages of whitening employed. We've decreed that given the unknown success rate of PI damping over the next few days, it's more robust to leave the whitening off. We're not gaining too much in the high frequency end of the sensitivity anyways. - All suspensions, including ETMY, have had their PUM stage switched to "Acq ON, LP OFF," i.e. state 2, or the highest range (i.e. not low noise). After some digging, Jenne found this was changed for some reason about a month ago, and maybe a setting that got lost in the power outage or something. I don't think either of these seemingly detrimental configurations are all that bad for ER9, given the bigger sensitivity issues elsewere. Also note, in order to break the correlations we've found in O1 data between measurements of Actuation Stage Strength (see e.g. LHO aLOG 28096), I've taken an independent PCAL2DARM sweep for every isolation stage. Measurements needed for Sensing Function: /ligo/svncommon/CalSVN/aligocalibration/trunk/Runs/PreER9/H1/Measurements/PCAL/ 2016-07-01_H1_PCAL2DARMTF_4to1200Hz_SRCTuned.xml Exported as: 2016-07-01_PCALY2DARMTF_4to1200Hz_A_PCALRX_B_DARMIN1_coh.txt 2016-07-01_PCALY2DARMTF_4to1200Hz_A_PCALRX_B_DARMIN1_tf.txt /ligo/svncommon/CalSVN/aligocalibration/trunk/Runs/PreER9/H1/Measurements/DARMOLGTFs/ 2016-07-01_H1_DARM_OLGTF_4to1200Hz_SRCTuned.xml 2016-07-01_H1_DARM_OLGTF_4to1200Hz_A_ETMYL3LOCKIN2_B_ETMYL3LOCKIN1_tf.txt 2016-07-01_H1_DARM_OLGTF_4to1200Hz_A_ETMYL3LOCKIN2_B_ETMYL3LOCKIN1_coh.txt 2016-07-01_H1_DARM_OLGTF_4to1200Hz_A_ETMYL3LOCKIN2_B_ETMYL3LOCKEXC_tf.txt 2016-07-01_H1_DARM_OLGTF_4to1200Hz_A_ETMYL3LOCKIN2_B_ETMYL3LOCKEXC_coh.txt Measurements needed for Actuation Function: /ligo/svncommon/CalSVN/aligocalibration/trunk/Runs/PreER9/H1/Measurements/FullIFOActuatorTFs/ 2016-07-01_PCALYtoDARM_FullLock_L1.xml 2016-07-01_H1SUSETMY_PCALYtoDARM_ForL1Drive_FullLock_tf.txt 2016-07-01_H1SUSETMY_PCALYtoDARM_ForL1Drive_FullLock_coh.txt 2016-07-01_H1SUSETMY_L1toDARM_FullLock.xml 2016-07-01_H1SUSETMY_L1toDARM_State1_FullLock_tf.txt 2016-07-01_H1SUSETMY_L1toDARM_State1_FullLock_coh.txt 2016-07-01_PCALYtoDARM_FullLock_L2.xml 2016-07-01_H1SUSETMY_PCALYtoDARM_ForL2Drive_FullLock_tf.txt 2016-07-01_H1SUSETMY_PCALYtoDARM_ForL2Drive_FullLock_coh.txt 2016-07-01_H1SUSETMY_L2toDARM_FullLock.xml 2016-07-01_H1SUSETMY_L2toDARM_State2_FullLock_tf.txt 2016-07-01_H1SUSETMY_L2toDARM_State2_FullLock_coh.txt 2016-07-01_PCALYtoDARM_FullLock_L3.xml 2016-07-01_H1SUSETMY_PCALYtoDARM_ForL3Drive_FullLock_tf.txt 2016-07-01_H1SUSETMY_PCALYtoDARM_ForL3Drive_FullLock_coh.txt 2016-07-01_H1SUSETMY_L3toDARM_LVLN_LPON_FullLock.xml 2016-07-01_H1SUSETMY_L3toDARM_LVLN_LPON_FullLock_tf.txt 2016-07-01_H1SUSETMY_L3toDARM_LVLN_LPON_FullLock_coh.txt
J. Kissel, E. Goetz Just to post a status report before I disappear for the 4th, Evan and I have used Evan's new infrastructure to produce a model of the DARM open loop gain and sensing function from the above measurement. As one can see, there's still some work to do cleaning up the systematics in the model, but we're close. There're several things that are immediately evident: - We have not changed the model's optical gain value from O1, so it's not terribly surprising that the optical gain model is high by 20%. - There is total and obvious detuning. So much so, that I think this is what's causing the severe drop in open loop gain. - The drop in open loop gain is pretty nasty -- it causes sharp gain peaking at 10 Hz (as shown by the screenshot of the DTT template). Kiwamu's working on a fitting routine that is similar to Evan's MCMC results from O1 (see T1500553), but advancing those results to include the effects of detuning so that we can add this to the model. Stay tuned! Lots of work to do before Wednesday!
Evan G., Jeff K.
I processed the suspension actuation coefficients for the L1, L2, and L3 stages using the preliminary DARM model based on the one used during O1. We know that there need to be some modifications made, but the take home message here is that the actuation coefficients are about as to be expected. All are within ~5% of their O1 values. See attached figures.
The first attachment shows the UIM stage actuation coefficient. We have not yet included the BOSEM inductance and we have not yet included any actuator dynamics, so there is remaining discrepancy above ~20 Hz. There also appears to be some sort of phase wrapping issue that we still need to sort out.
The second attachment shows the PUM stage actuation coefficient. Things look pretty good here, although there may be some fluctuating optical gain which we have not yet accounted for in the measurement.
The third attachment shows the TST stage actuation coefficient. Again, there may be some fluctuating optical gain not accounted for in the measurement, and there is a phase wrapping issue to be sorted out.
Next on the agenda is to sort out the above issues and establish the actuation coefficients for the ER9 run.
The sensing function attached above includes uncompensated high frequency poles from the whitening chassis and the transimpedence amplifier, so there will be some delay assocated with these values.
To see only the optical response, we have removed these high frequency poles, as well as the analog AA and digital AA transfer functions, in the attached data file.
Between yesterday and today, Gerardo and I successfully bonded the ears to core optic mass ETM15, destined for LLO for post-O1 eventual replacement.
Ear s/n 195 bonded to S3 flat of mass June 29, 2016
Ear s/n 196 bonded to S4 flat of mass June 30, 2016
The first ear (s/n 195) has a series of bubbles along it's edge, but the surface area of these do not add up to more than the allowed amount as per E1000277, so it passes, see pix attached.
The second ear (s/n 196) has no bubbles and is nice full bond.
Inspection of the bonds this morning showed no change to the nice S4/Ear surface bond.
The small edge bubbles along the S3 Ear have migrated a bit (not worse, just moved a bit). Therefore, we decided to rewet the edge with solution to see if it would wick in and close some of the bubbles. This worked to close one of the larger bubbles, but one bubble continued to morph so we'll reinspect Monday. Note, none of the sizes of the bubbles got bigger, so the surface area of the bubble total remains the same and below spec.
Attached is a picture of what the bubbles in the ETM15 S3 Ear bond look like today (recall, it was bonded last Wed so it has now been over 5 days since initial bond). Apparently over the weekend, the bubbles ran inbound a bit further. I estimate the surface are of the bubbles to be near 20mm sq., still under the 50mm sq. spec. E1000278, although it isn't pretty. I measured the longest streaks to be almost 3mm long, with a width of 0.4mm. There are no bubbles inward from the edge near the center - anything shown in the picture is a camera reflection.
The S4 Ear bond looks unchanged from inspection last week, very good bond, very little bubbles.
Pictures of this ear bond taken by Danny at LLO just before use at LLO, indicate that the bubbles have not changed shape or size since the picture attached July 2016. Phew, said both Gerardo and I.