corey.gray@LIGO.ORG - posted 16:14, Saturday 05 November 2016 (31239)
Ops Day Shift Summary
TITLE: 11/05 Day Shift: 15:00-23:00 UTC (08:00-16:00 PST), all times posted in UTC
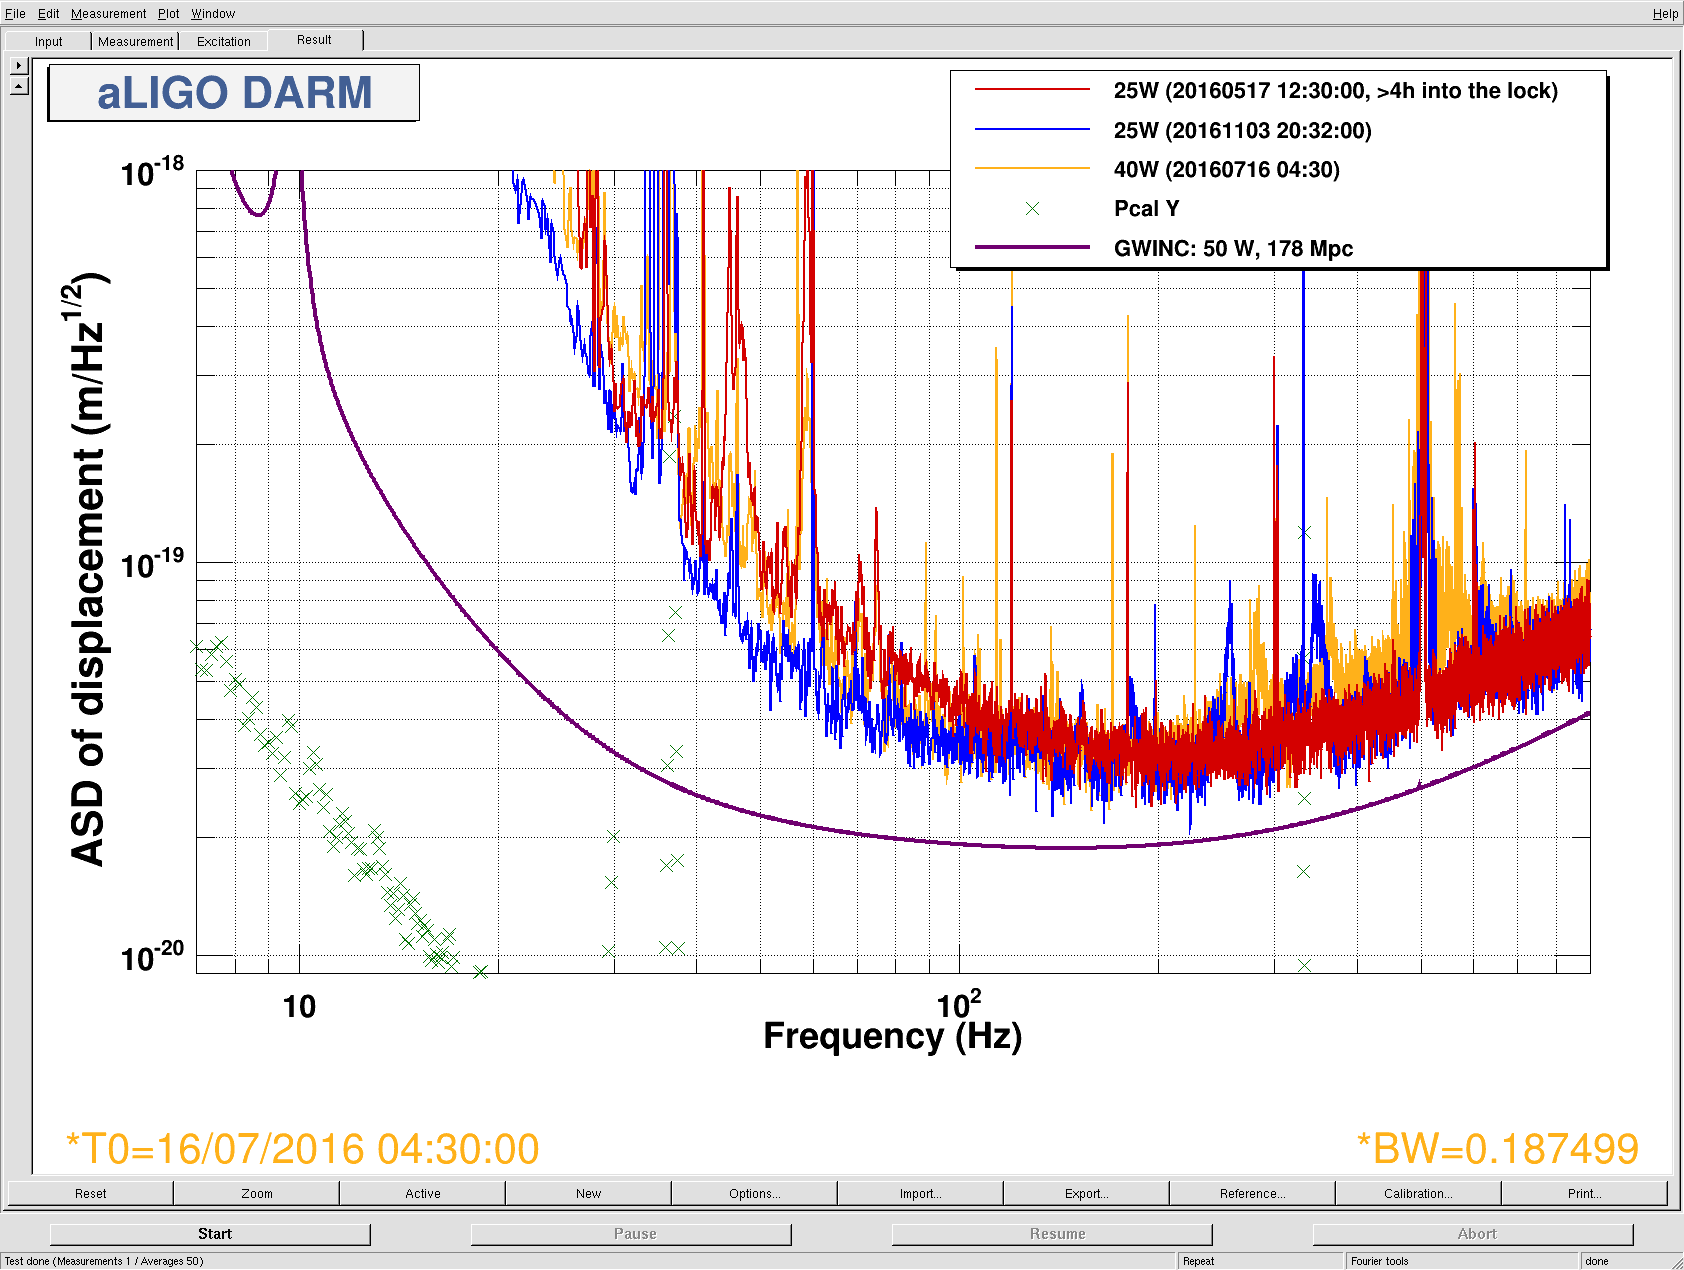
STATE of H1: Observing at 68.2743Mpc
INCOMING OPERATOR: Travis
SHIFT SUMMARY:
H1 locked most of the shift and getting back to NLN wasn't too tough (other than a Beam Diverter issue, which is noted below).
LOG:
- Bubba on-site checking for possible water leaks.
- 16:17 Robert checking out REFL DC pd (thought he could break lock, but he did not.)
- 16:53 Topped off PSL Chiller (Corey)
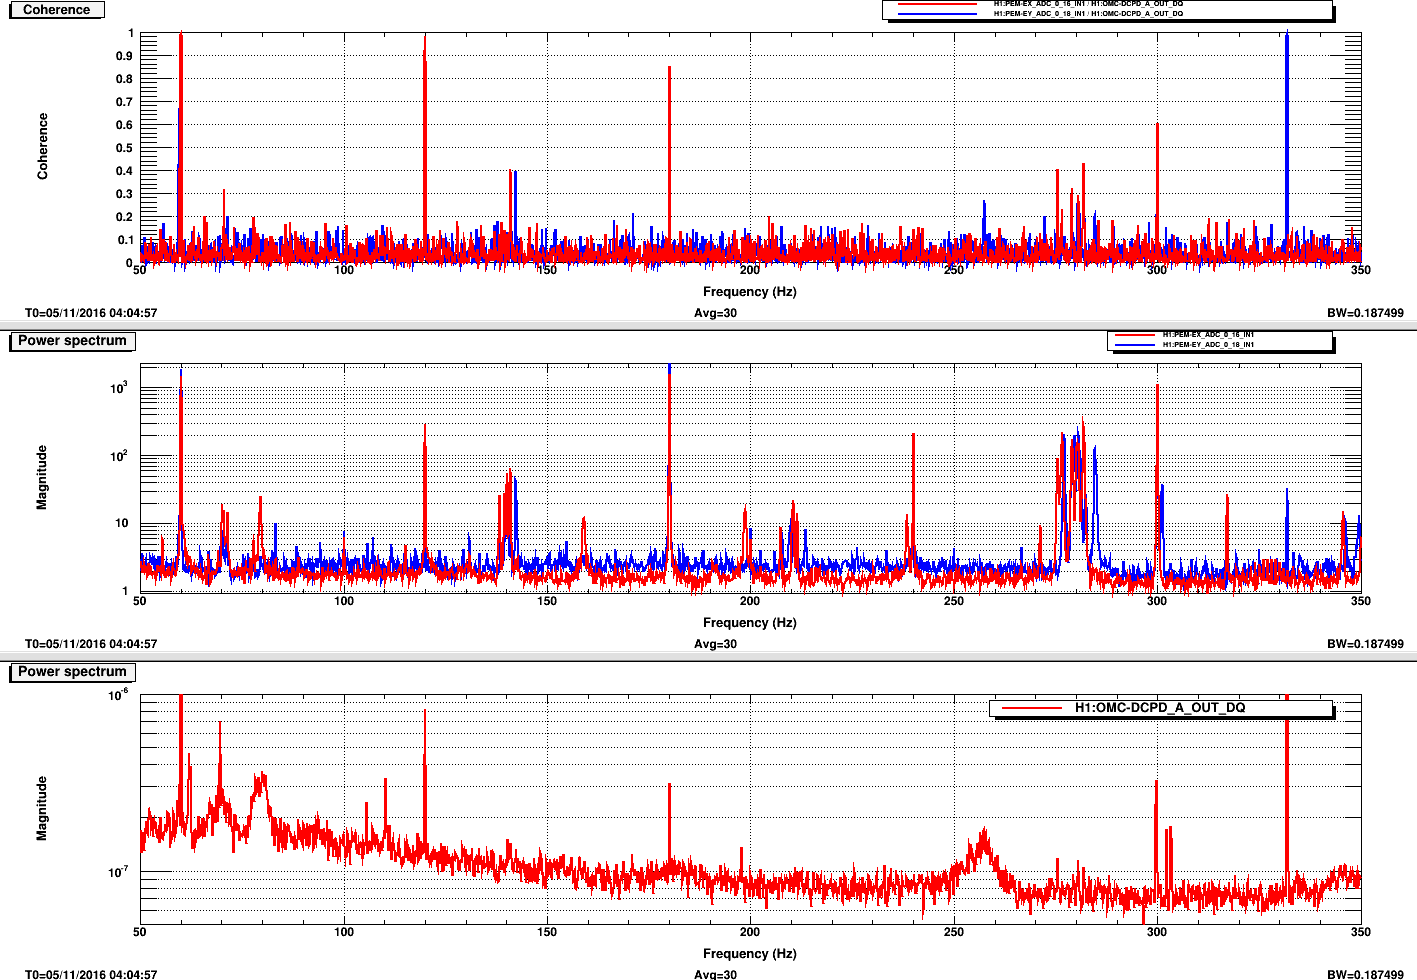
- 17:37 Robert heading to End Stations for PEM Injections
- 17:54 I forgot to drop us out of Undisturbed/Observing & we went to Commissioning at this time. Really, Commissioning should have been set at 16:17!
- Phone at EY not working
-
19:09 Transitioning SEI to WINDY NO BRS X since Robert just arrived at EX. Have started receiving EX & EY saturations while I was on the phone with Robert and just after I made this transition. We are at hight useism (which is new). So yeah, it appears without the BRS & this high useism that H1 becomes pretty glitchy.
- NOTE: I forgot to turn off the BRS for Y when Robert was at EY! Did not receive any EX/EY saturations when he was down there.
- 19:24 SEI Transistioned back to WINDY by Robert at EX.
- 19:53 Went to UNDISTURBED/OBSERVING, but quickly un-did that because Robert said so.
-
20:38 Lockloss. When coming back up, Diag_main mentioned X-arm fiber polarization above 20%
- Stuck in Locking ARMS Green with a "waiting for arms to settle". ALS X was stuck around 0.8...touched it up to 0.98 by tweaking the TMSX in yaw & this got us to move on.
- Sheila just happened to walk in and I mentioned this to her, and she said we should just change the value Guardian waits for here (0.9 something) since we have lowered the laser power.
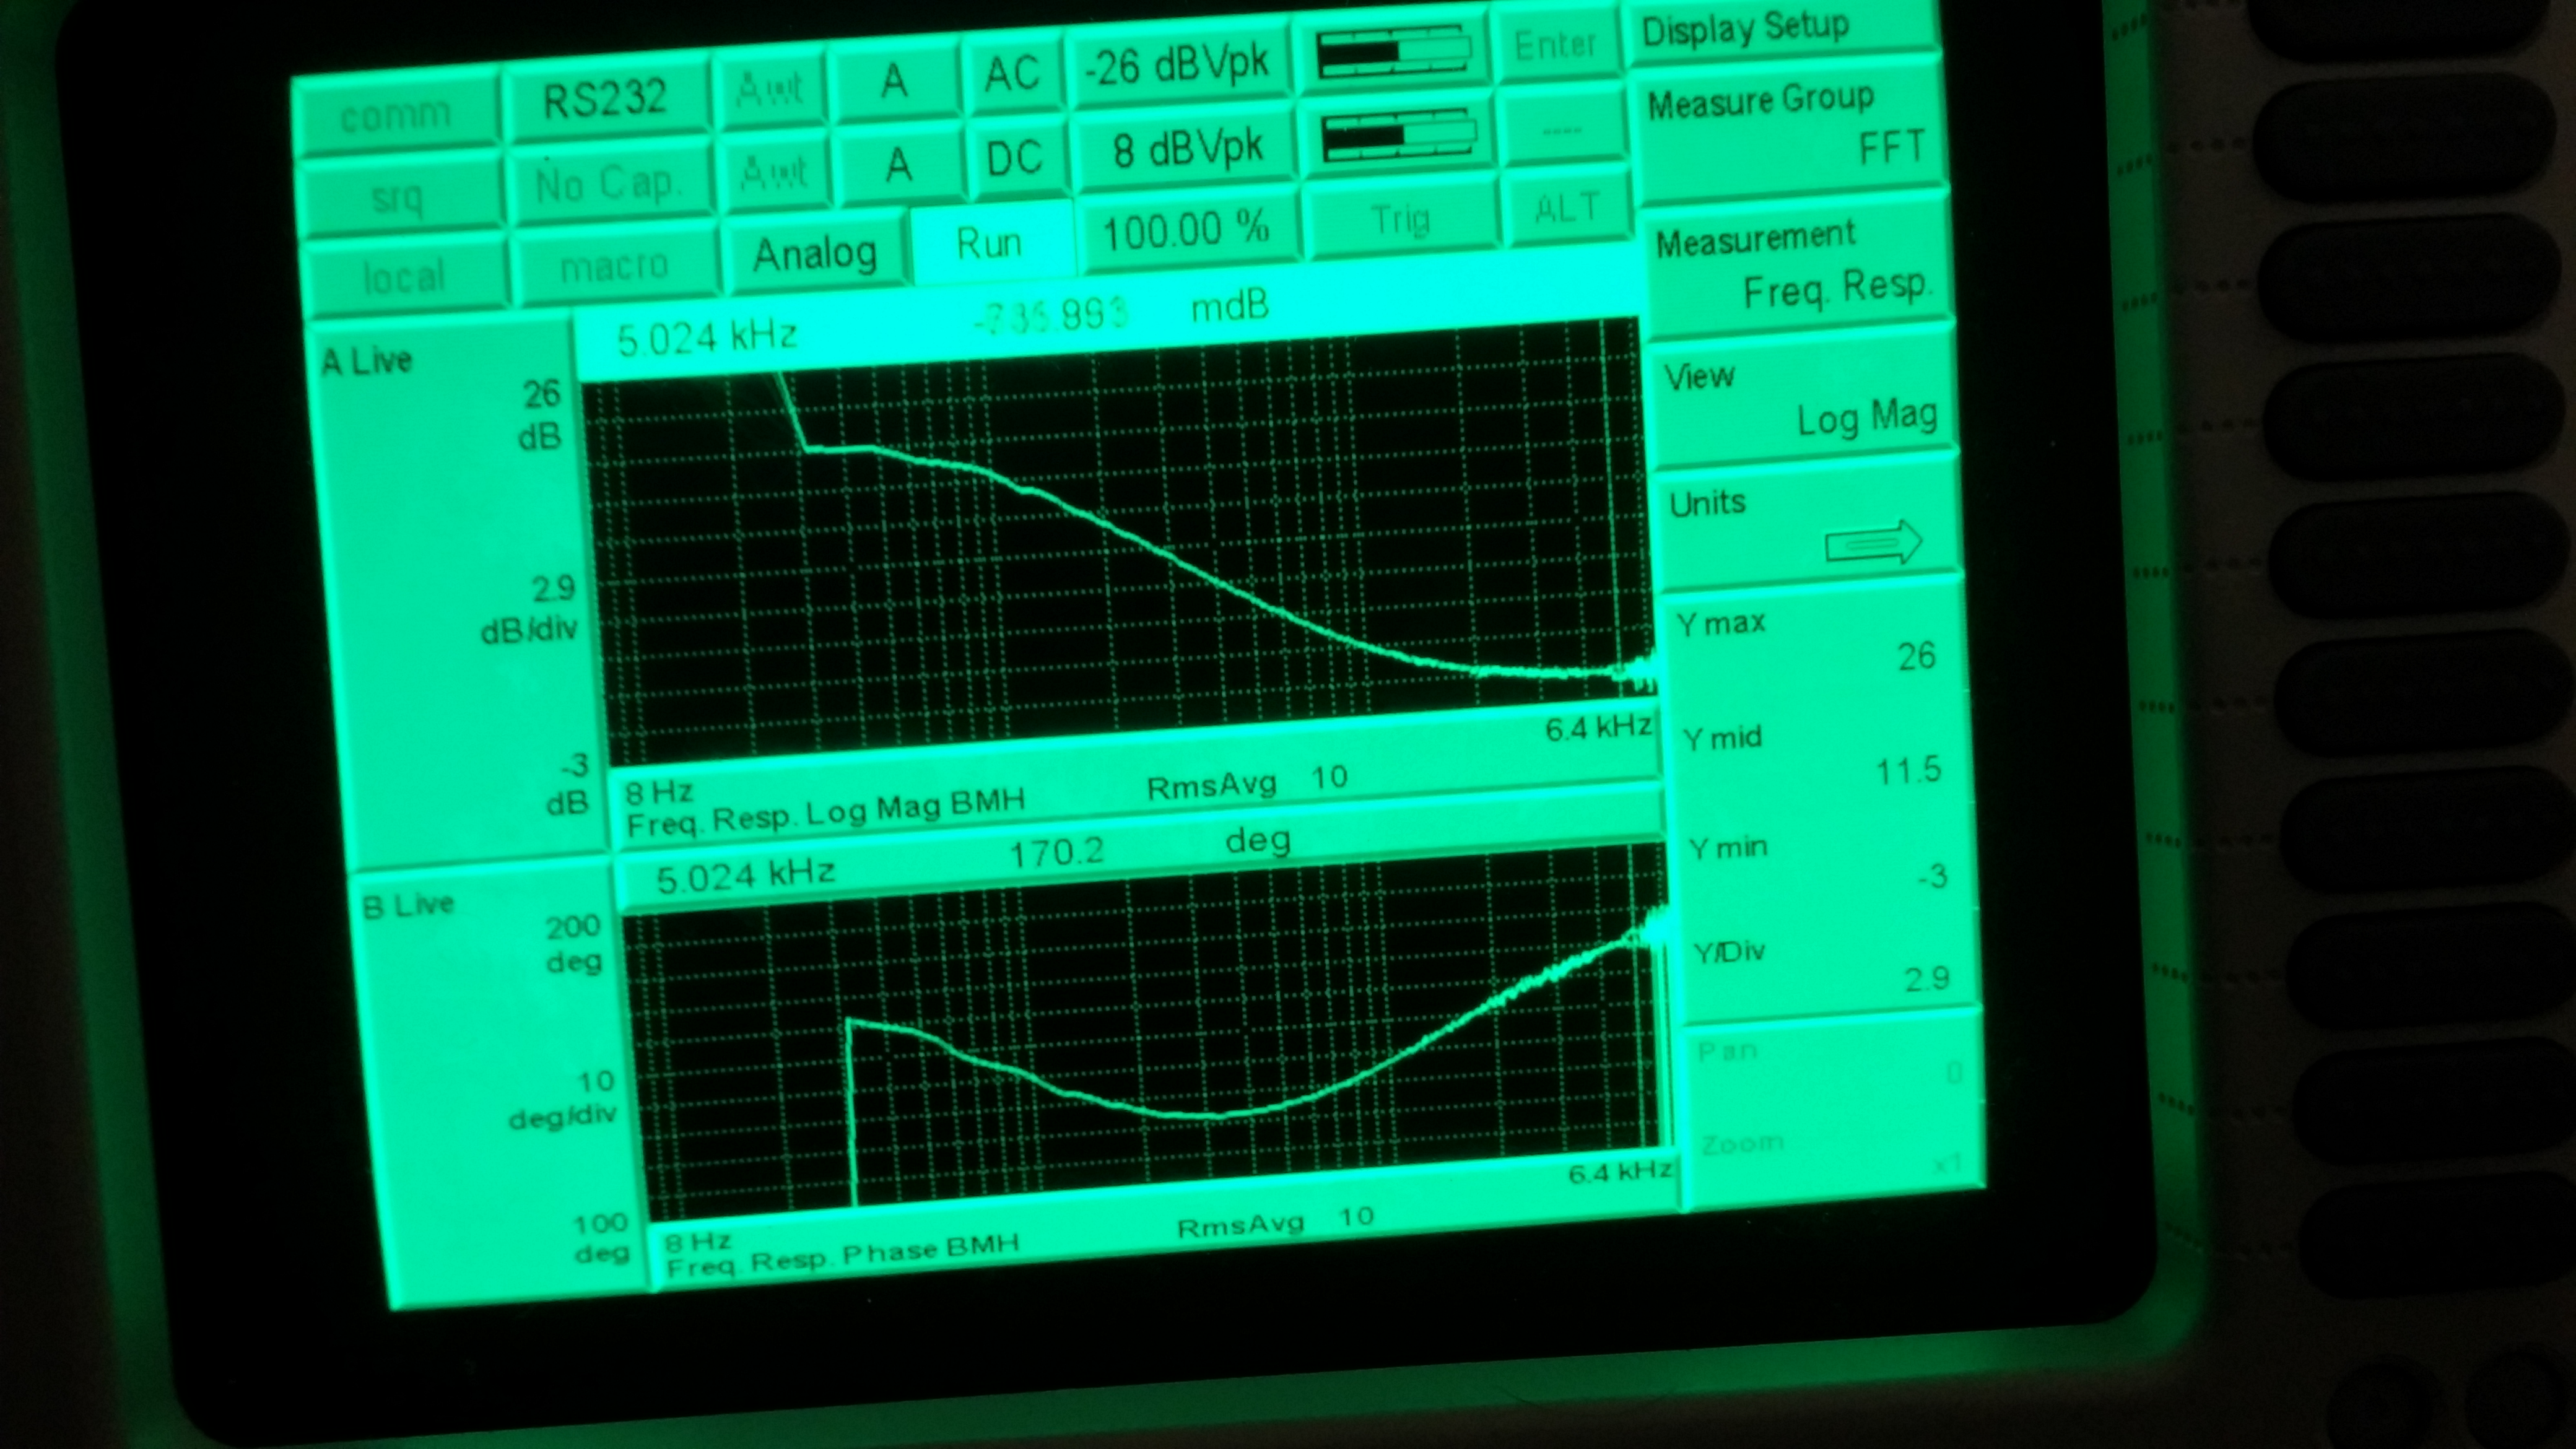
- 21:08 Sheila is now taking H1 to look at IMC WFS.
- 22:42 - 22:46 Running A2L (...LHO.py)
- 22:47 - Running A2L (...PR2.py)
- 22:4 - Running A2L (...PR3.py)
- PI Mode 28 rung up. Took phase from 180 and eventually to 110 & it's looking good.
- Handing off a locked at NLN H1 to Travis (range is hovering around 73Mpc).
-
Oh, we lost lock during acquisition earlier due to the Beam Diverters (this is related to what PDs we were using between acquisition & low noise). To get past this, I:
- went to NOISE_TUNINGS
- Go to MANUAL
- Select REDUCE_RF9_MODULATION_DEPTH (skipping Close Beam Diverters step)
- Then hit AUTO after the above step is green/complete
NOTE: Bubba would like a rough idea of # of people here between now and tomorrow. (we had 2-3 people most of the day)
Thanks, David---Just heard back from Duncan. A few things for me & for all operators (tagging this alog with OpsInfo) with regards to Service Issues With Summary Pages:
I have posted a note to myself to update the 'Report an issue' URL to point to https://git.ligo.org/detchar/ligo-summary-pages/. If in doubt, an email to detchar@ligo.org is best, to cast a wide net.
I'd suggest posting the detchar group email, too. Or atleast tag these pages with detchar in some way, because my old memory only knows these pages as the "Summary Pages" & I don't see any mention of Detchar on the pages...well, I guess I do see it in the web address name. Just want an easy/quicker way to address this in the future.
Perhaps we can add "check the Summary Pages" as an item in our Operator Shift Check Sheet?