Jeff, Darkhan, Kiwamu,
This is a quick report; some more details will be reported tomorrow.
We started a preparation work to update the CAL CS front end model. We have created a new version of the matlab script that populates the actuator functions (21322). The new script can be found at
/ligo/svncommon/CalSVN/aligocalibration/trunk/Runs/ER10/H1/Scripts/CALCS/quack_eyresponse_into_calcs.m
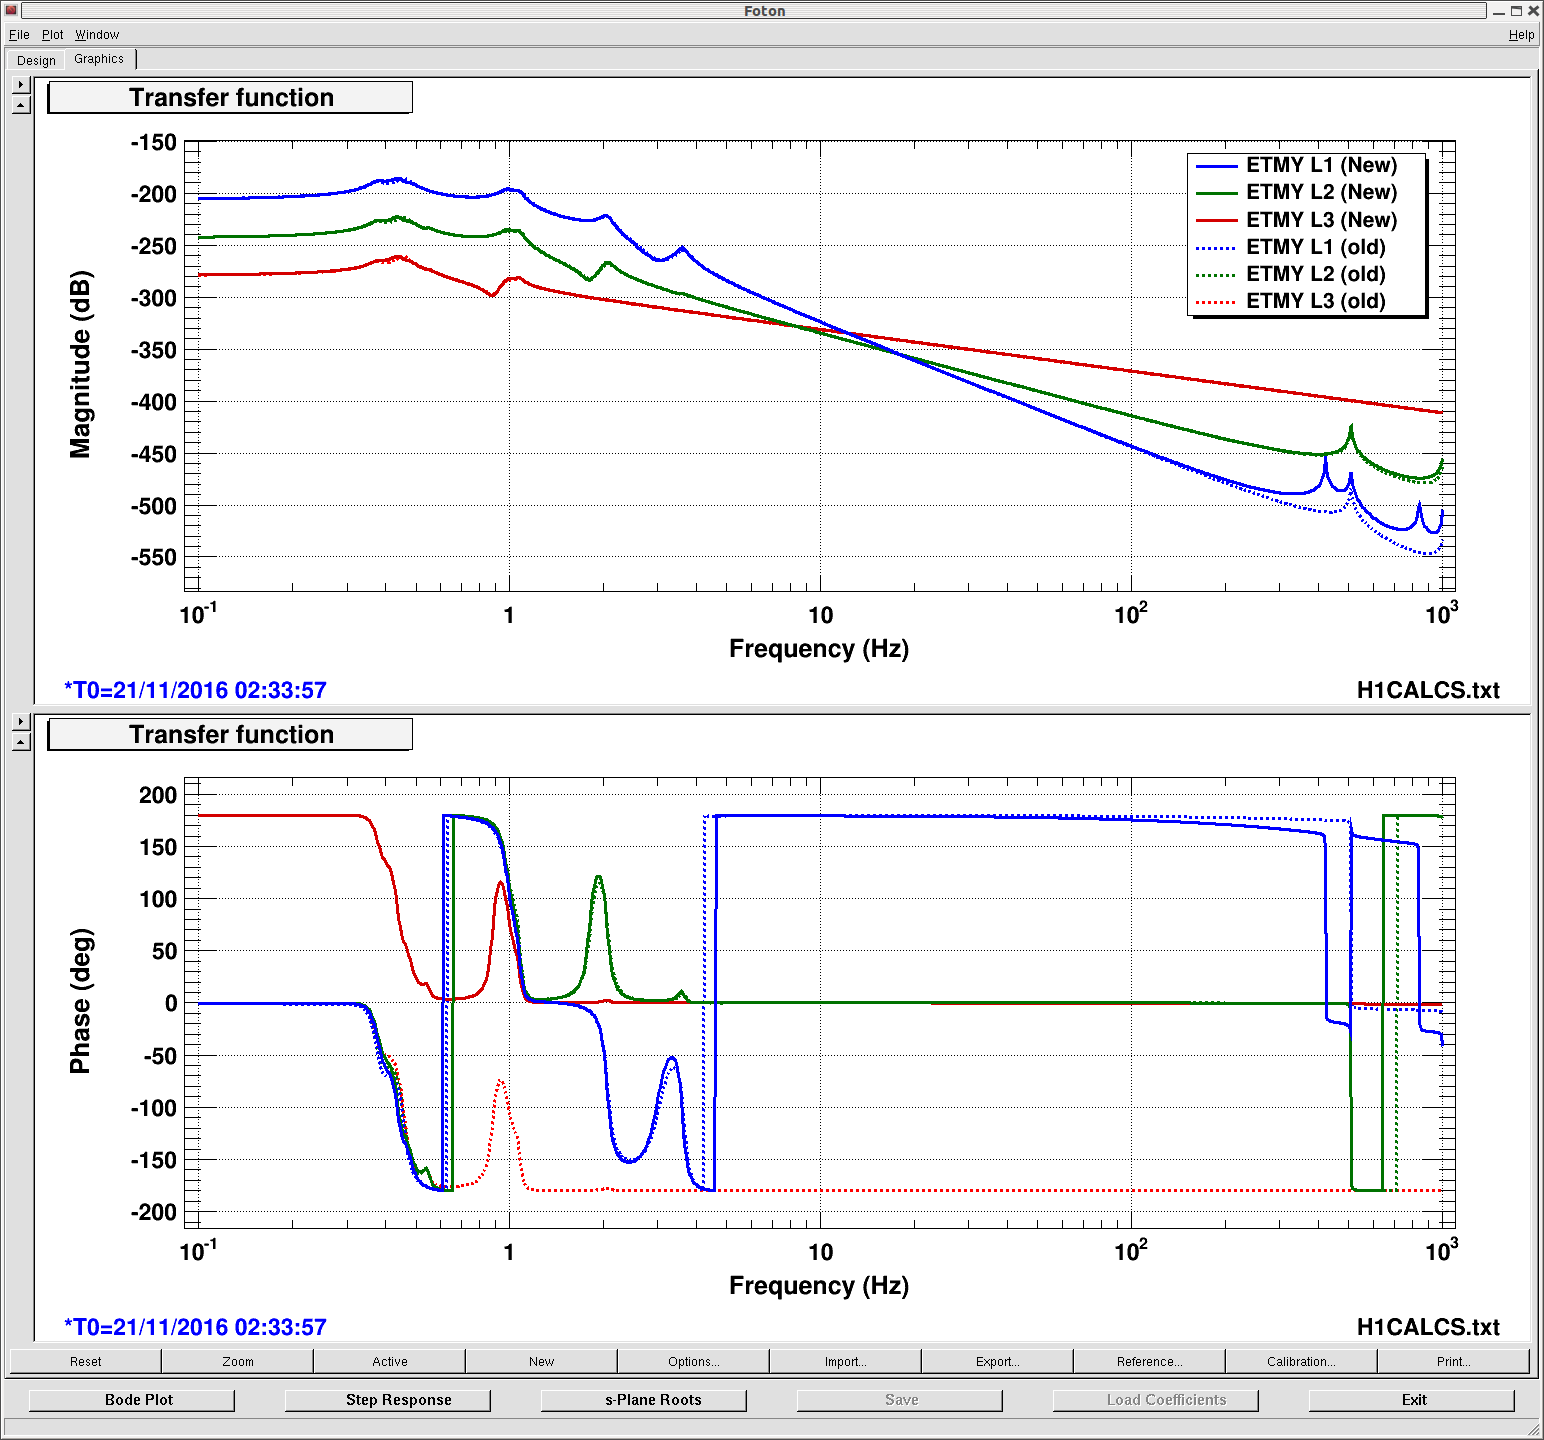
We made some tunings to get the script running without making autoquack unhappy. We didn't update the actual foton filters for ETMY today although we made changes on the ITMY CALCS filters as tests. The attached is a first glance at the actuation functions in comparison to the O1 actuation functions. No surprise so far, except that the L3 stage had a different sign now. This will be followed up.
Here is a summary of the activities including yesterday's and today's.
We have ...
- Adopted some matlab scripts as reported above and also below.
- Made the actual changes on the foton file namely H1CALCS.txt
- Loaded the new filters this morning at Nov. 21 18:24 UTC
This means that we have completed the update of the new suspension filters in CALCS.
[The new CALCS actuator functions]
-
It now uses the latest suspension tag model that Jeff updated 10 days ago (31432).
- The latest includes the oplev damping.
- Also, as shown in the attached screenshot in the above entry, the latest have slight difference around 1 Hz and some difference above 100 Hz.
More explicitly, the suspensions are extracted from the tagged model,
/ligo/svncommon/CalSVN/aligocalibration/trunk/Common/externals/SUSdynamModelTags/quadmodelproduction-rev8274_ssmake4pv2eMB5f_fiber-rev3601_h1etmy-rev7915_released-2016-11-11.mat
which is specified in H1's parameter file at:
/ligo/svncommon/CalSVN/aligocalibration/trunk/Runs/ER10/H1/params/H1params.conf
The DC values for the suspensions came a bit different than what Darkhan reported (31677) by a subpercent level. The matlab code reported the following values.
Ku = 8.1642e-08 N/ct
Kp = 6.8412e-10 N/ct
Kt = -4.3891e-12 N/ct
We will double check with Darkhan to see what actually affected these values even thought the discrepancies aren't significant.
[Adjustment for quacking the filters]
When running the matlab script
/ligo/svncommon/CalSVN/aligocalibration/trunk/Runs/ER10/H1/Scripts/CALCS/quack_eyresponse_into_calcs.m
to update the actuator functions in CALCS, we ran into some problems for which we spent almost a day. This is a summary of what we encountered and how we mitigated.
-
Issue 1: too many SOS sections in the TST stage
- The TST stage ended up with too many SOS sections when using the latest tag model.
- We relaxed the tolerance for minreal from 6e-5 to 1e-3 as a mitigation.
-
Issue 2: violins not compatible with biquad form
- Depending on the cut off frequency for excluding fine structures, quackcheck often reported a 0-gain error.
- It turned out that this happens when the SOS filter coefficients don't have a b0i. We could not come up with a good mitigation.
- We decided to set the cut off frequencies individually so that we can let all of them survive. The good values we found were: UIM cutoff = 1600 Hz and PUM cutoff = 2000 Hz.
-
Issue 3: autoquack occasionally runs into a steady failure mode
- Autoquack occasionally enters a situation where it keeps reporting BAD filter implementation for some reason.
- We empirically found that we can get out of the situation by manually installing a simple and fake zpk filter once (e.g. zpk([], [], 19, "n") or similar ) at the filter module having the issue.
-
Issue 4: c2d and minreal return some bad filters
- c2d and minreal occasionally returned filters that are bad for quack (such as the number of zeros exceeding the number of poles).
- This, for some reason, can be mitigated by running the script again.
Otherwise, we didn't change the code and therefore it did the processes that are describd in detail at 21322.
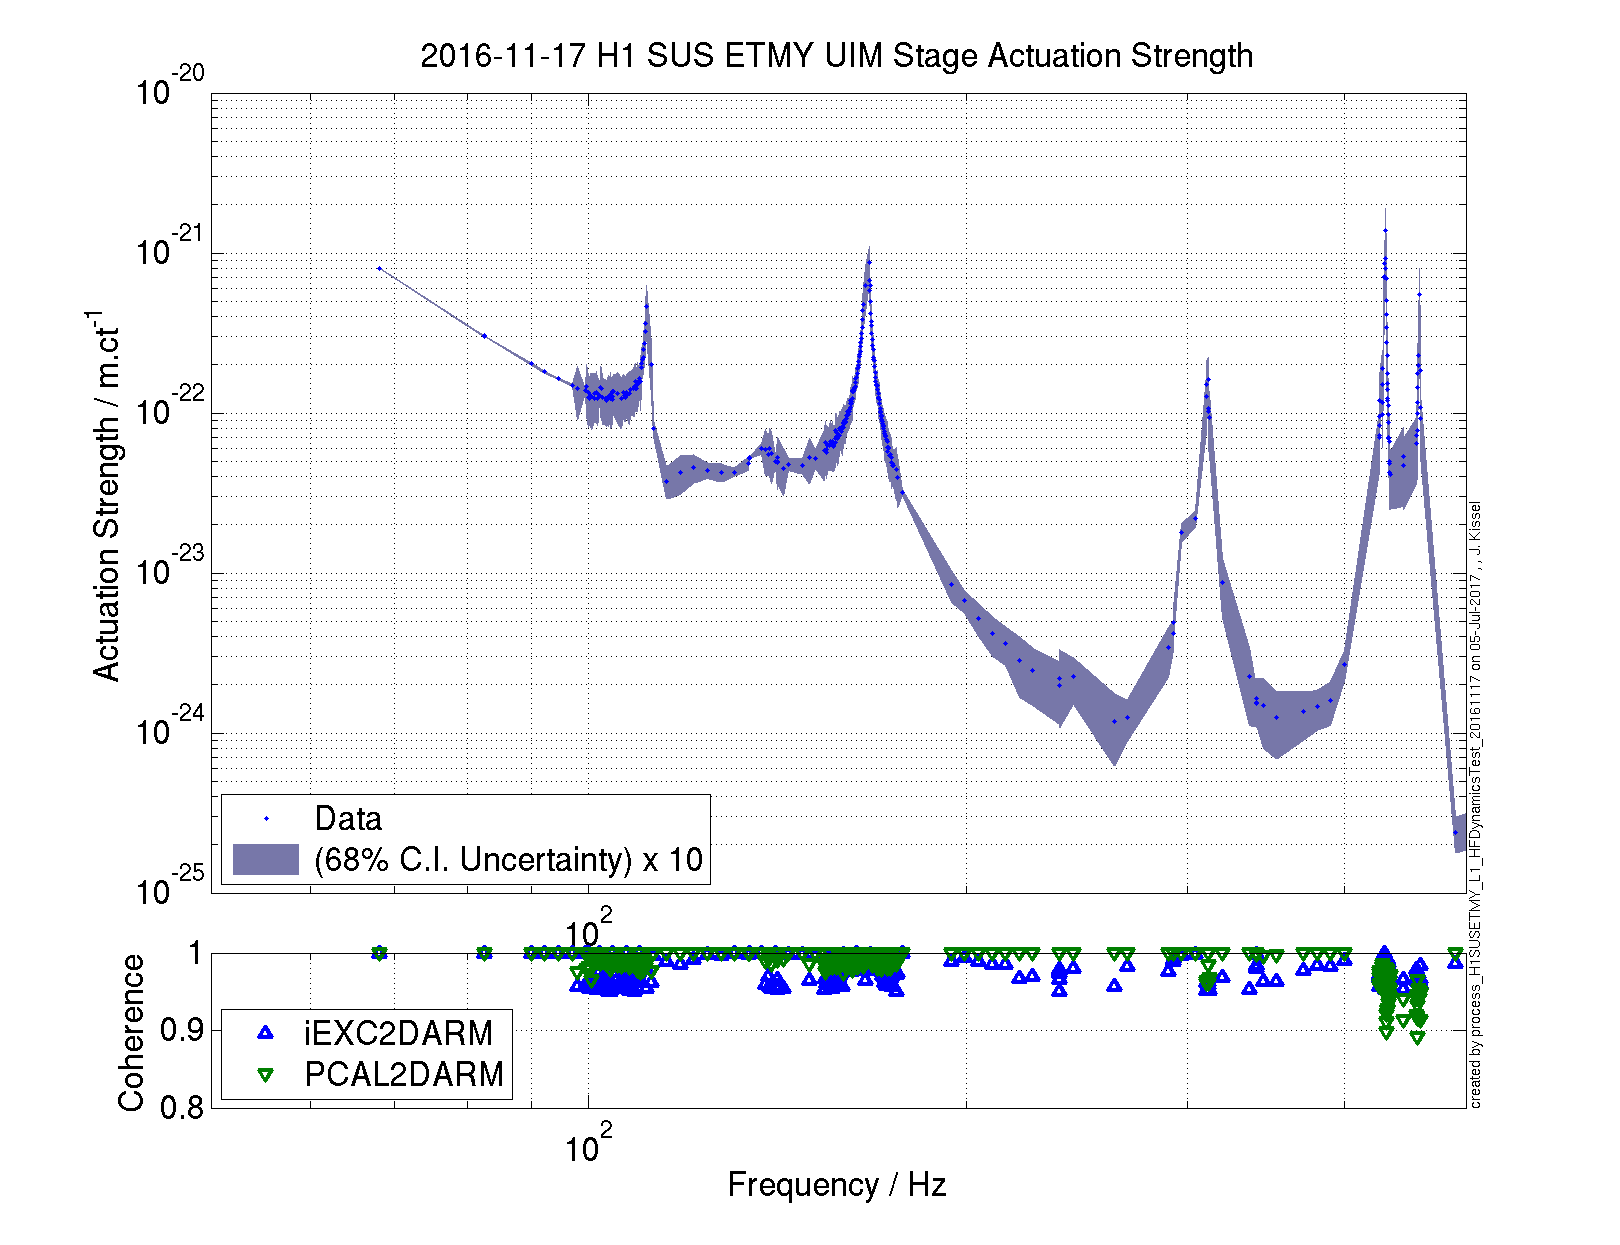
[Accuracy of the actuation functions in CALCS]
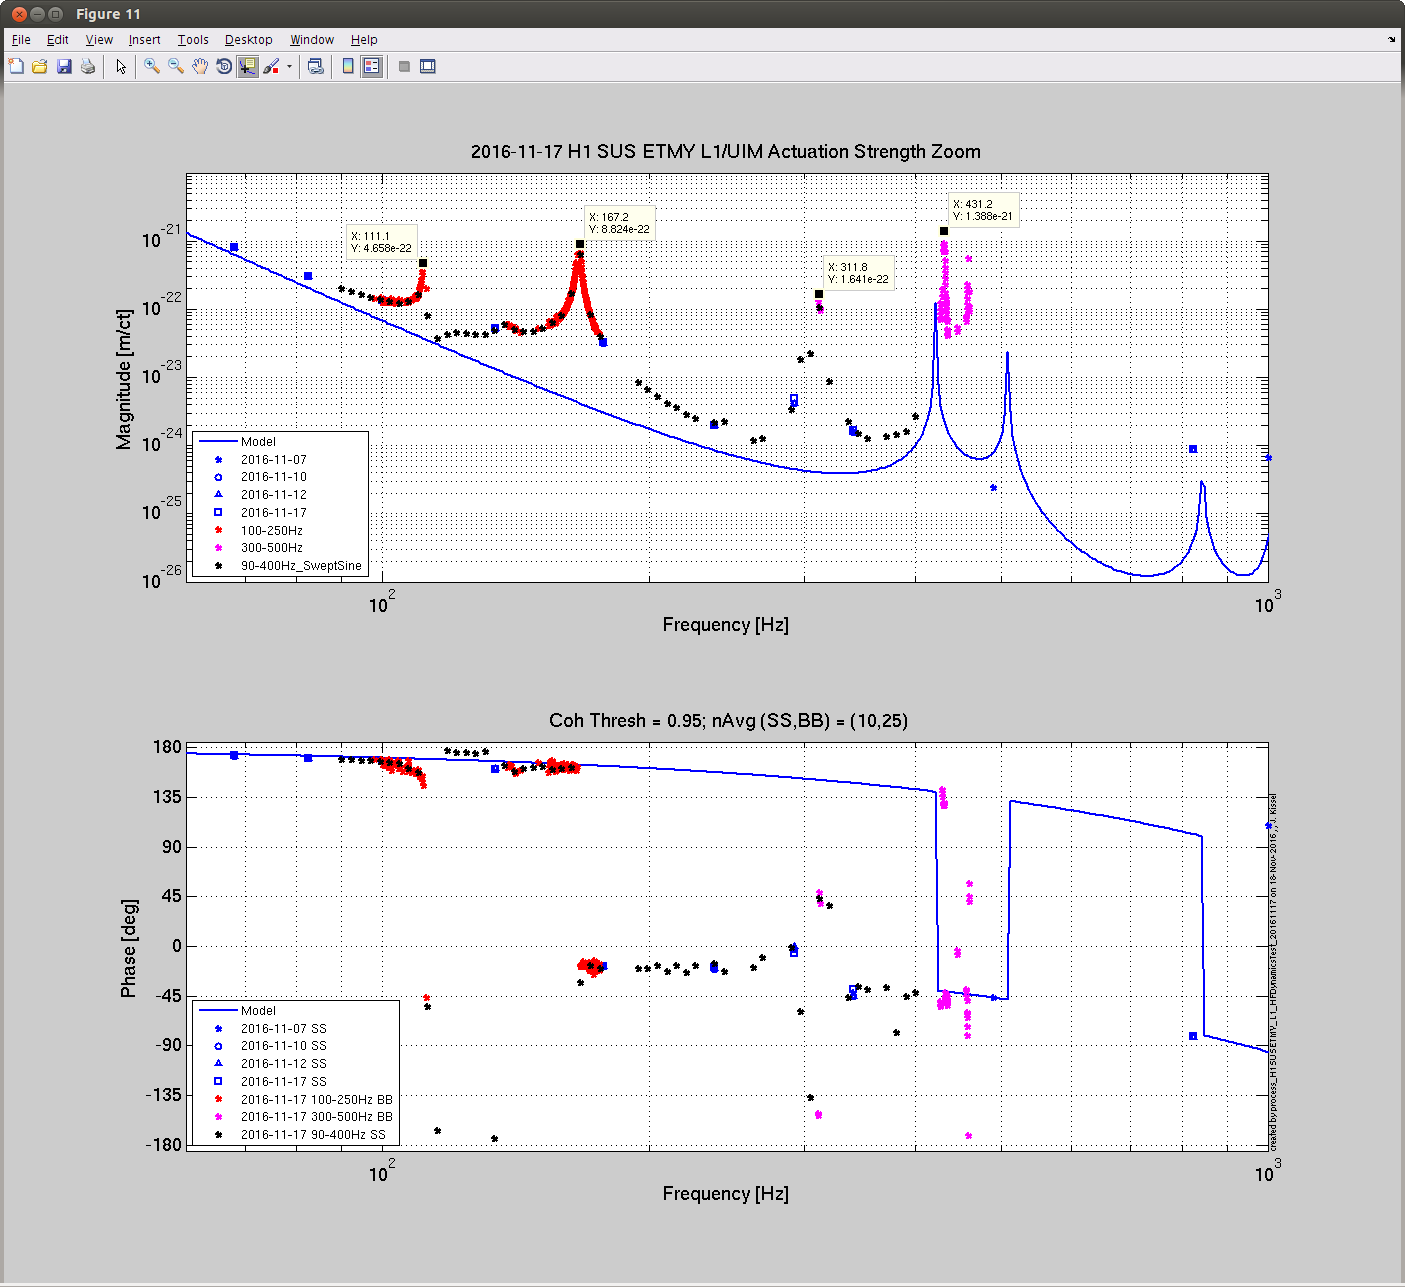
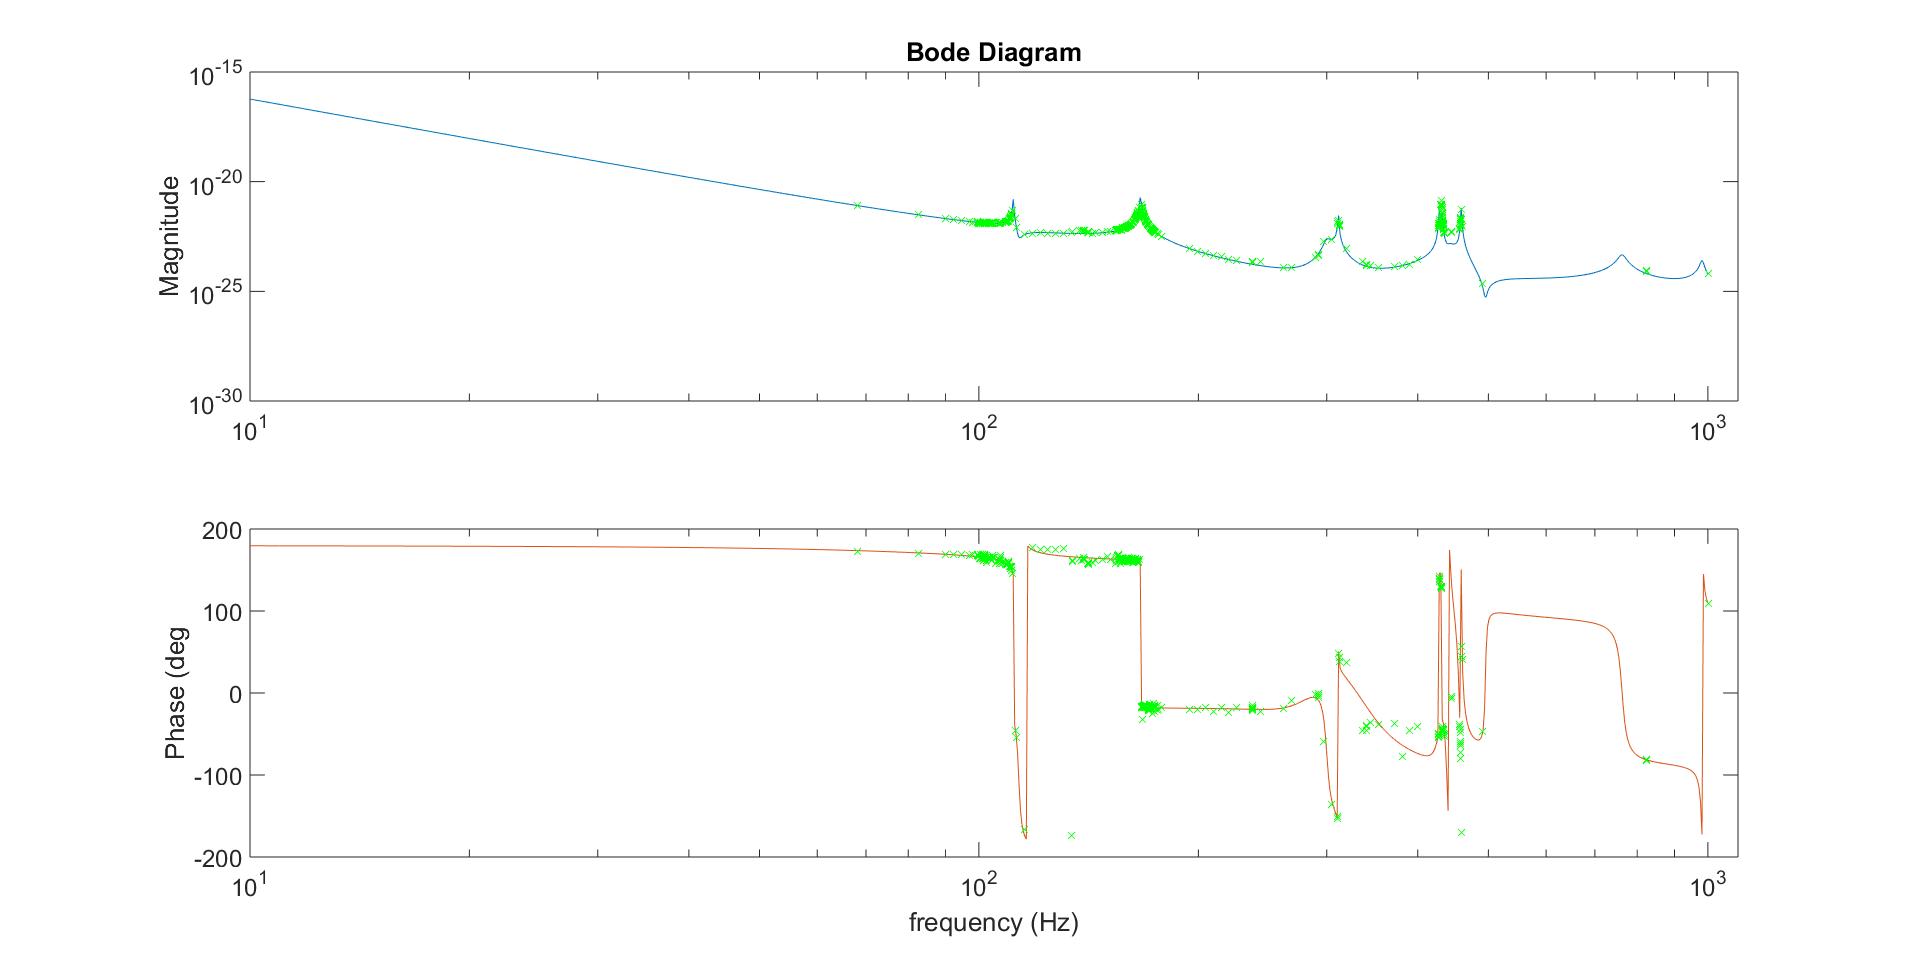
The first attachment is a plot showing the discrepancy between the desired and installed filters. UIM is the one who has the largest discrepancy in 10-100 Hz about a few % in magnitude and a few degrees in phase. Nevertheless, this shouldn't pose an issue for the resulting accuracy of DETAL_EXTERNAL as the UIM affects very weakly above 1 Hz due to the actuation authority. The second attached is another comparison plot showing the desired (full ss) and installed (discrete) filters. Finally the third attachment shows the installed susnorm filters which are forced to be flat at high frequencies.
[Copying the digital filter settings for ETMY]
This was done by running the existing code,
/ligo/svncommon/CalSVN/aligocalibration/trunk/Runs/ER8/H1/Scripts/CALCS/copySus2Cal.py

Darkhan, Kiwamu,
Taking a further look at the K values, we came to the conclusion that the discrepancies are due to rounding error of the N/A values written in H1params.conf. As described above, this will not cause appreciable effects at the precision level we usually talk about (~1 % level). We left them as they are.