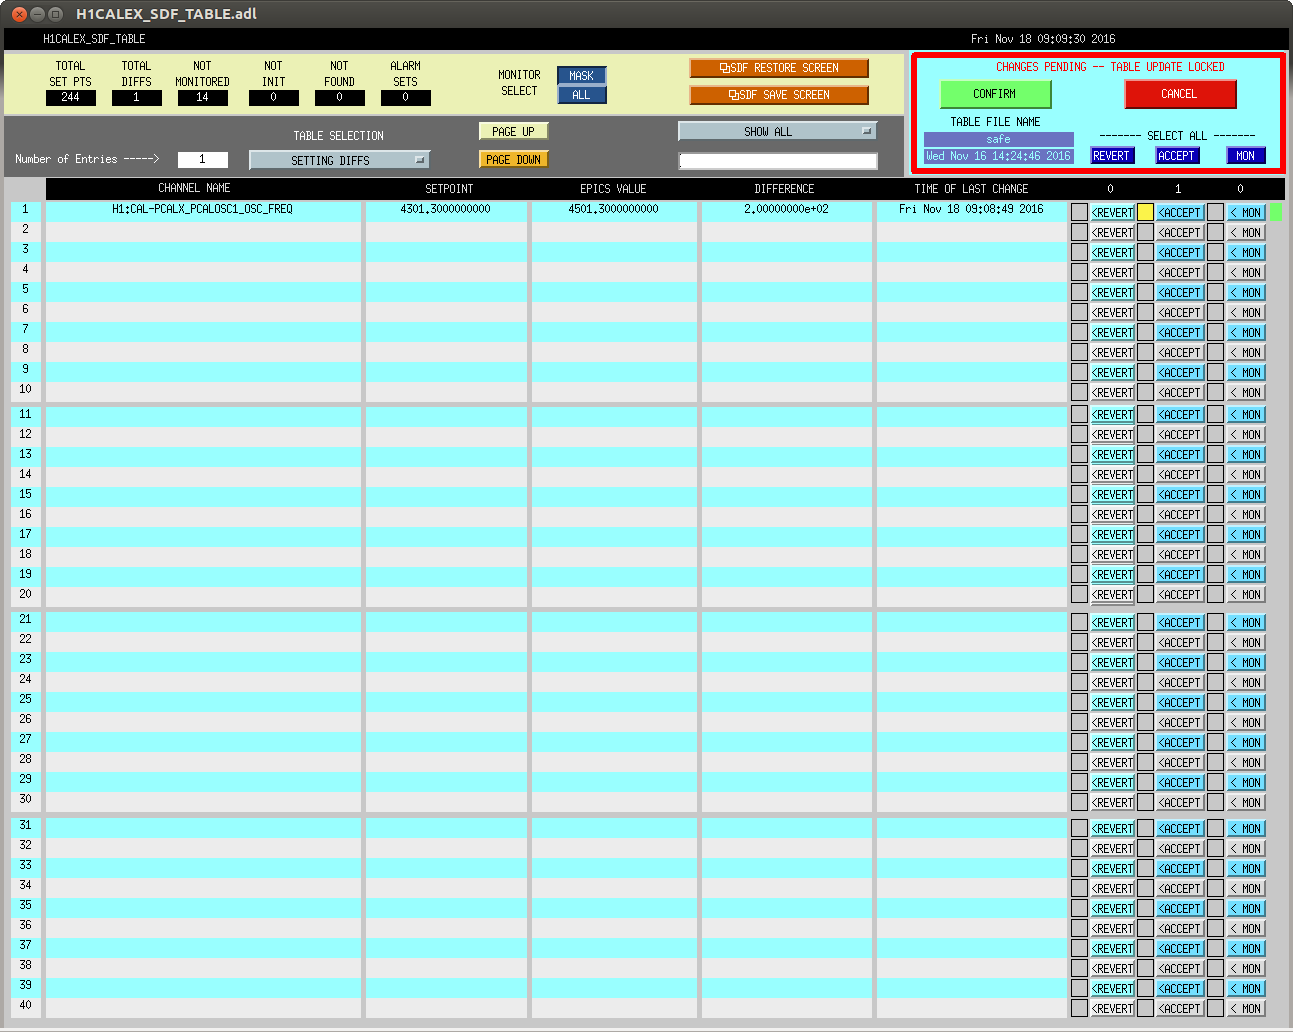
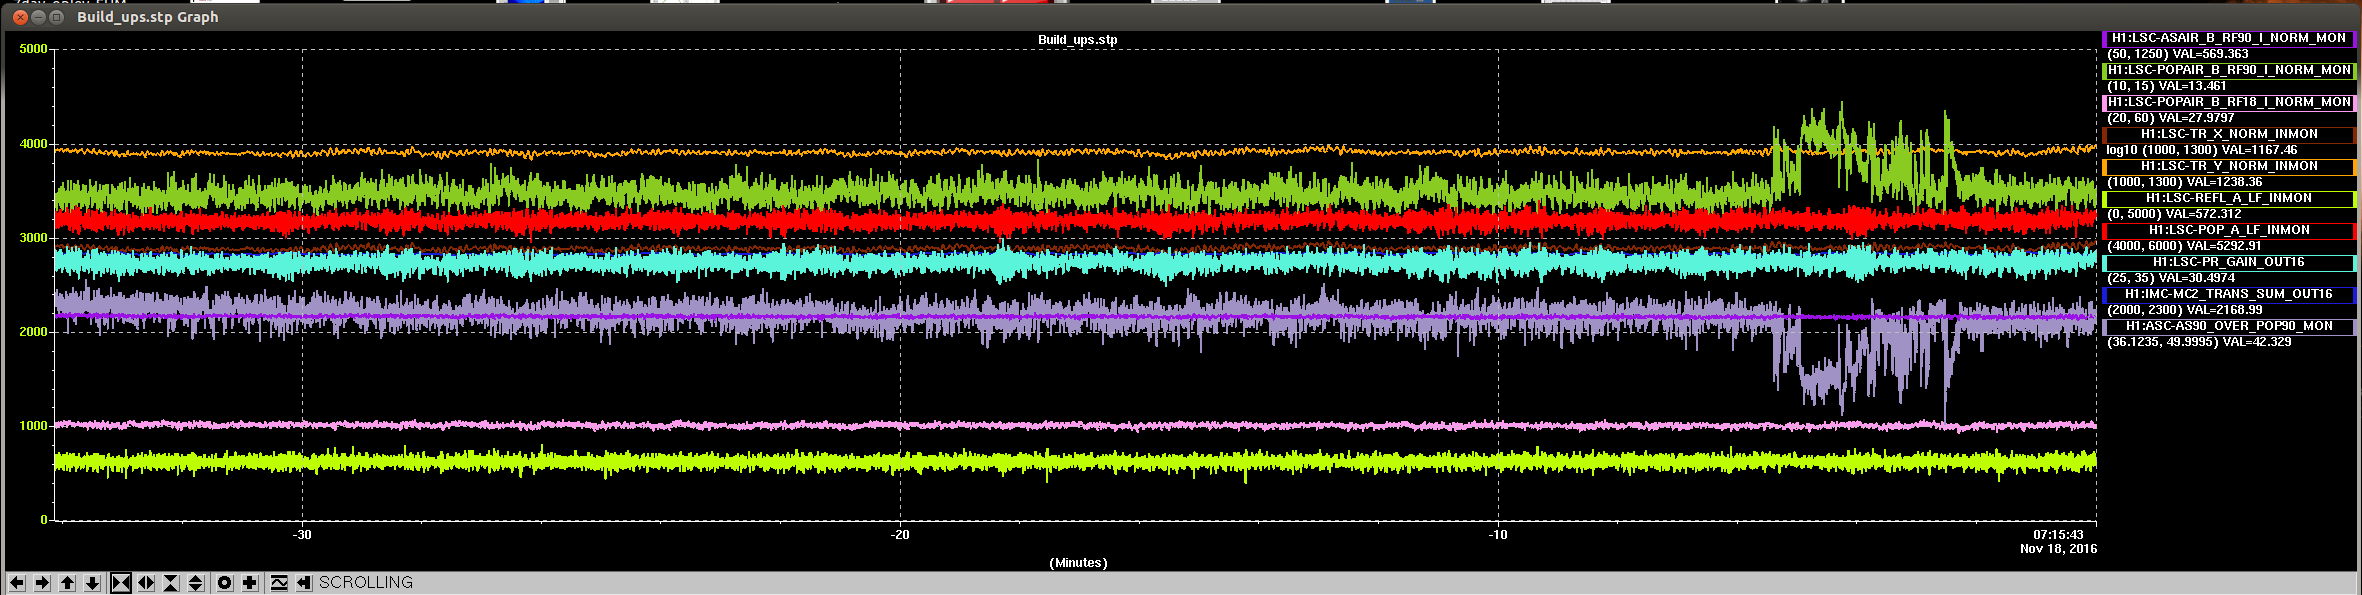
Many of the gain changes I just accepted into the LSC OBSERVE.snap are showing as differences in the safe.snap. With conference of JeffK, we are pretty positive these are values changed by Guardian. So, I am adding these values to the safe.snap Not Monitored list--see attached. They are ASAIR, POPAIR, POP, REFLAIR, & REFL: A & B, RF18/90/9/45, I & Q gains. 18 total channels. This makes 125 not monitored channels yet with these additions, there are only 62 differences for all setpoints.
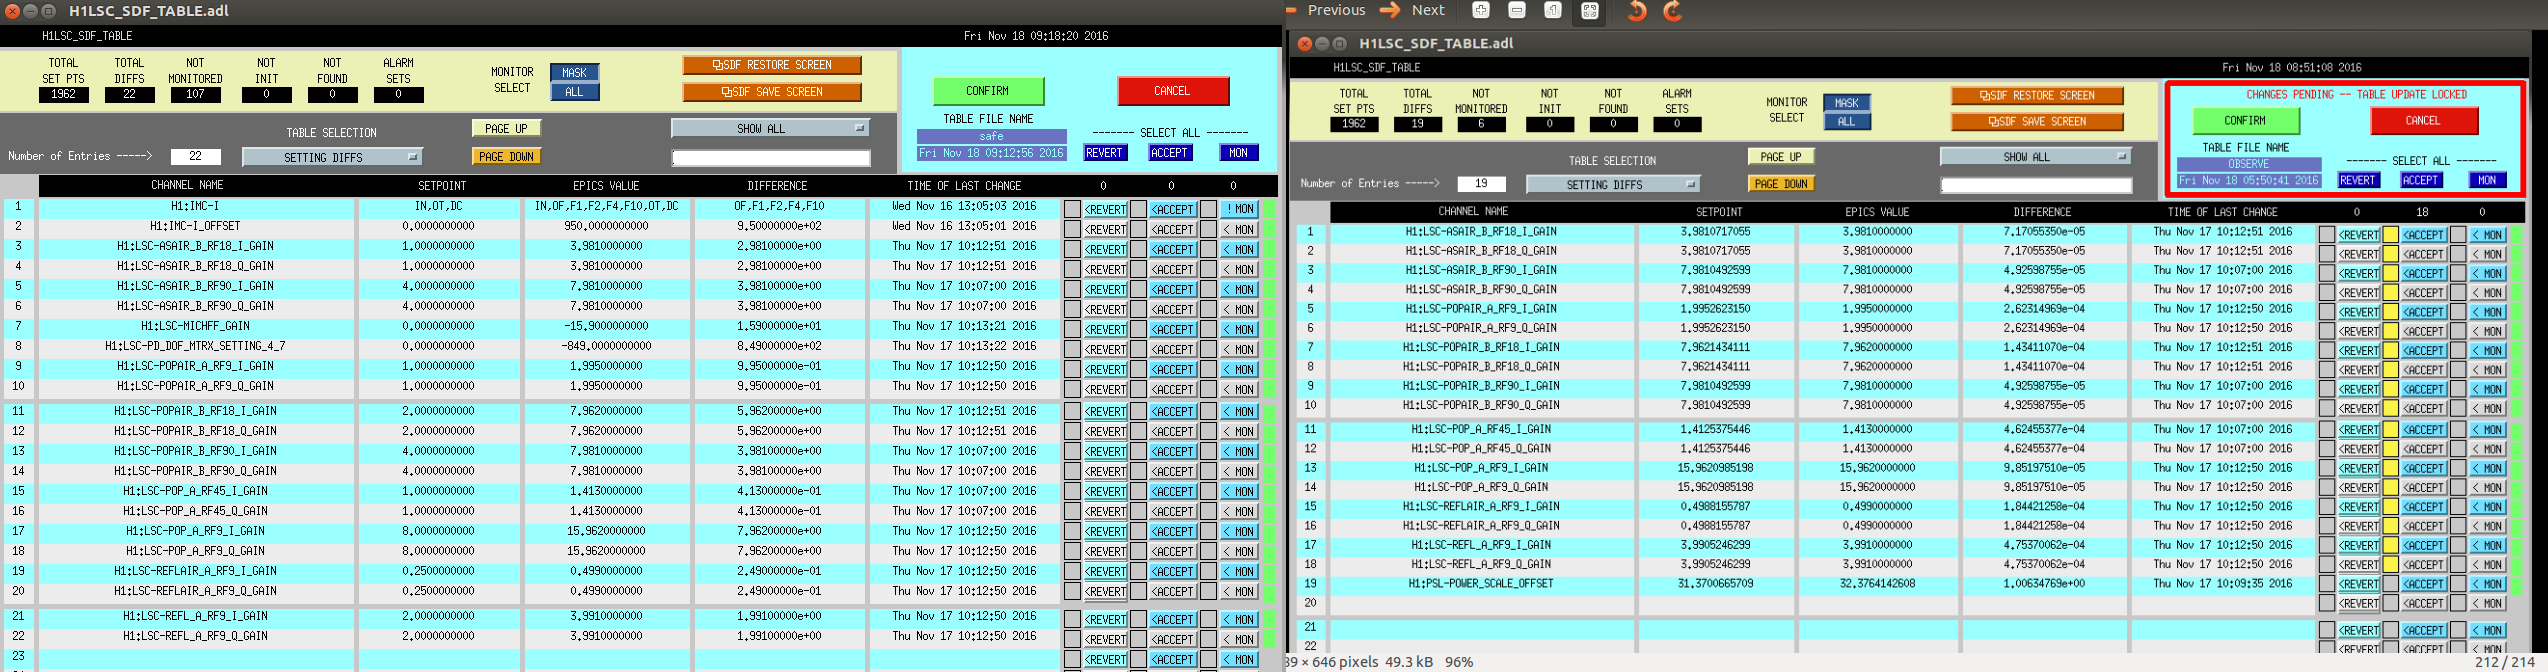
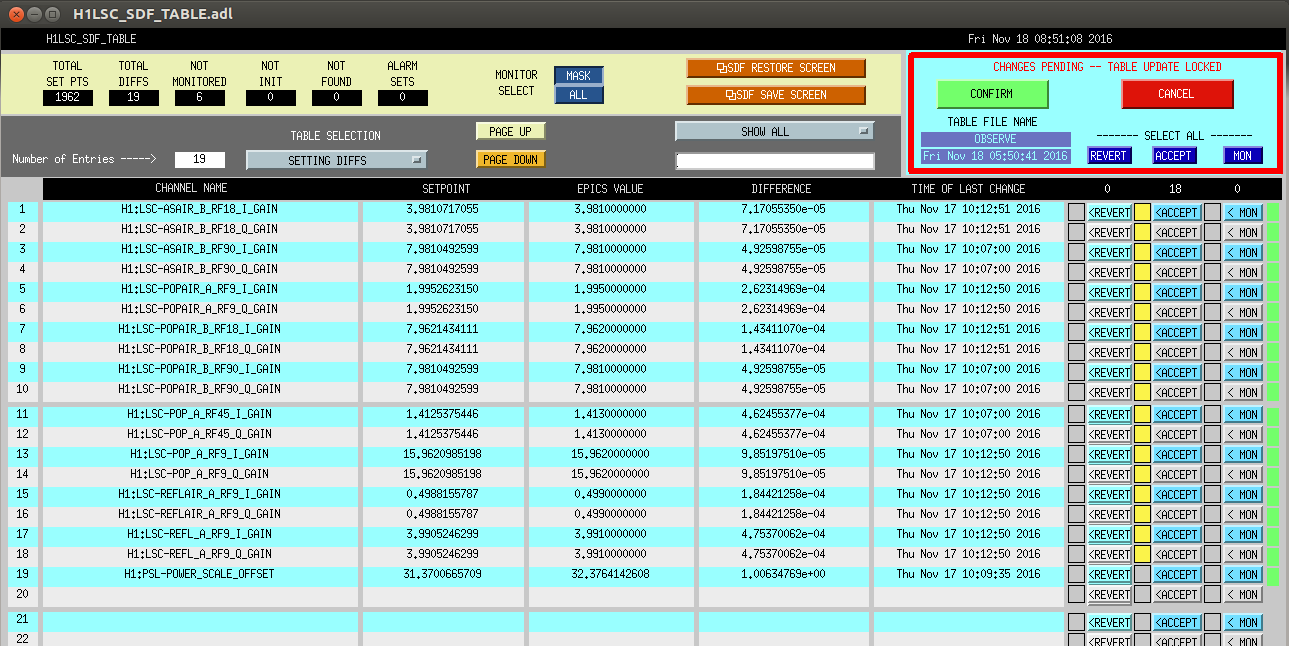
I think these should be re-monitored in the safe.snap file. These values (the ones that are the setpoints in the safe.snap screenshot) are written in the ISC_LOCK DOWN state. If they are not correct, we may have trouble locking. They are then changed by guardian to the values in the Observe.snap screenshot when we reduce the modulation depths of the 9 and 45 MHz. So, the values that we want will be different in the safe and observe snap files, but we probably want to be monitoring them in both.
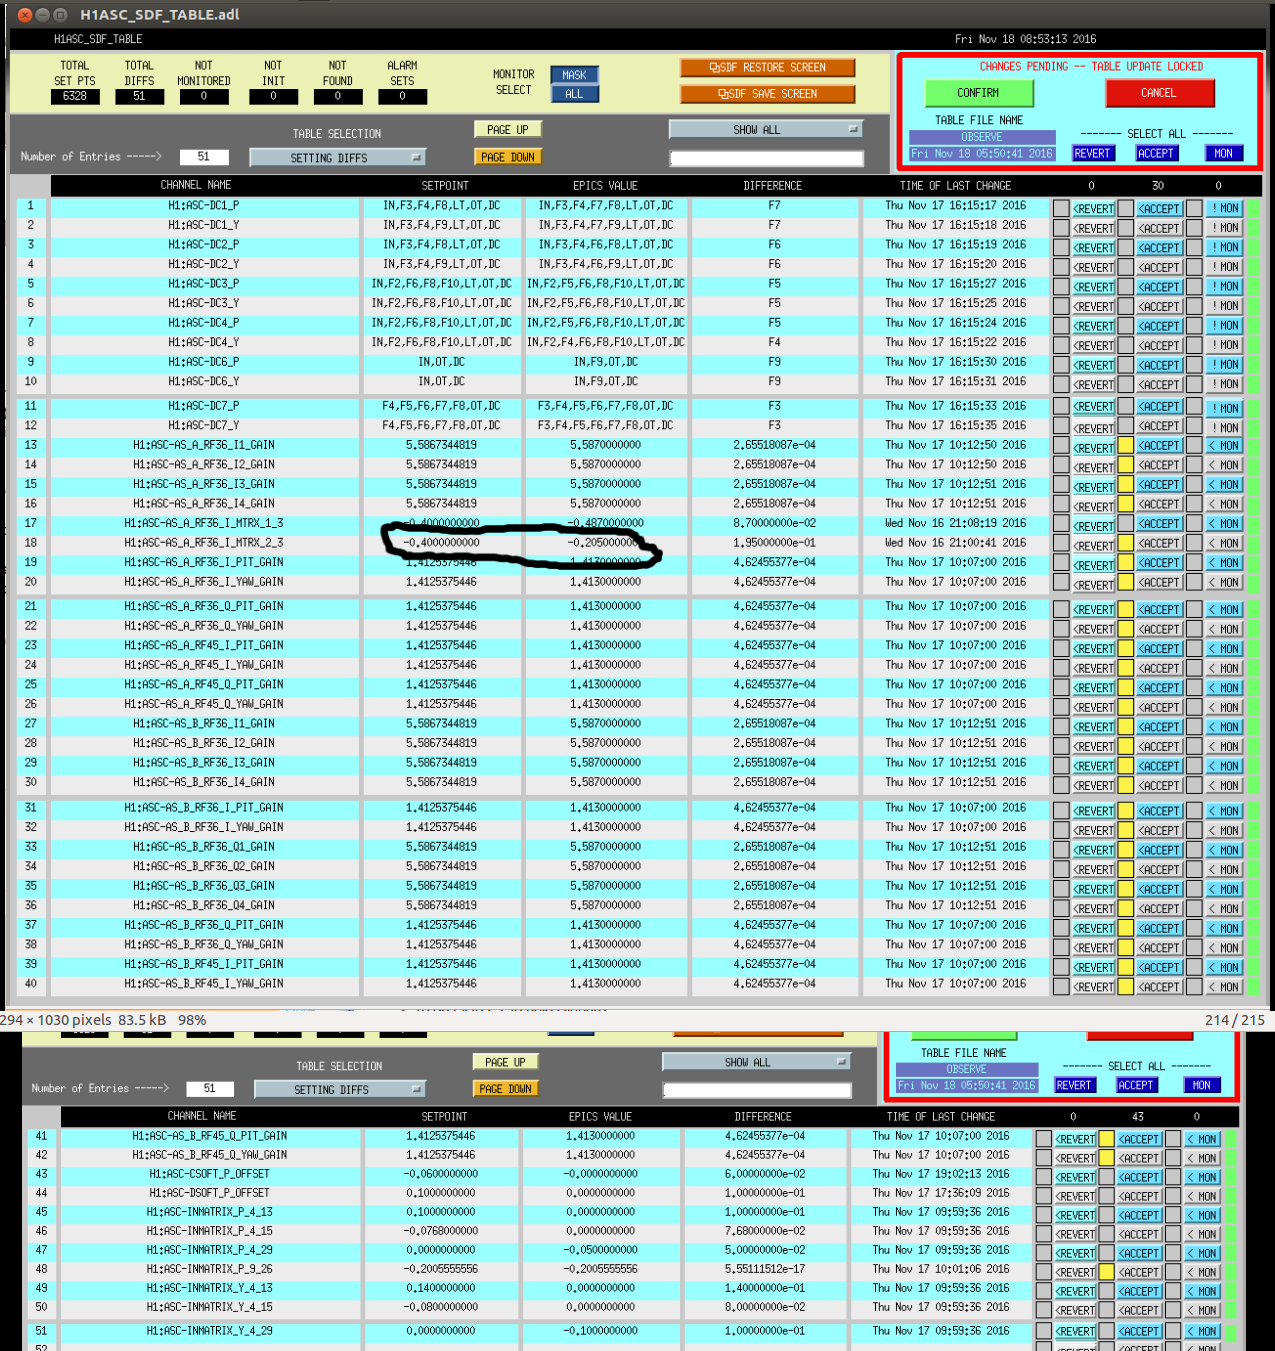
Actually, rethinking on it, Hugh's not-monitoring of these channels in the safe.snap file is totally consistent with everything we've been doing lately (not-monitoring channels that are written explicitly by guardian). Whether our current strategy makes any sense is a larger conversation, but these channels are probably fine not being monitored.