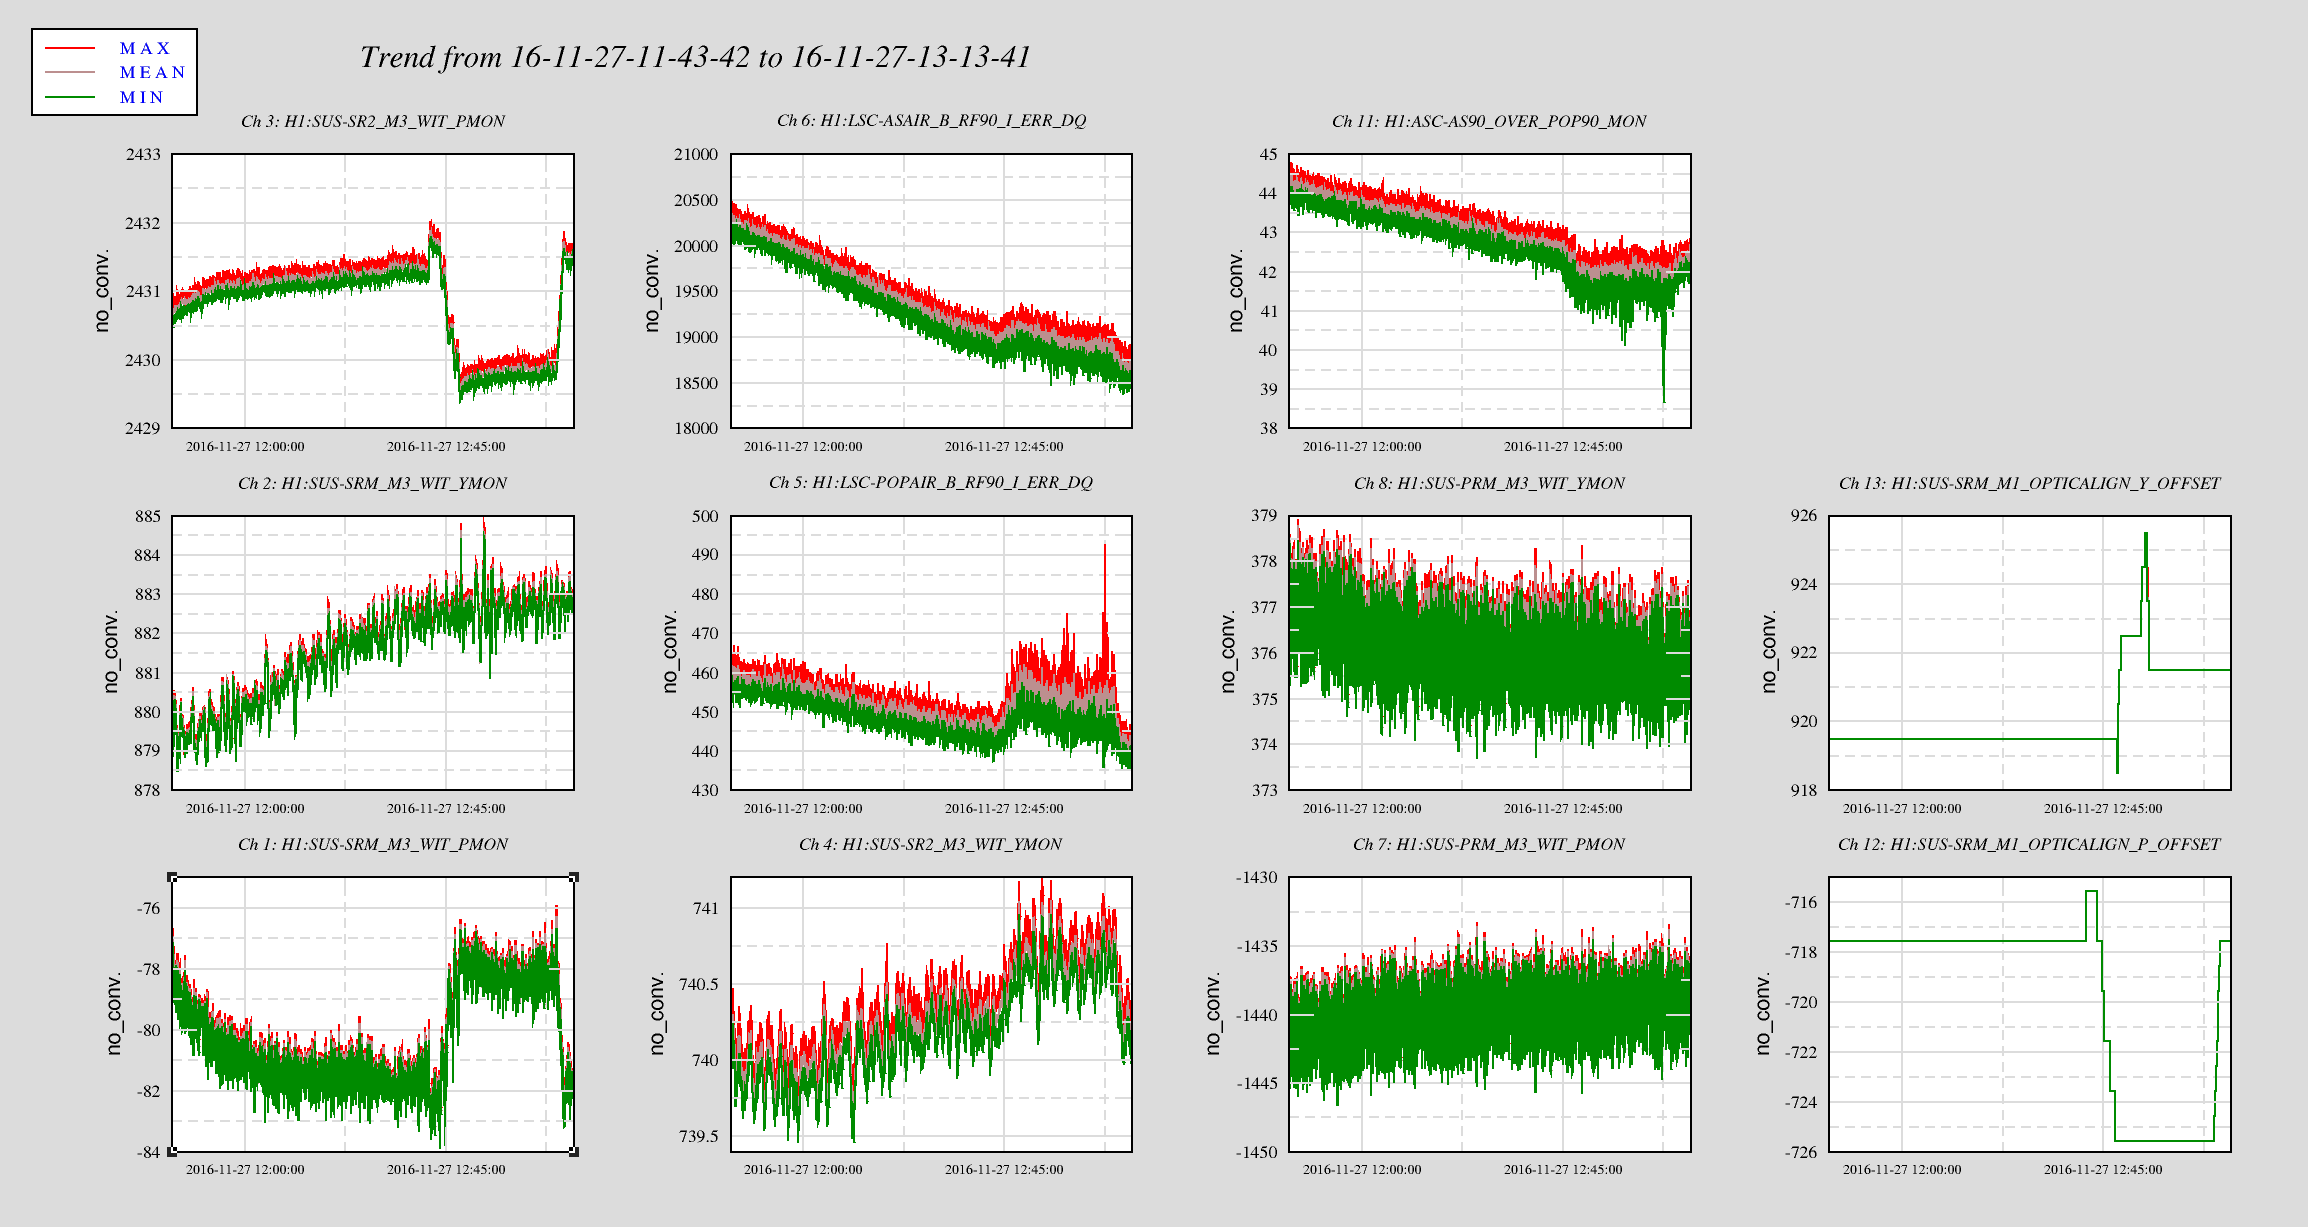
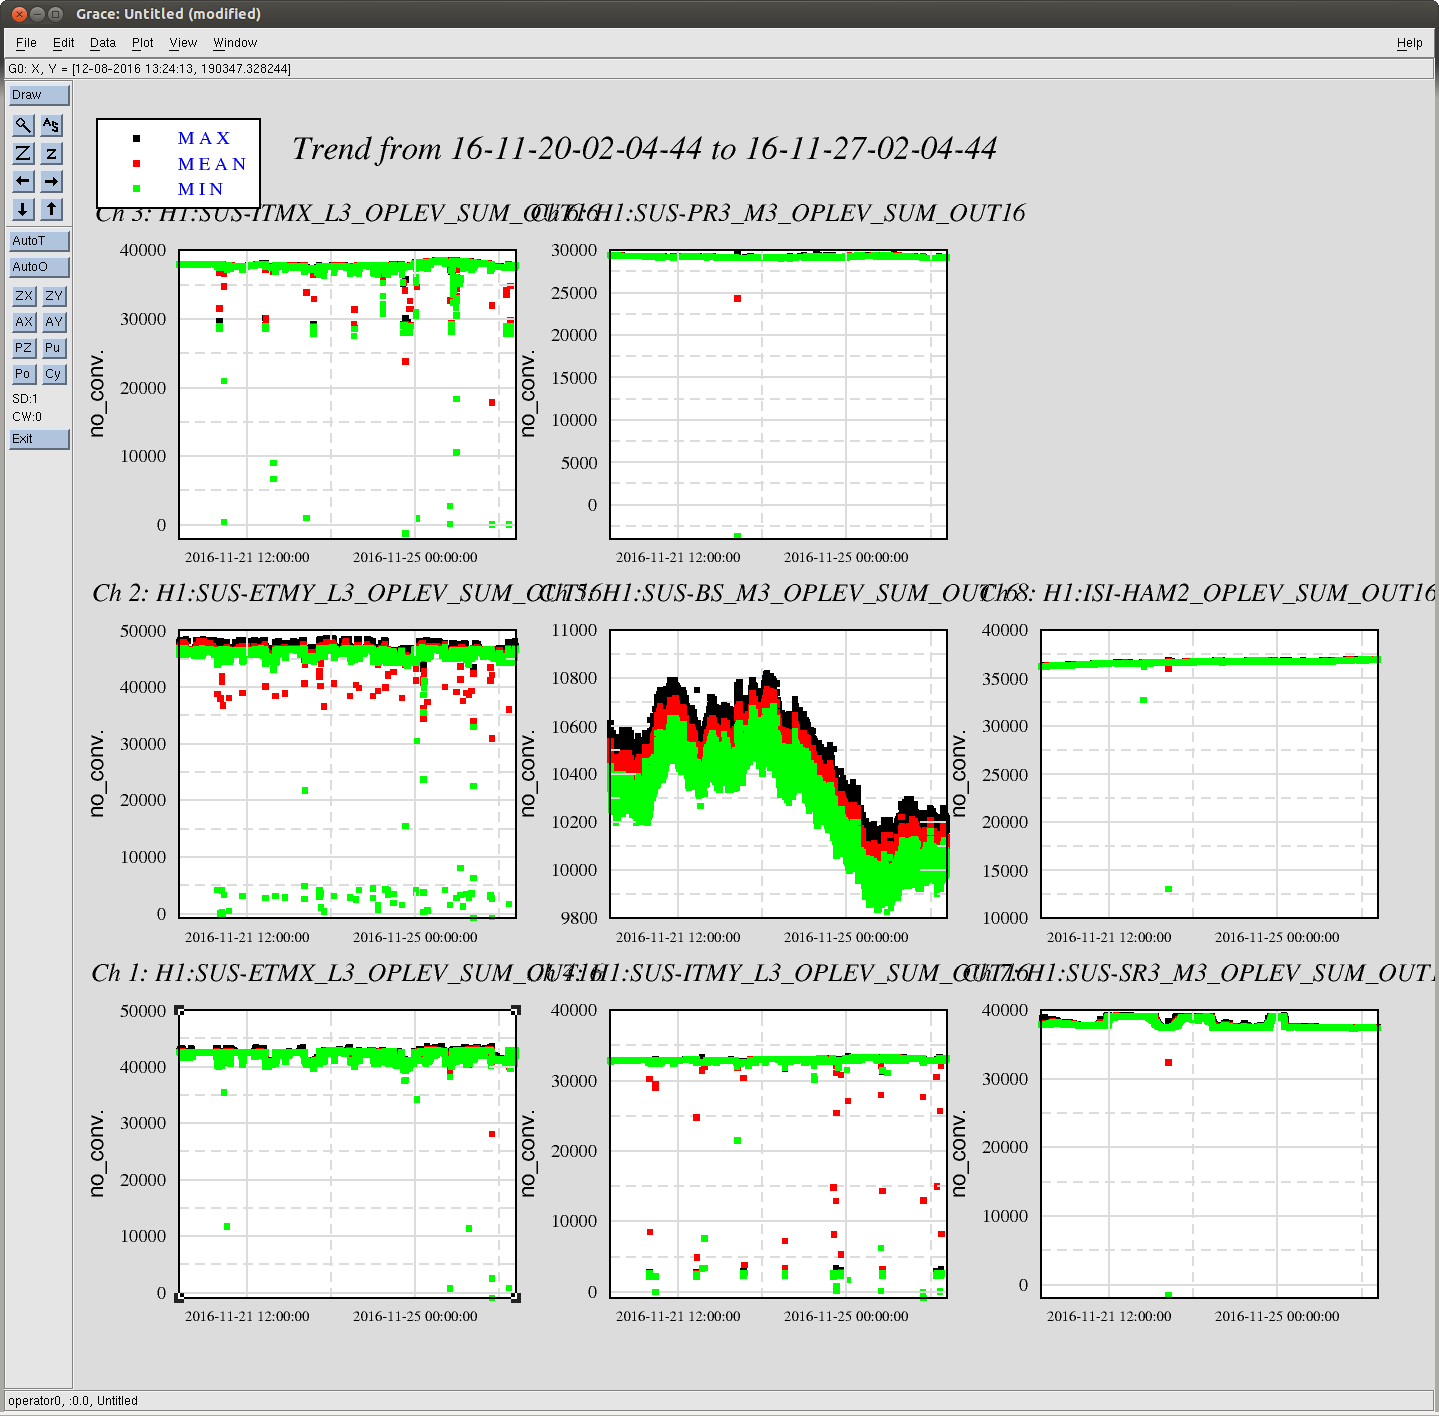
POP90 still jumped during Noise Tuning but I haven't seen a jump during NLN.
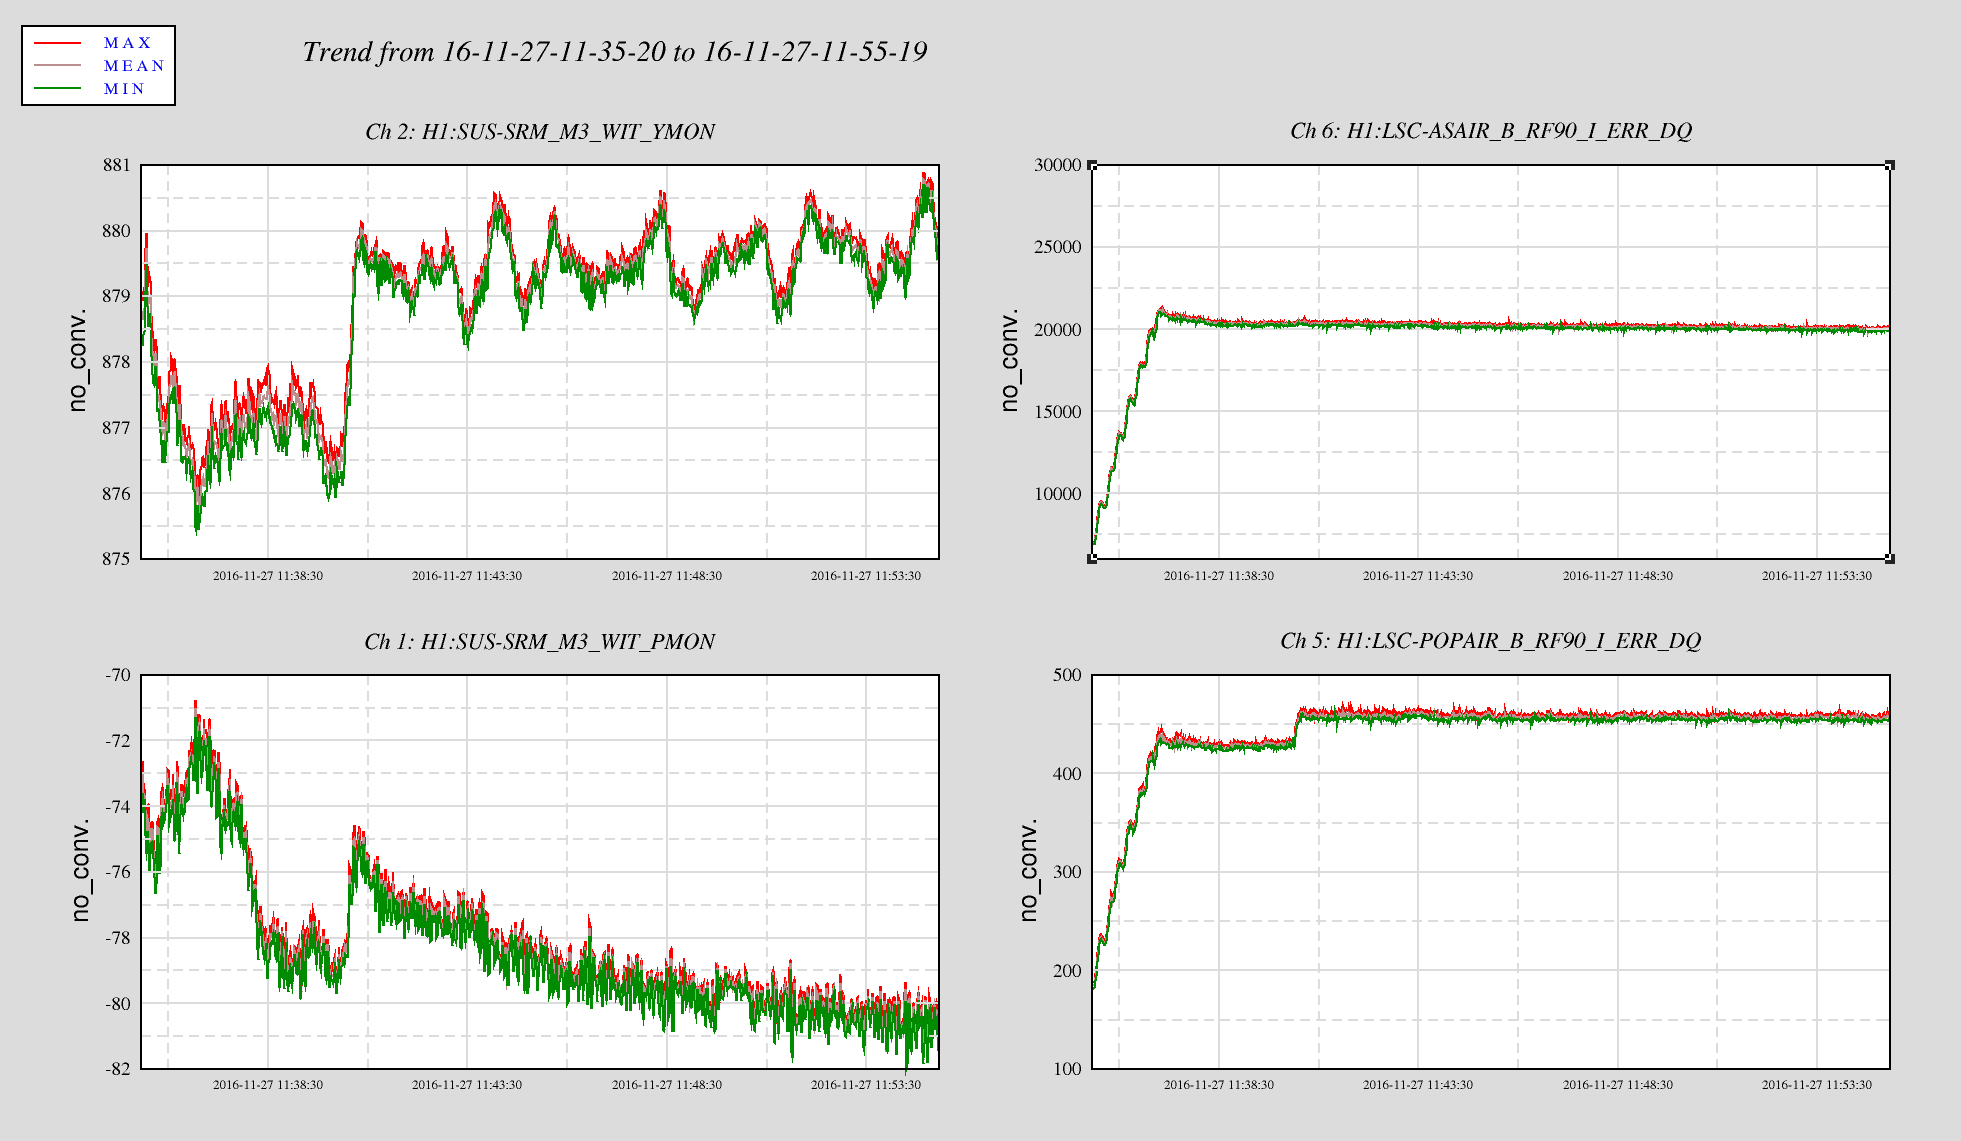
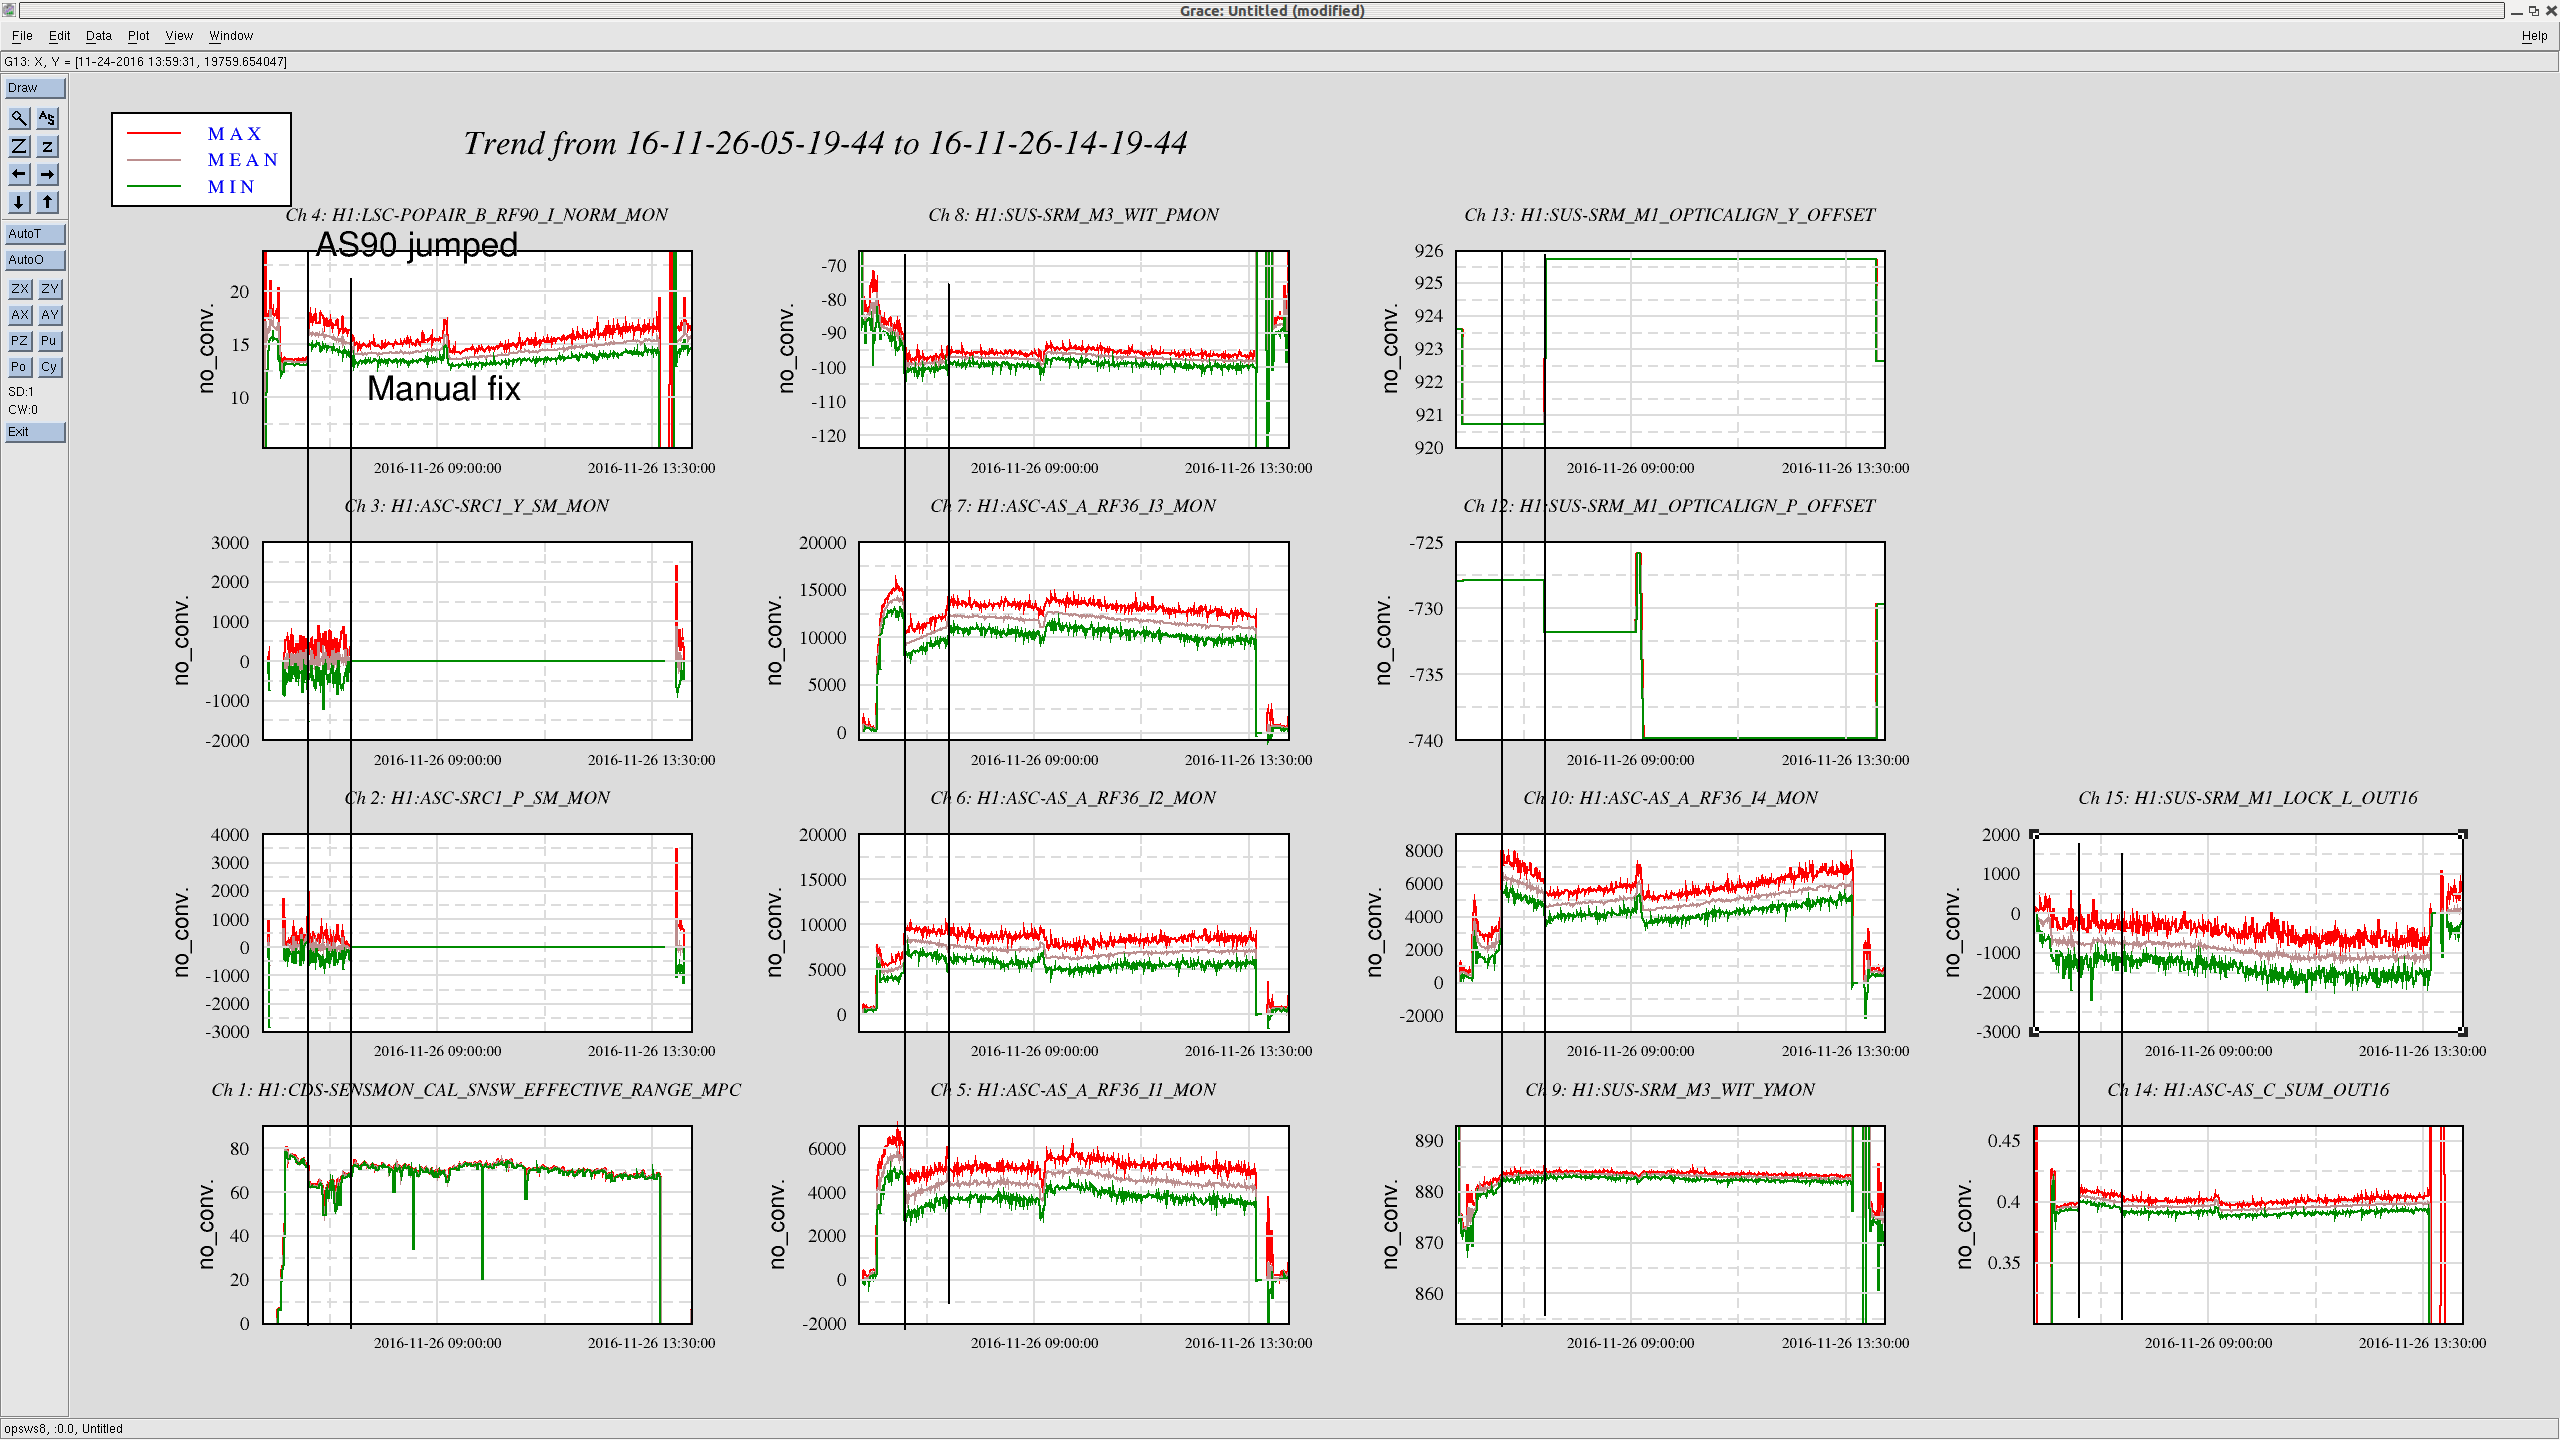
I moved SRM while the intent bit was set hoping it would stop the range from drifting. The range continued to drift downward during the first hour into the lock, I was afraid that it might be due to SRC1 P loop being open. I moved SRM pitch hoping that it would make things better (or slow down the drift). However, turned out I made the noise worse. I moved SRM back in pitch to where it started off at NLN and was able to improve the range a little. Because of an ongoing scheduled injection I didn't take H1 out of Observing (sorry DQ shifter, this is why I tagged you!). I also tried to move SRM yaw a little bit since it was also drifting (even with SRC1 Y loop close). The time of alignment change is 12:41-12:56 UTC and 13:09-13:12 UTC. I didn't move SRM yaw all the way back to where it started off since it seems to have become stabilized (and so was the range).