WP6287 Add PEM ADC card to h1oaf0
Jim, Dave, commissioning
this turned into a large task. Please see alog 31316 for details. Currently the ADC card is in the chassis and we are not seeing any errors. We will monitor for any recurrence of ADC/DAC errors on this system, or nf_conntrack table errors.
WP6295 Add PEM-EX chans to DAQ for ESD-PS monitoring
Ansel, Robert, Dave
h1pemex was modified to add three test ADC channels to the DAQ at 2048Hz.
WP6303 Run later version of Frame-cpp on DAQ FW2
Jonathan,
as a test of using frame-cpp version 2.5.2 in the DAQ, the new version is being tested on h1fw2. This is the latest version supported by Ubuntu-12. It does have the leap-second modification needed for 31Dec2016.
WP6307 Add BRS Beckhoff computers to CDS KVM
Carlos
The new Beckhoff branded BRS computers at EX and EY were added to the KVM so we don't need to support an additional monitor, keyboard and mouse. These computers do not have an on/off switch, so we are unable to stop them booting up when power is restored after an outage.
WP6306 Update Hartmann Wavefront Sensor channels into DAQ
Kiwamu, Nutsinee, Dave
I have updated the H1EDCU_HWS.ini file now all four hws systems are running the new python code. Starting with the EPICS database file, I made a list of non-string channels (i.e. binary and analog channels).
Interestingly ITMX was found to be missing 14 channels which appear in the other systems. These channels have ITMM in their names. After discussion with Kiwamu and Nutsinee we decided to remove these from the ini file for now.
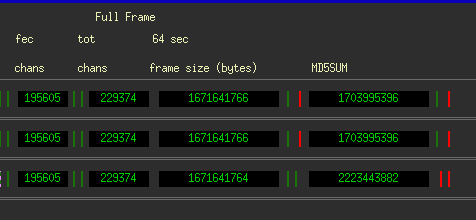
DAQ Restart
Jim
DAQ was restarted to: add ADC to h1iopoaf0, add chans to h1pemex, add new H1EDCU_HWS.ini.