I ran a BruCo scan for the last night lock, using ten minutes of data when the range was at ~65 MPc. Results are available here:
https://ldas-jobs.ligo.caltech.edu/~gabriele.vajente/bruco_1159774937/
Summary
There is a lot of coherence a bit everywhere:
-
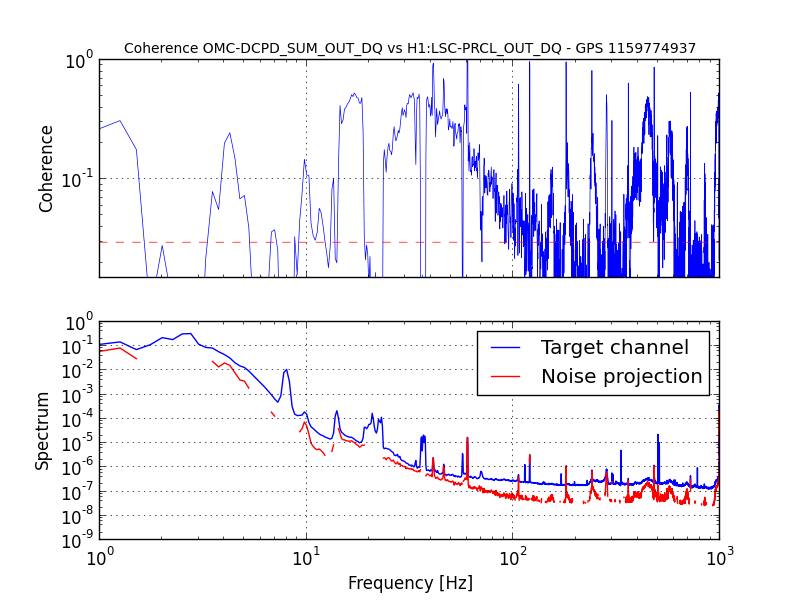
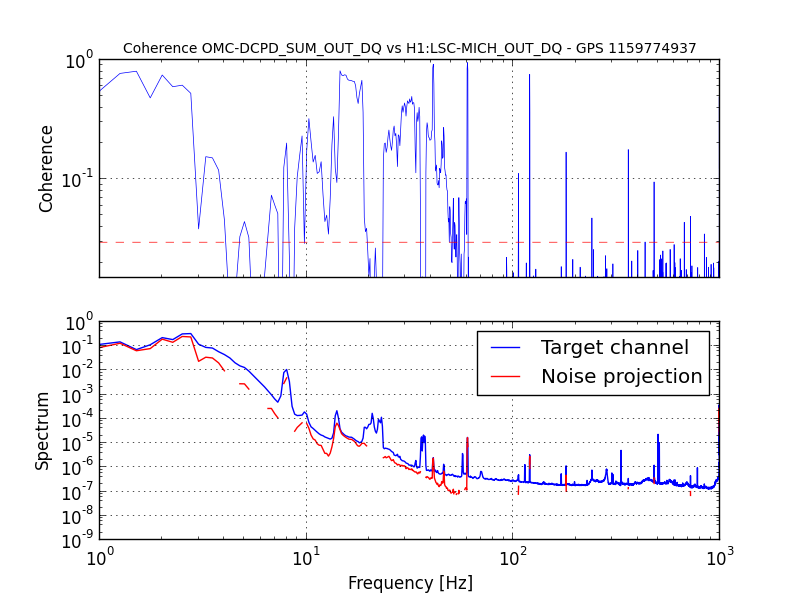
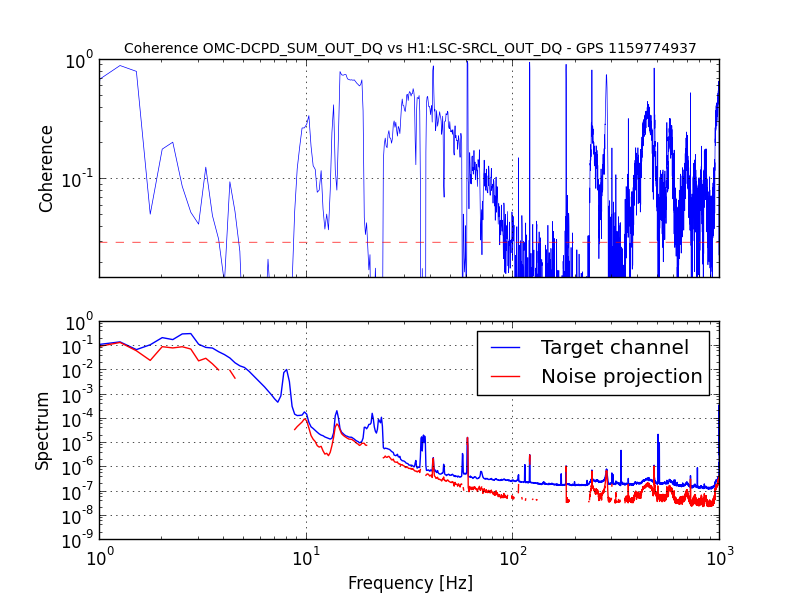
at low frequency (<100 Hz) the auxiliary longitudinal d.o.f.s win: MICH, SRCL, PRCL, see figures 1,2 and 3
-
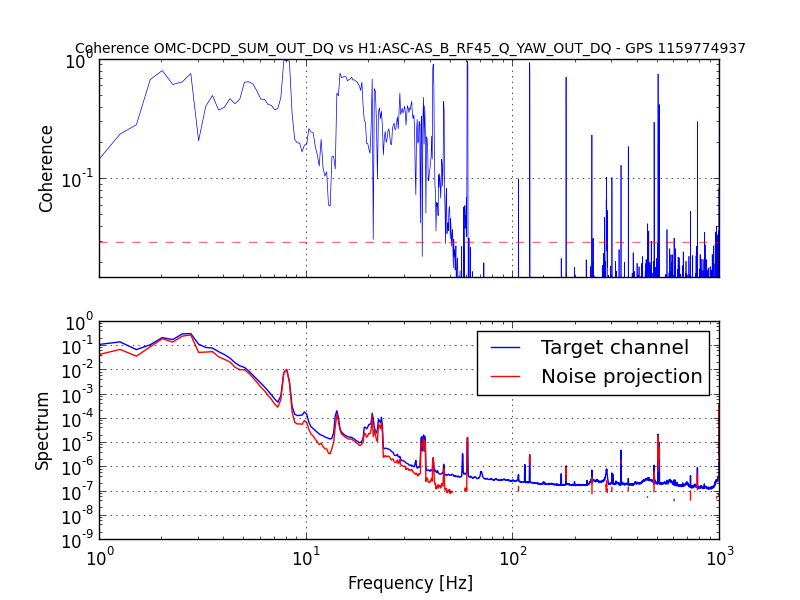
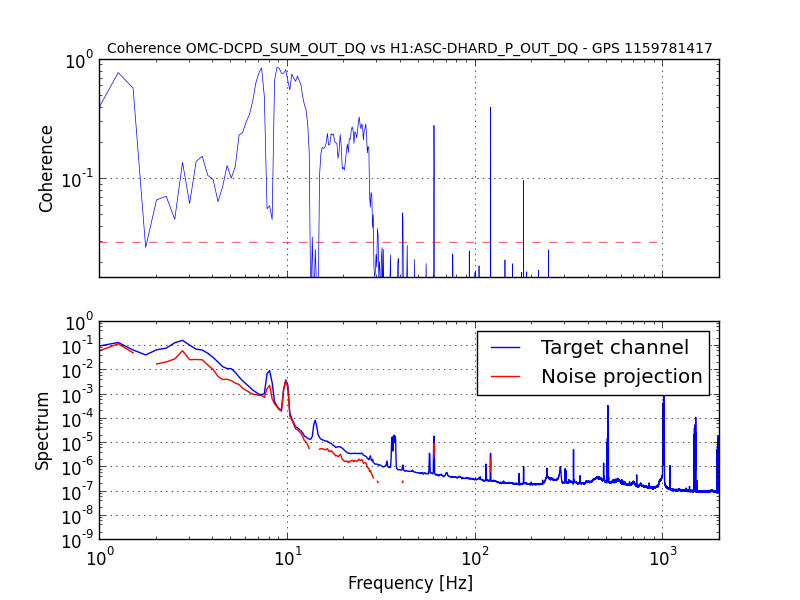
below 50 Hz the most significant angular control signal is ASC-AS_B_RF45_Q_YAW (fig. 4)
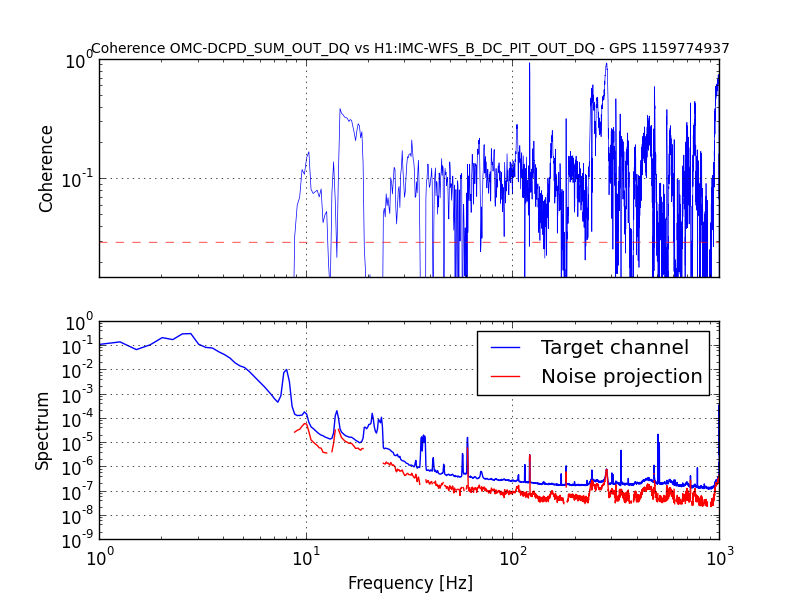
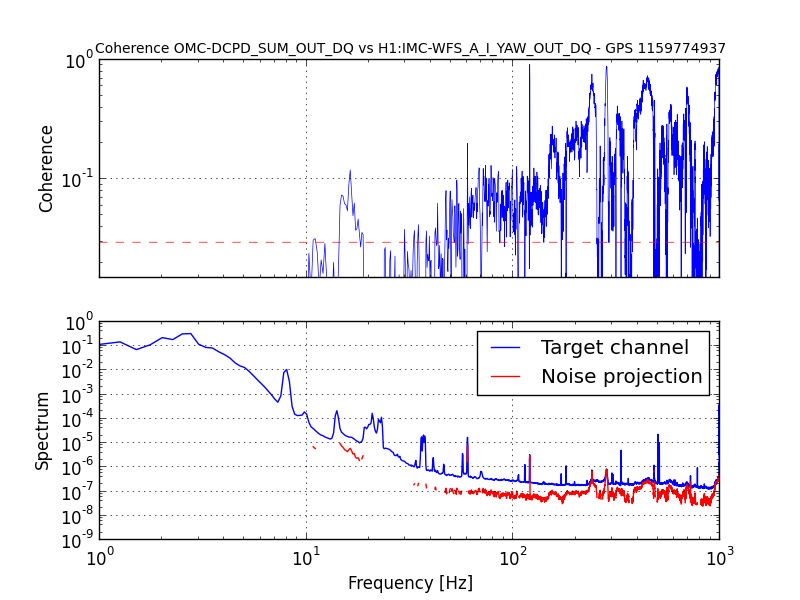
The "jitter noise" above 100 Hz shows a lot of coherence with many signals, of different origins. Most of the IMC WFS signals are coherent, for example: IMC-WFS_A/B_DC_PIT/YAW_OUT (fig. 5 and 6).
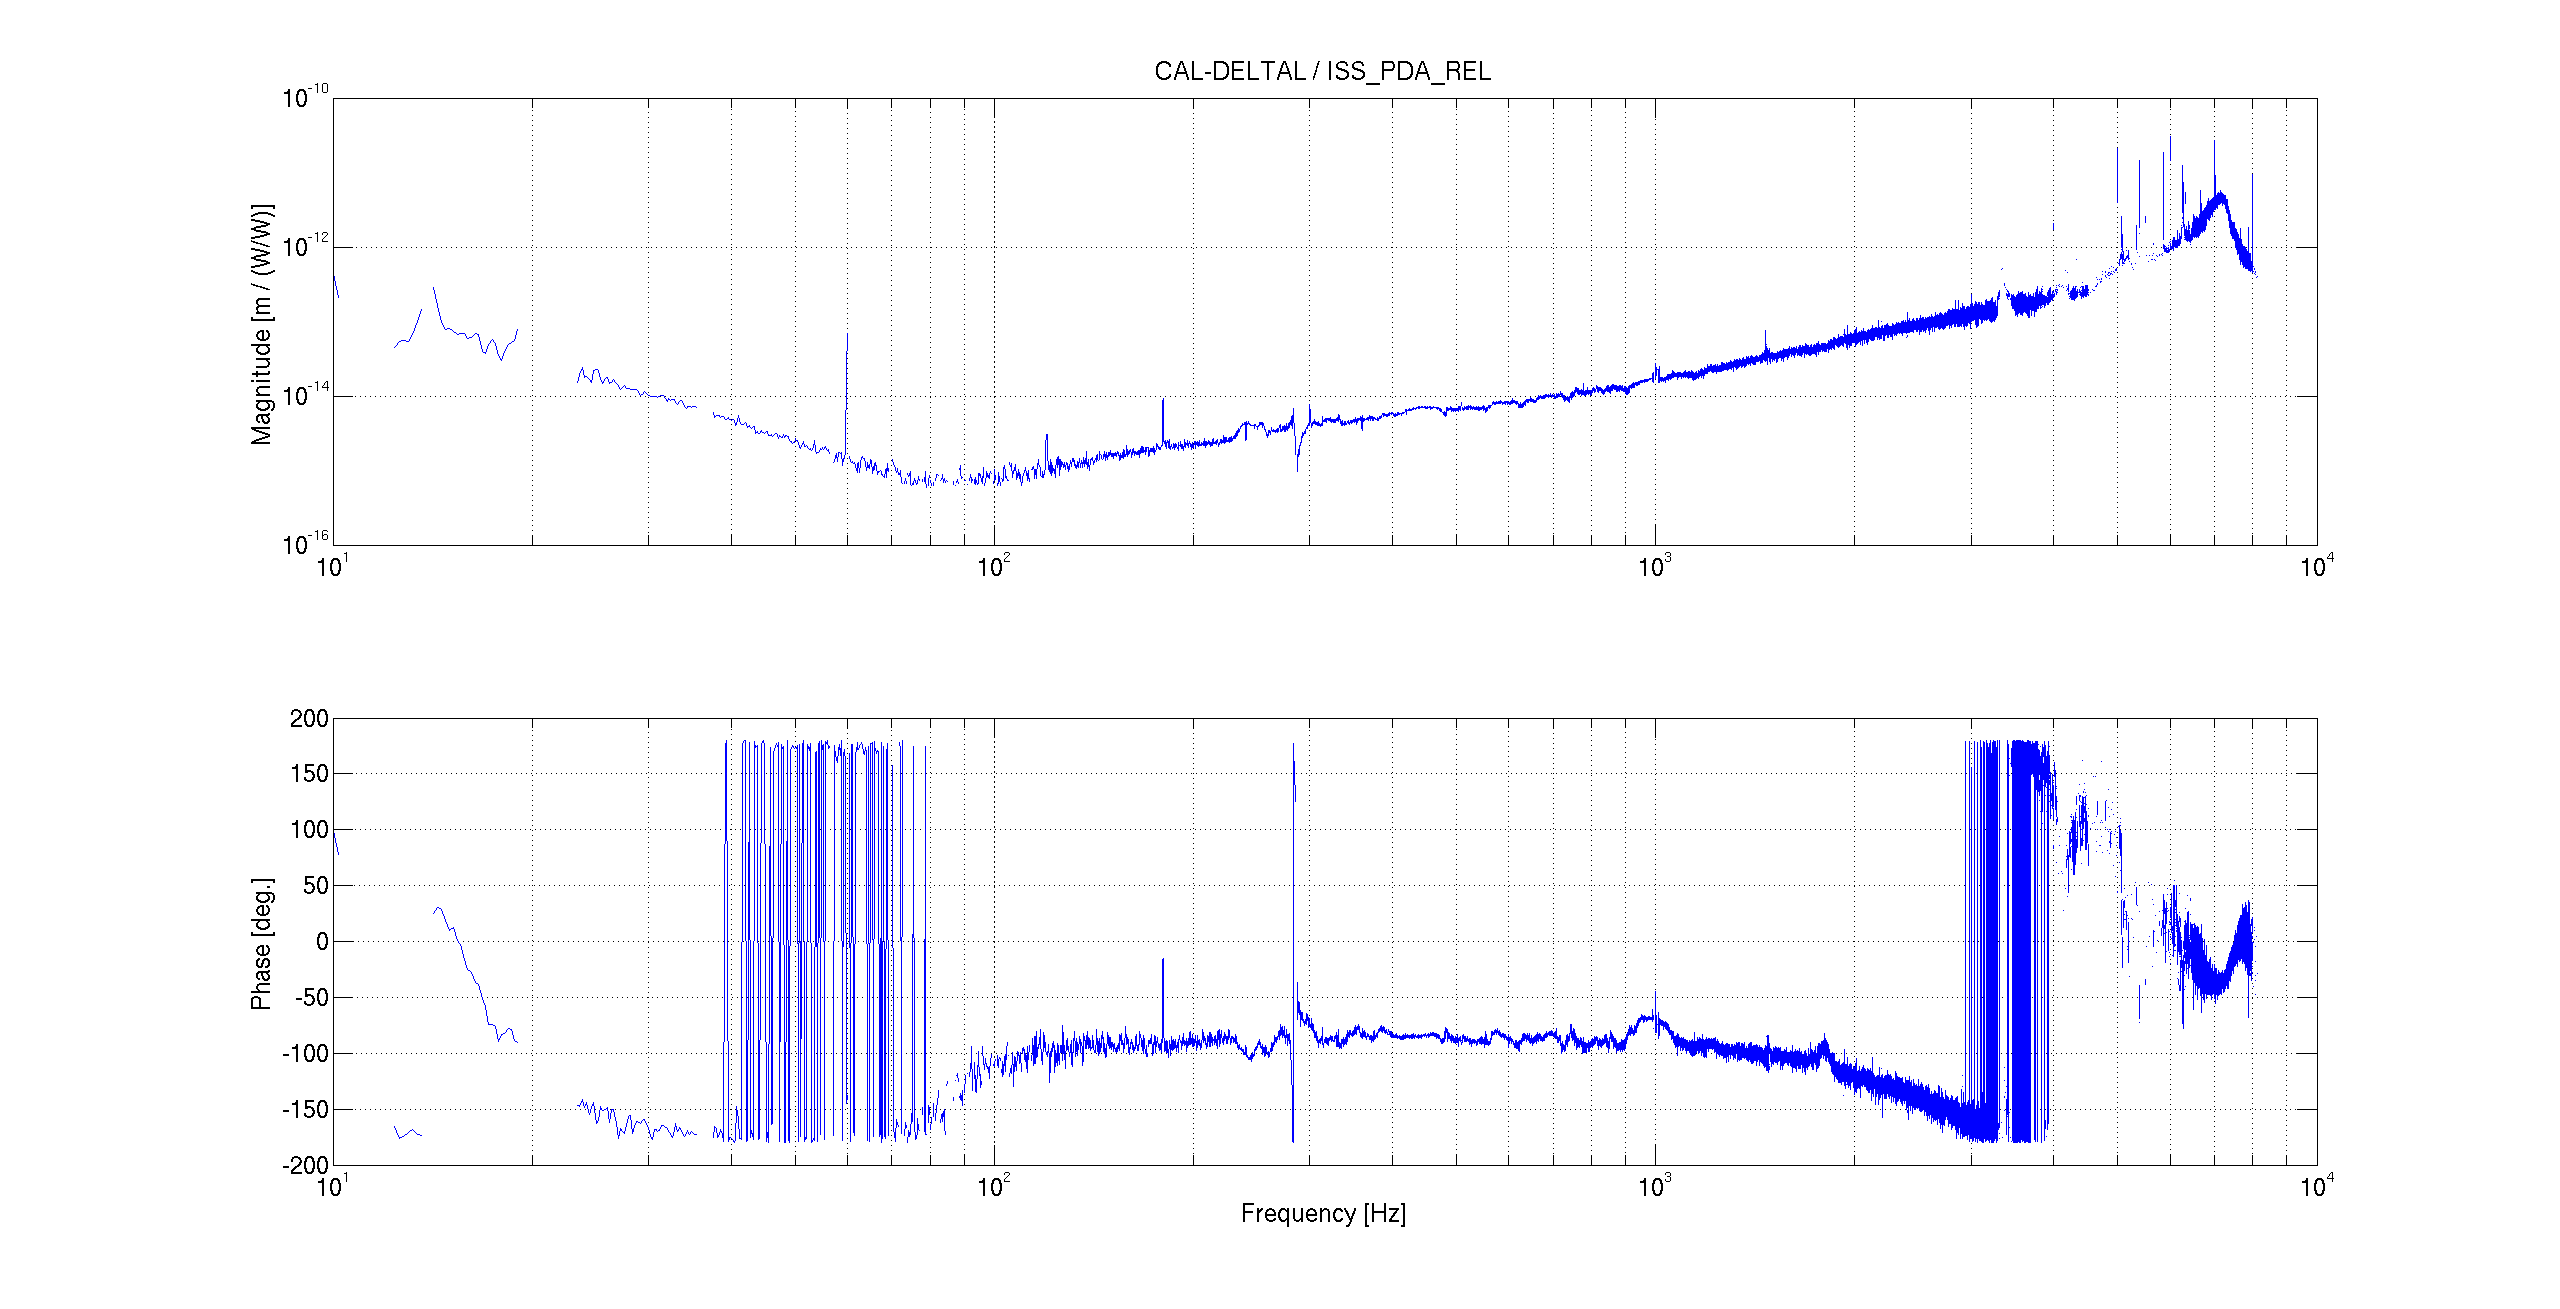
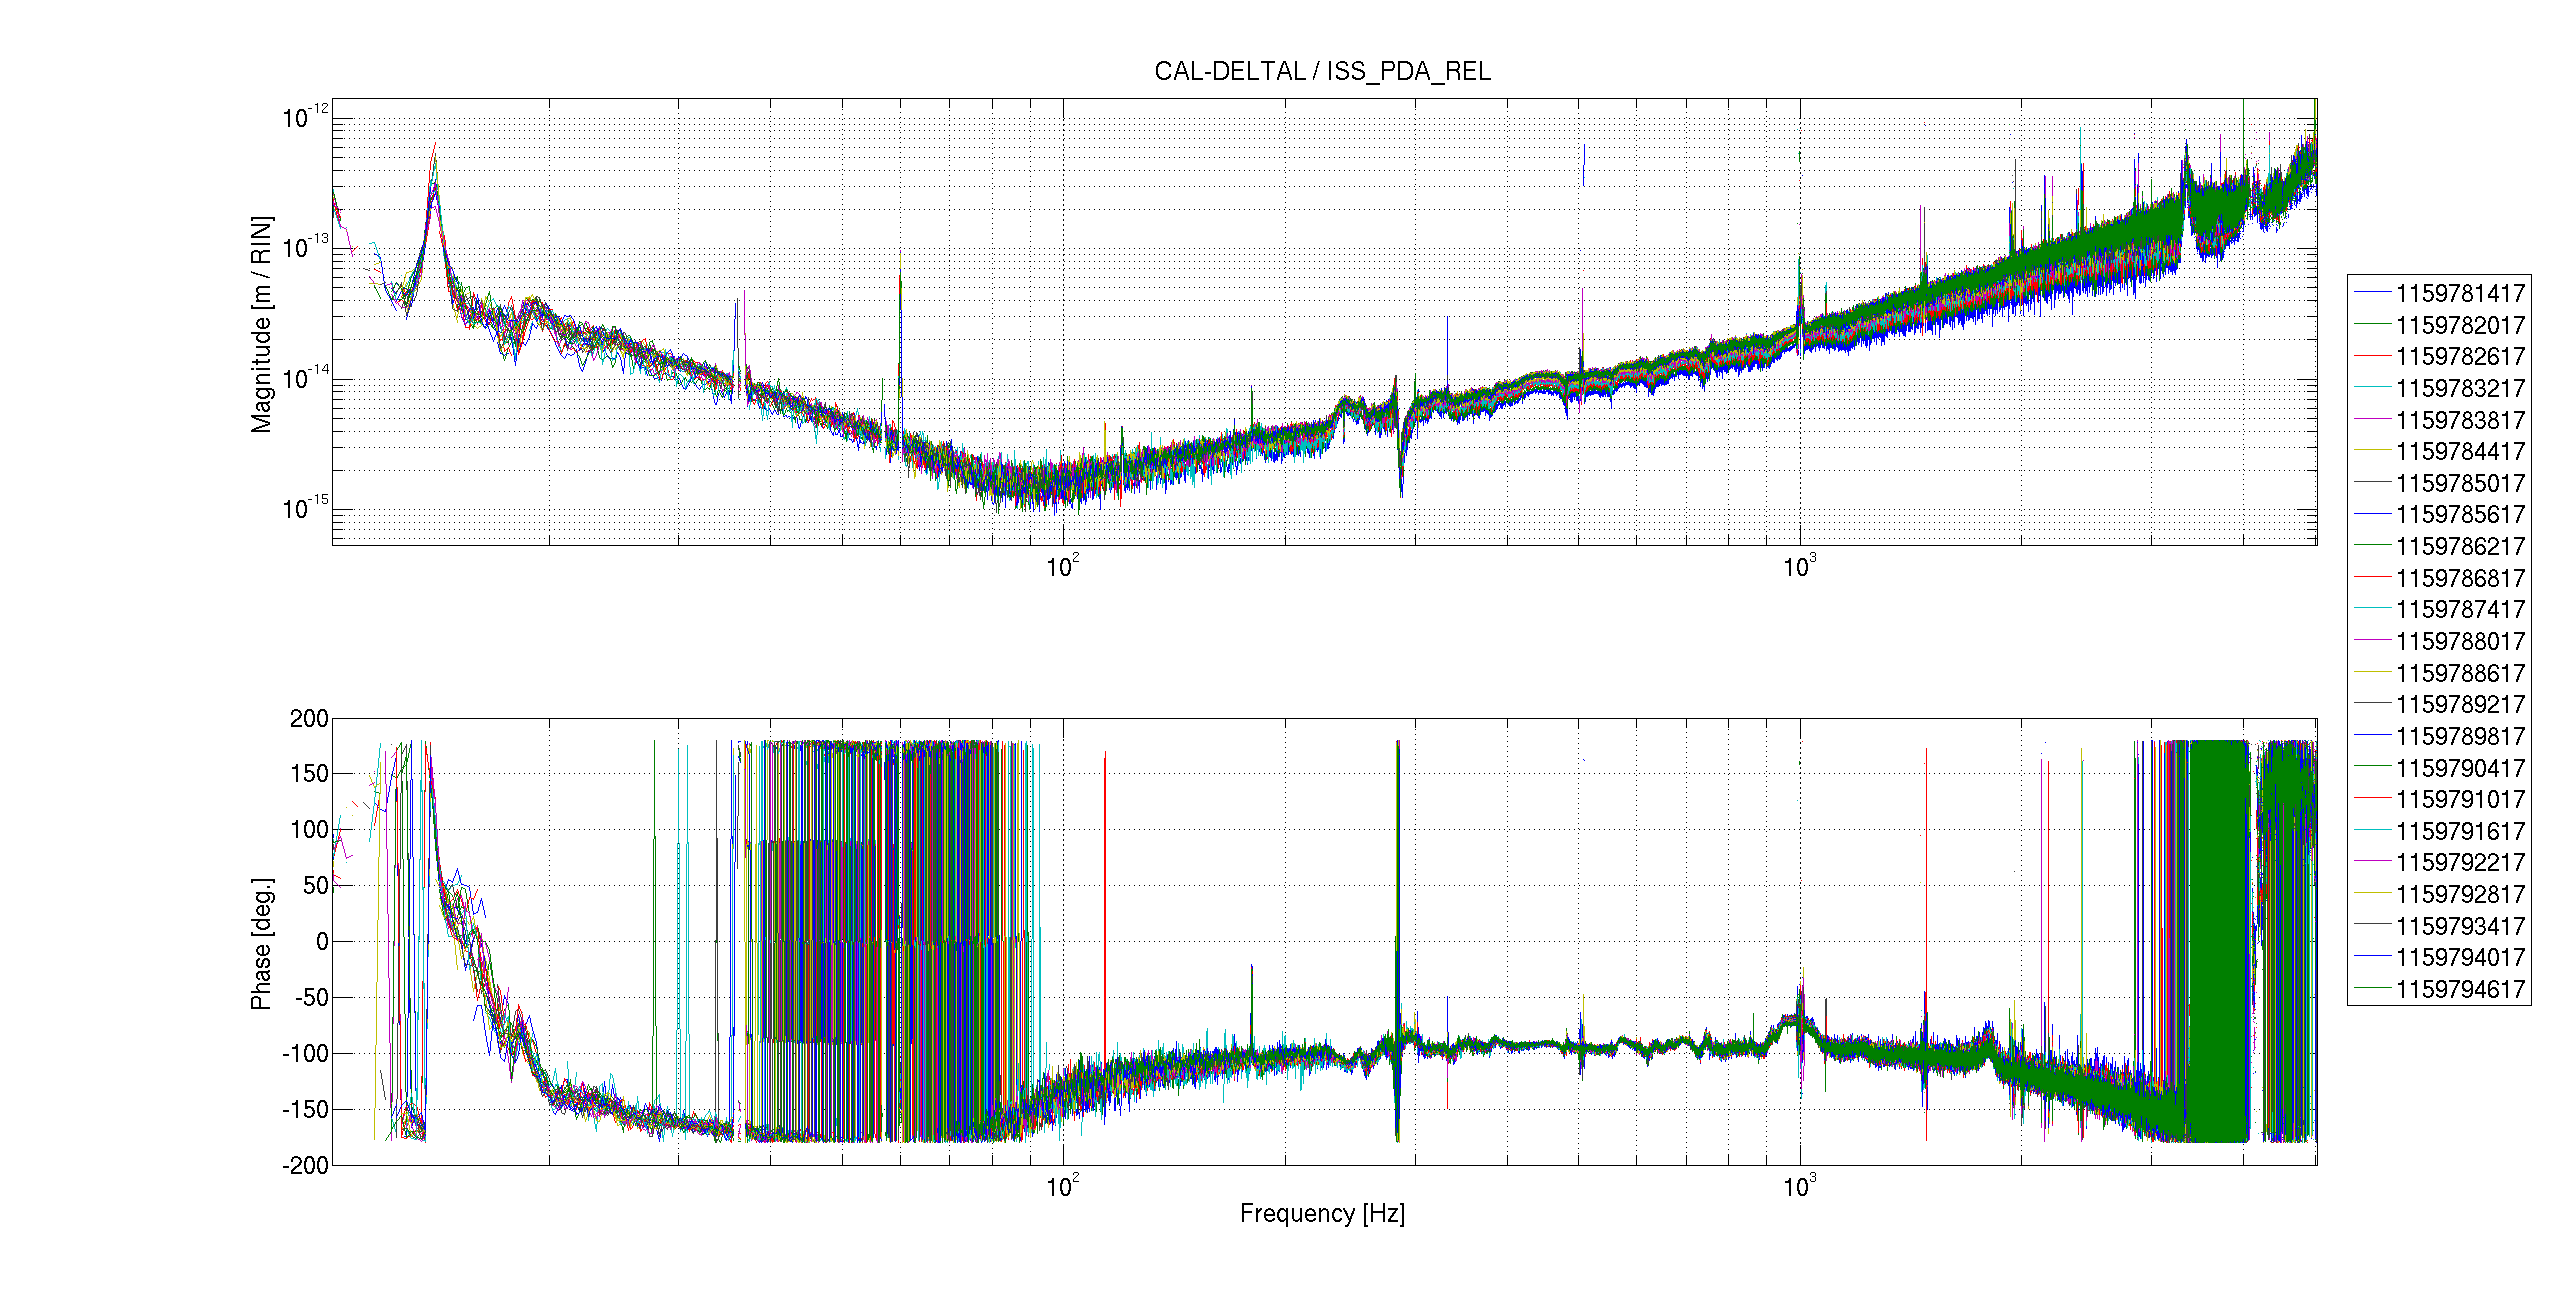
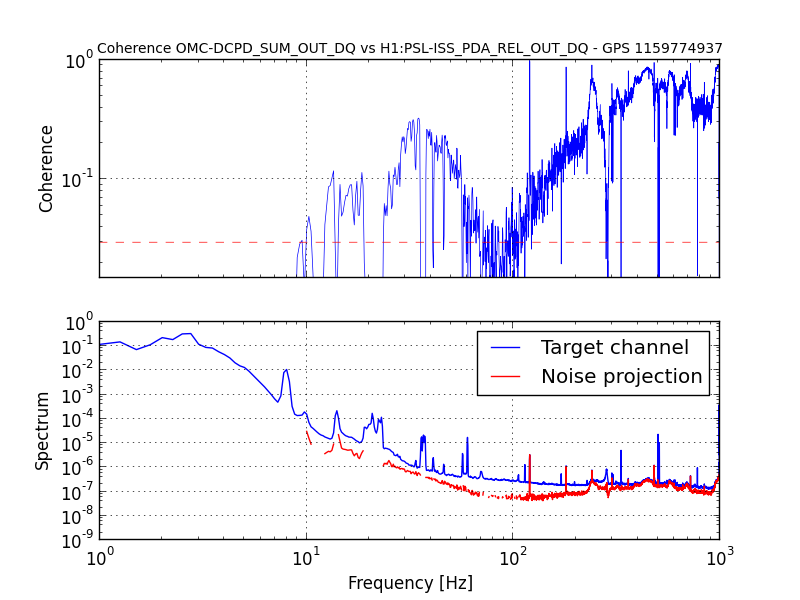
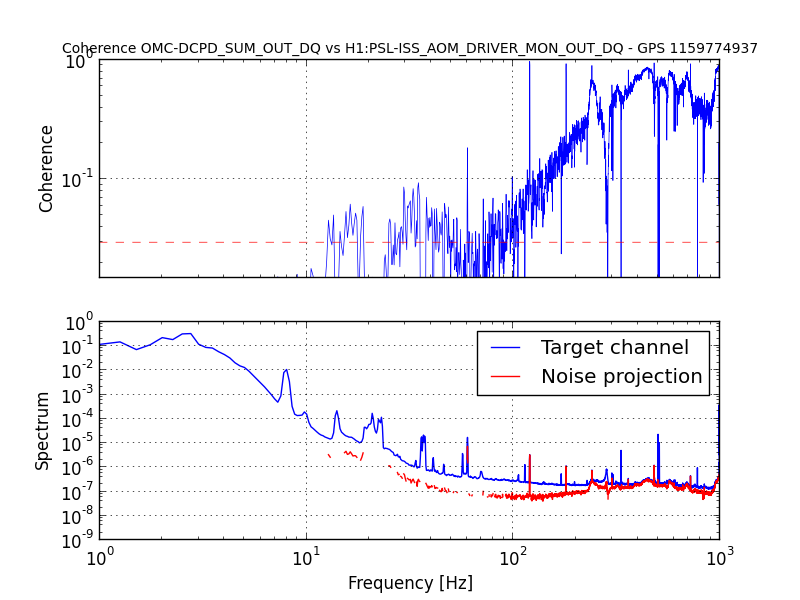
The most interesting coherence is however with the intensity stabilization: PSL-ISS_PDA_REL_OUT and PSL-ISS_PDB_REL_OUT shows quite large coherence, as well as the ISS control signal: PSL-ISS_AOM_DRIVER_MON_OUT. It seems that PDA and PDB (first loop ISS) are completely dominated by what the ISS second loop is doing (as shown by the control signal). The coherence with DARM in the 100-1000 Hz region is very close to one. See fig. 7 and 8.
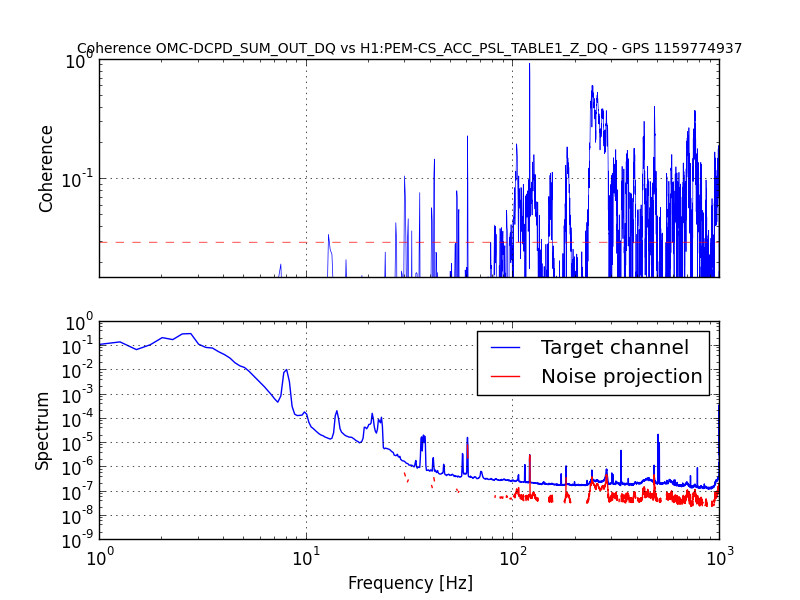
Note that in the same 100-1000 Hz region, the coherence with PSL lab accelerometers is also significant, but mostly on the peaks (fig. 9)
En passant, a narrow feature at 56.75 Hz and 113.50 Hz are coherent with EX magnetometers (PEM-EX_MAG_EBAY_SEIRACK_X/Y PEM-EX_MAG_VEA_FLOOR_Y/Z)
Multicoherence
I selected the channels with the largest coherence from the BruCo report, and run a multicoherence code.
chnames = {'H1:LSC-MICH_OUT_DQ', 'H1:LSC-SRCL_OUT_DQ', 'H1:LSC-PRCL_OUT_DQ', ...

	            'H1:ASC-AS_B_RF45_Q_YAW_OUT_DQ', 'H1:ASC-OMC_B_YAW_OUT_DQ', 'H1:ASC-OMC_B_PIT_OUT_DQ', ...

	            'H1:LSC-REFL_A_RF45_I_ERR_DQ', 'H1:LSC-REFL_A_RF9_Q_ERR_DQ', 'H1:IMC-WFS_A_DC_PIT_OUT_DQ', ...

	            'H1:IMC-WFS_B_DC_PIT_OUT_DQ', 'H1:IMC-WFS_A_I_YAW_OUT_DQ', 'H1:IMC-WFS_A_Q_YAW_OUT_DQ', ...

	            'H1:PSL-ISS_AOM_DRIVER_MON_OUT_DQ', 'H1:PSL-ISS_PDA_REL_OUT_DQ', 'H1:PSL-ISS_PDB_REL_OUT_DQ', ...

	            'H1:PSL-ISS_SECONDLOOP_RIN_INNER_OUT_DQ', 'H1:PSL-ISS_SECONDLOOP_RIN_OUTER_OUT_DQ', ...

	            'H1:PSL-PMC_HV_MON_OUT_DQ', 'H1:IMC-IM4_TRANS_SUM_OUT_DQ', ...

	            'H1:PEM-CS_ACC_PSL_TABLE1_X_DQ', 'H1:PEM-CS_ACC_PSL_TABLE1_Y_DQ', 'H1:PEM-CS_ACC_PSL_TABLE1_Z_DQ', ...

	            'H1:PEM-CS_ACC_PSL_PERISCOPE_X_DQ'};
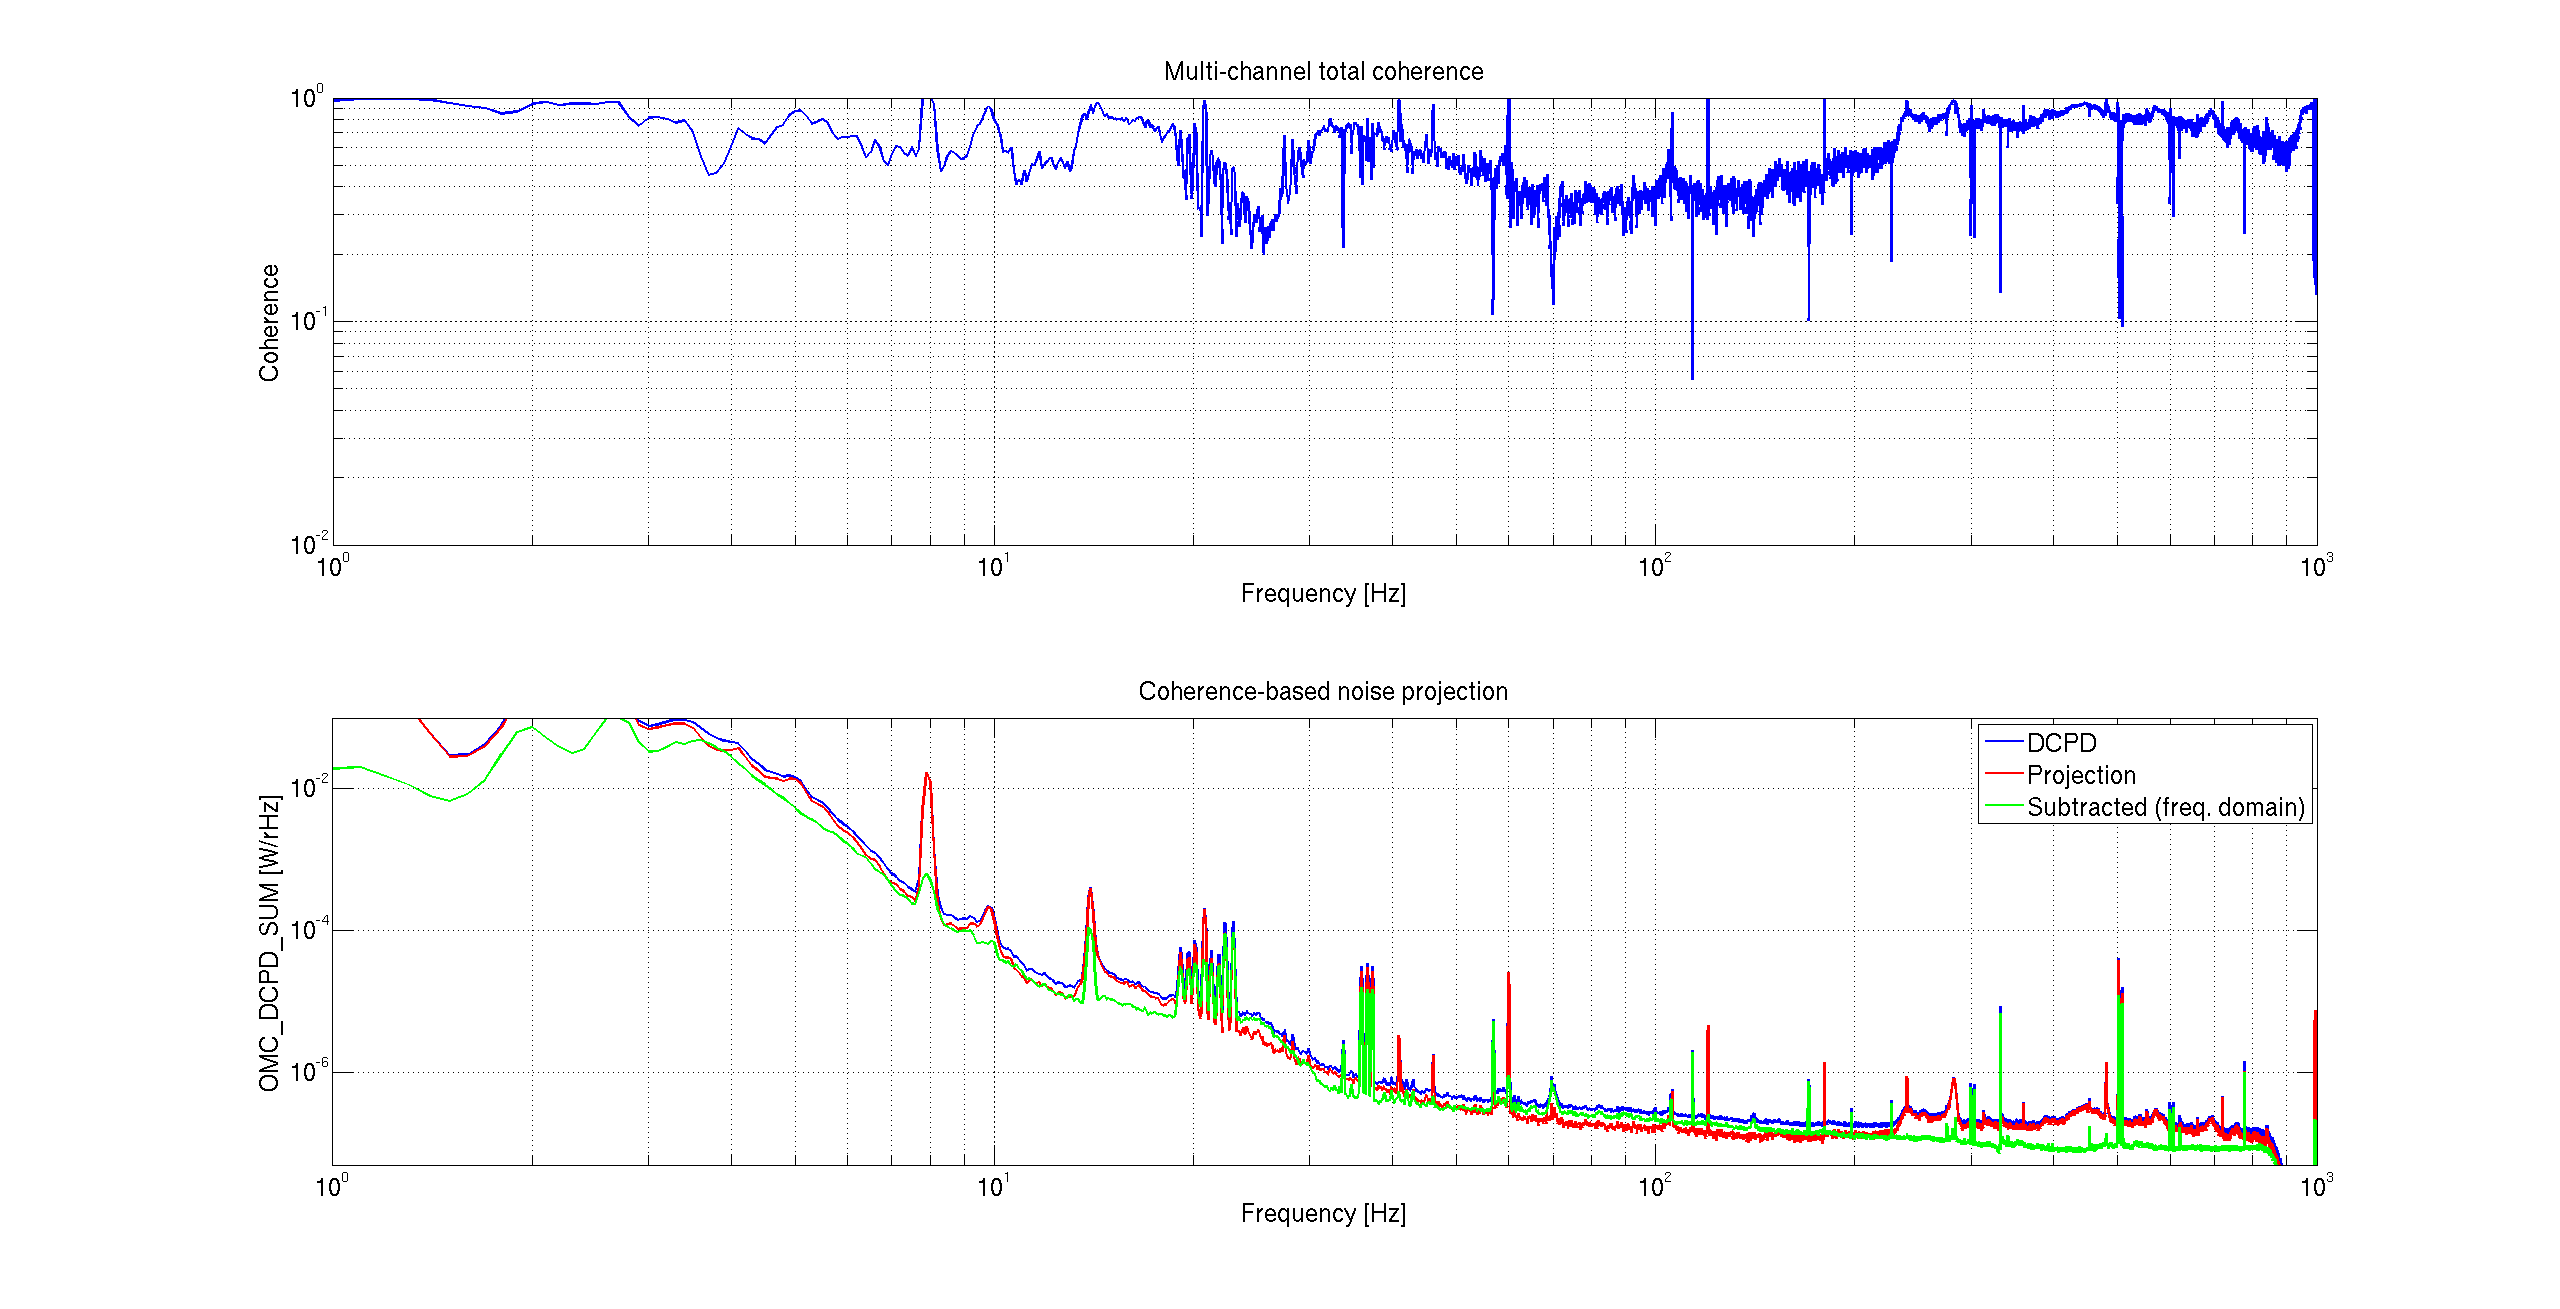
The code take into account the cross-coherences between channels and produce the total coherence and an estimate of the noise projection, base on that coherence. The last figure (10) shows this coherence and the projection into the DCPD signal. A lot of noise can be explained by the coherences.