aaron.viets@LIGO.ORG - posted 14:42, Tuesday 01 November 2016 (31074)
Updated Kappa Comparison between SLM tool and GDS pipeline with minor bug fix
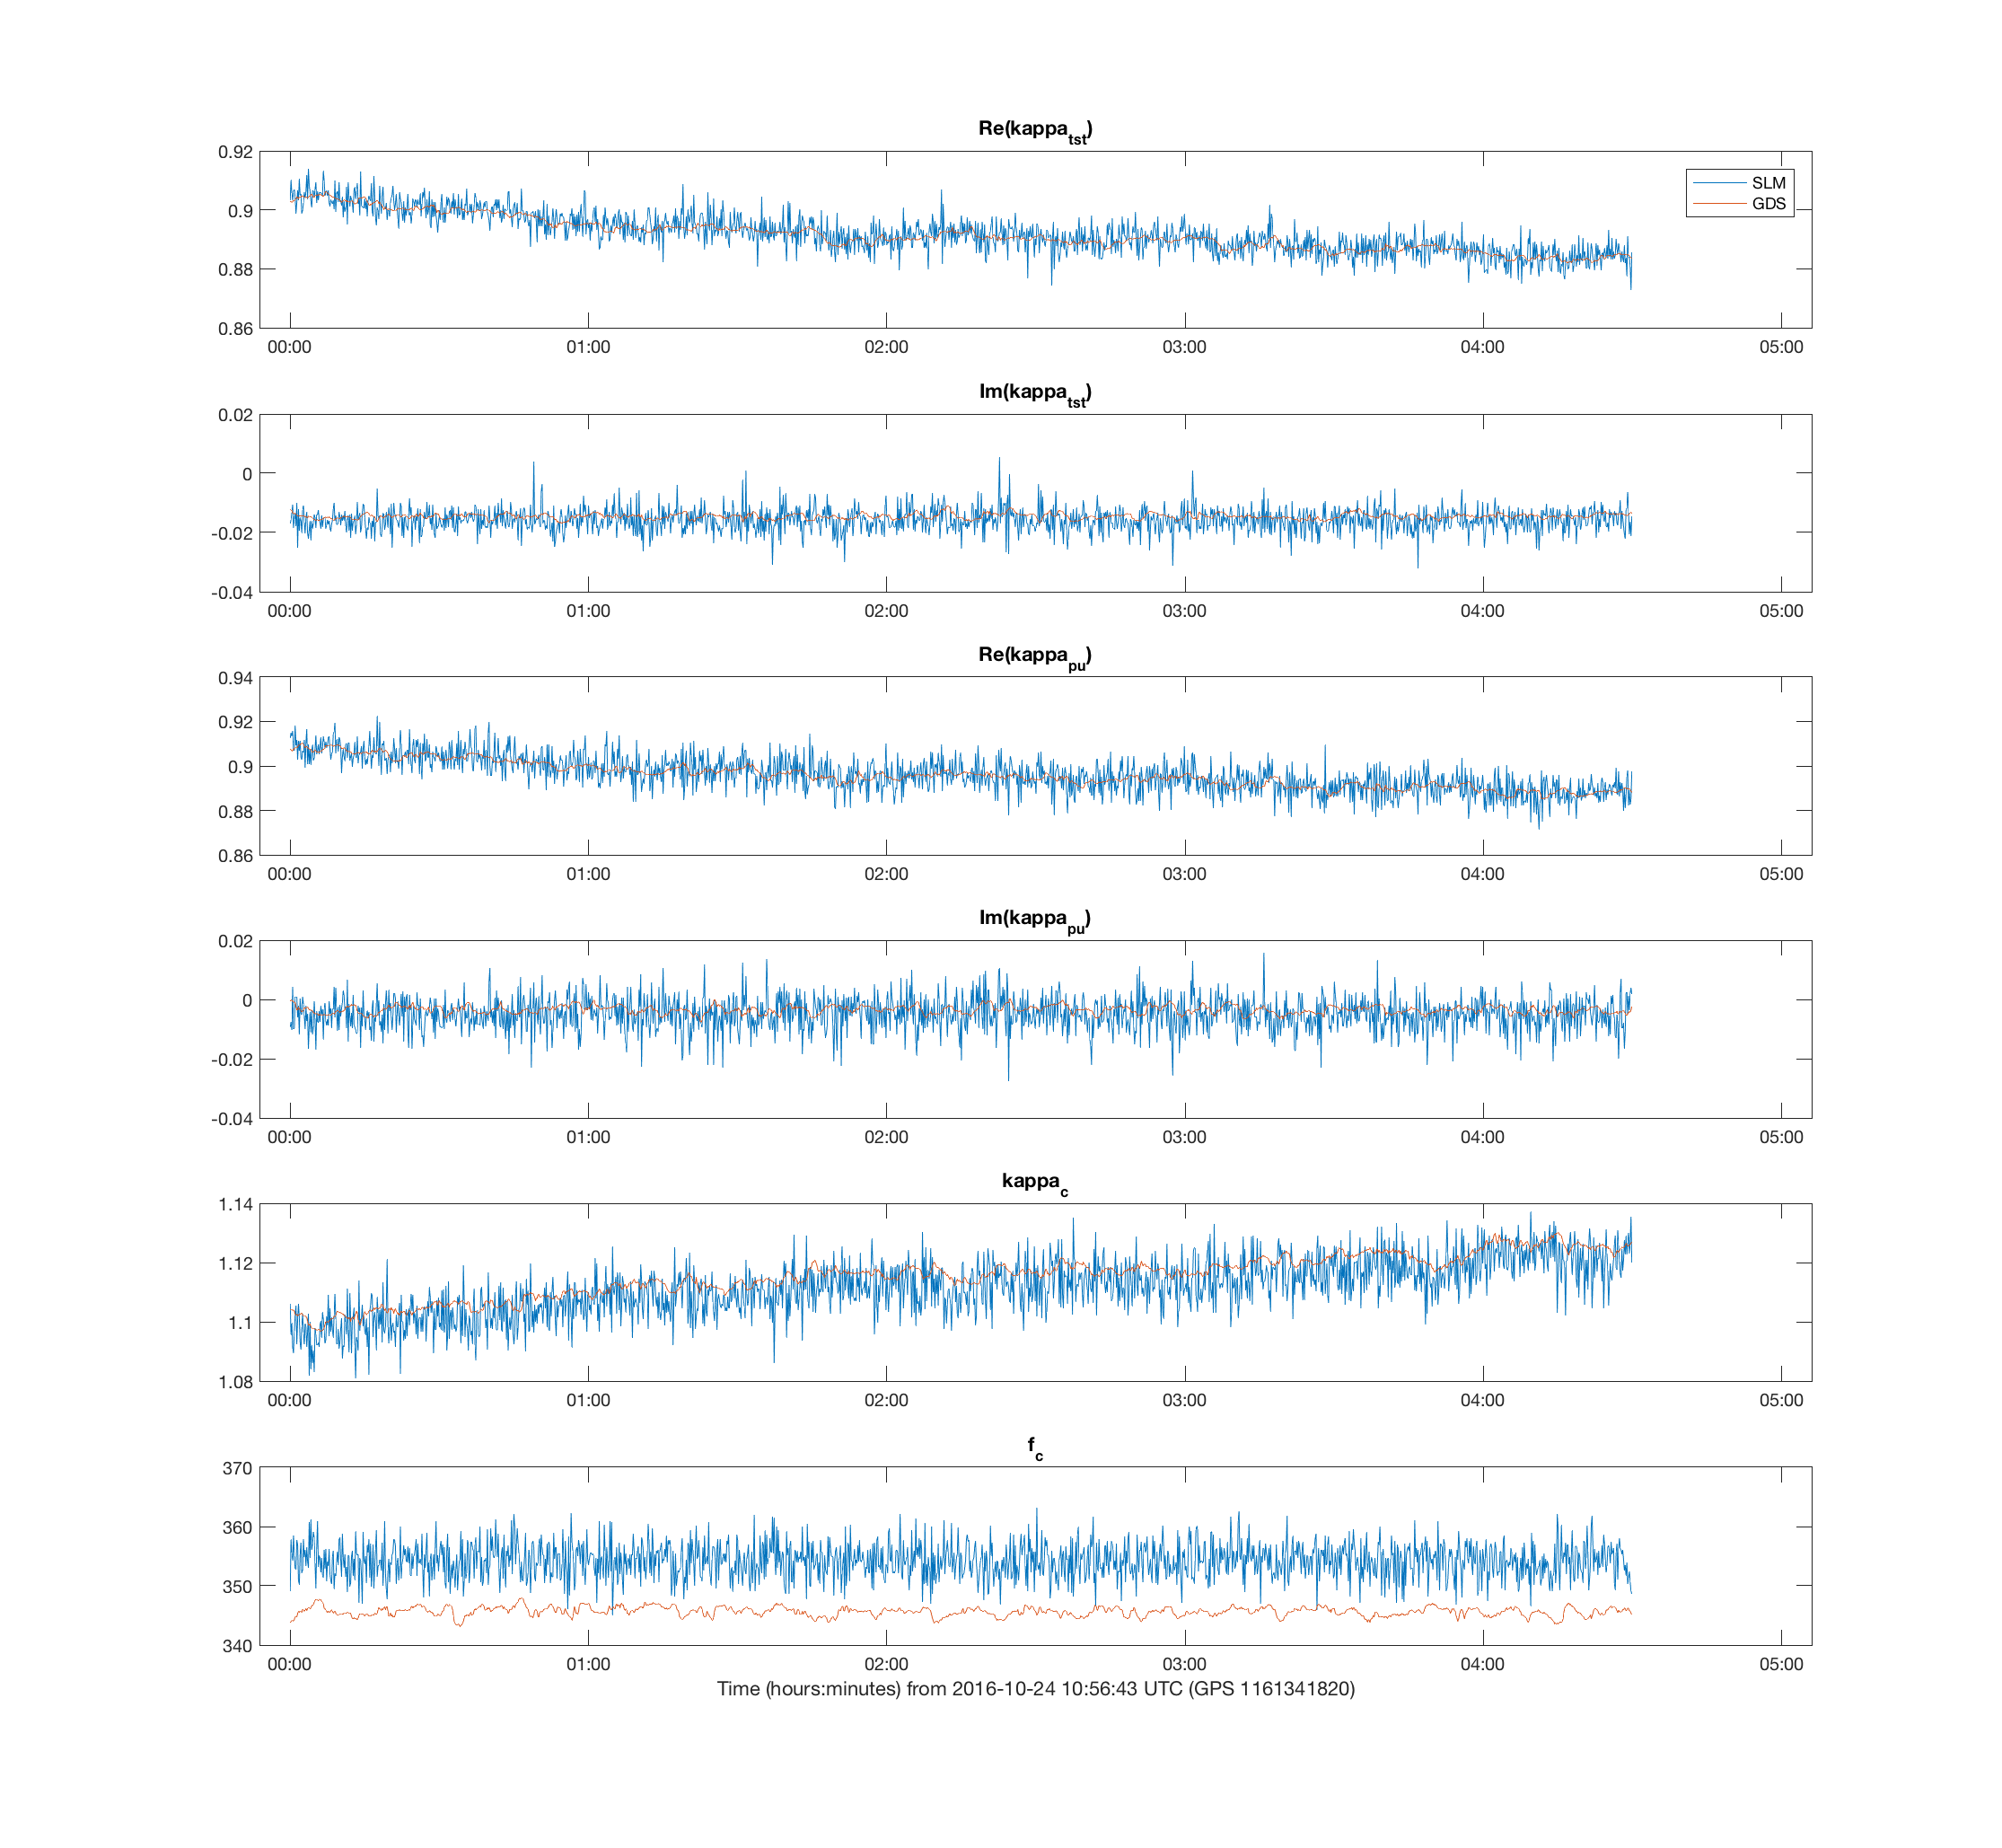
I applied a bug fix suggested by John Zweizig in the demodulation routine in the GDS pipeline that reduces error due to finite machine precision. After this, it appears that the kappas as computed by GDS, especially the cavity pole, are significantly less noisy, but still not in agreement with the SLM tool (See this aLOG for reference: https://alog.ligo-wa.caltech.edu/aLOG/index.php?callRep=30888).
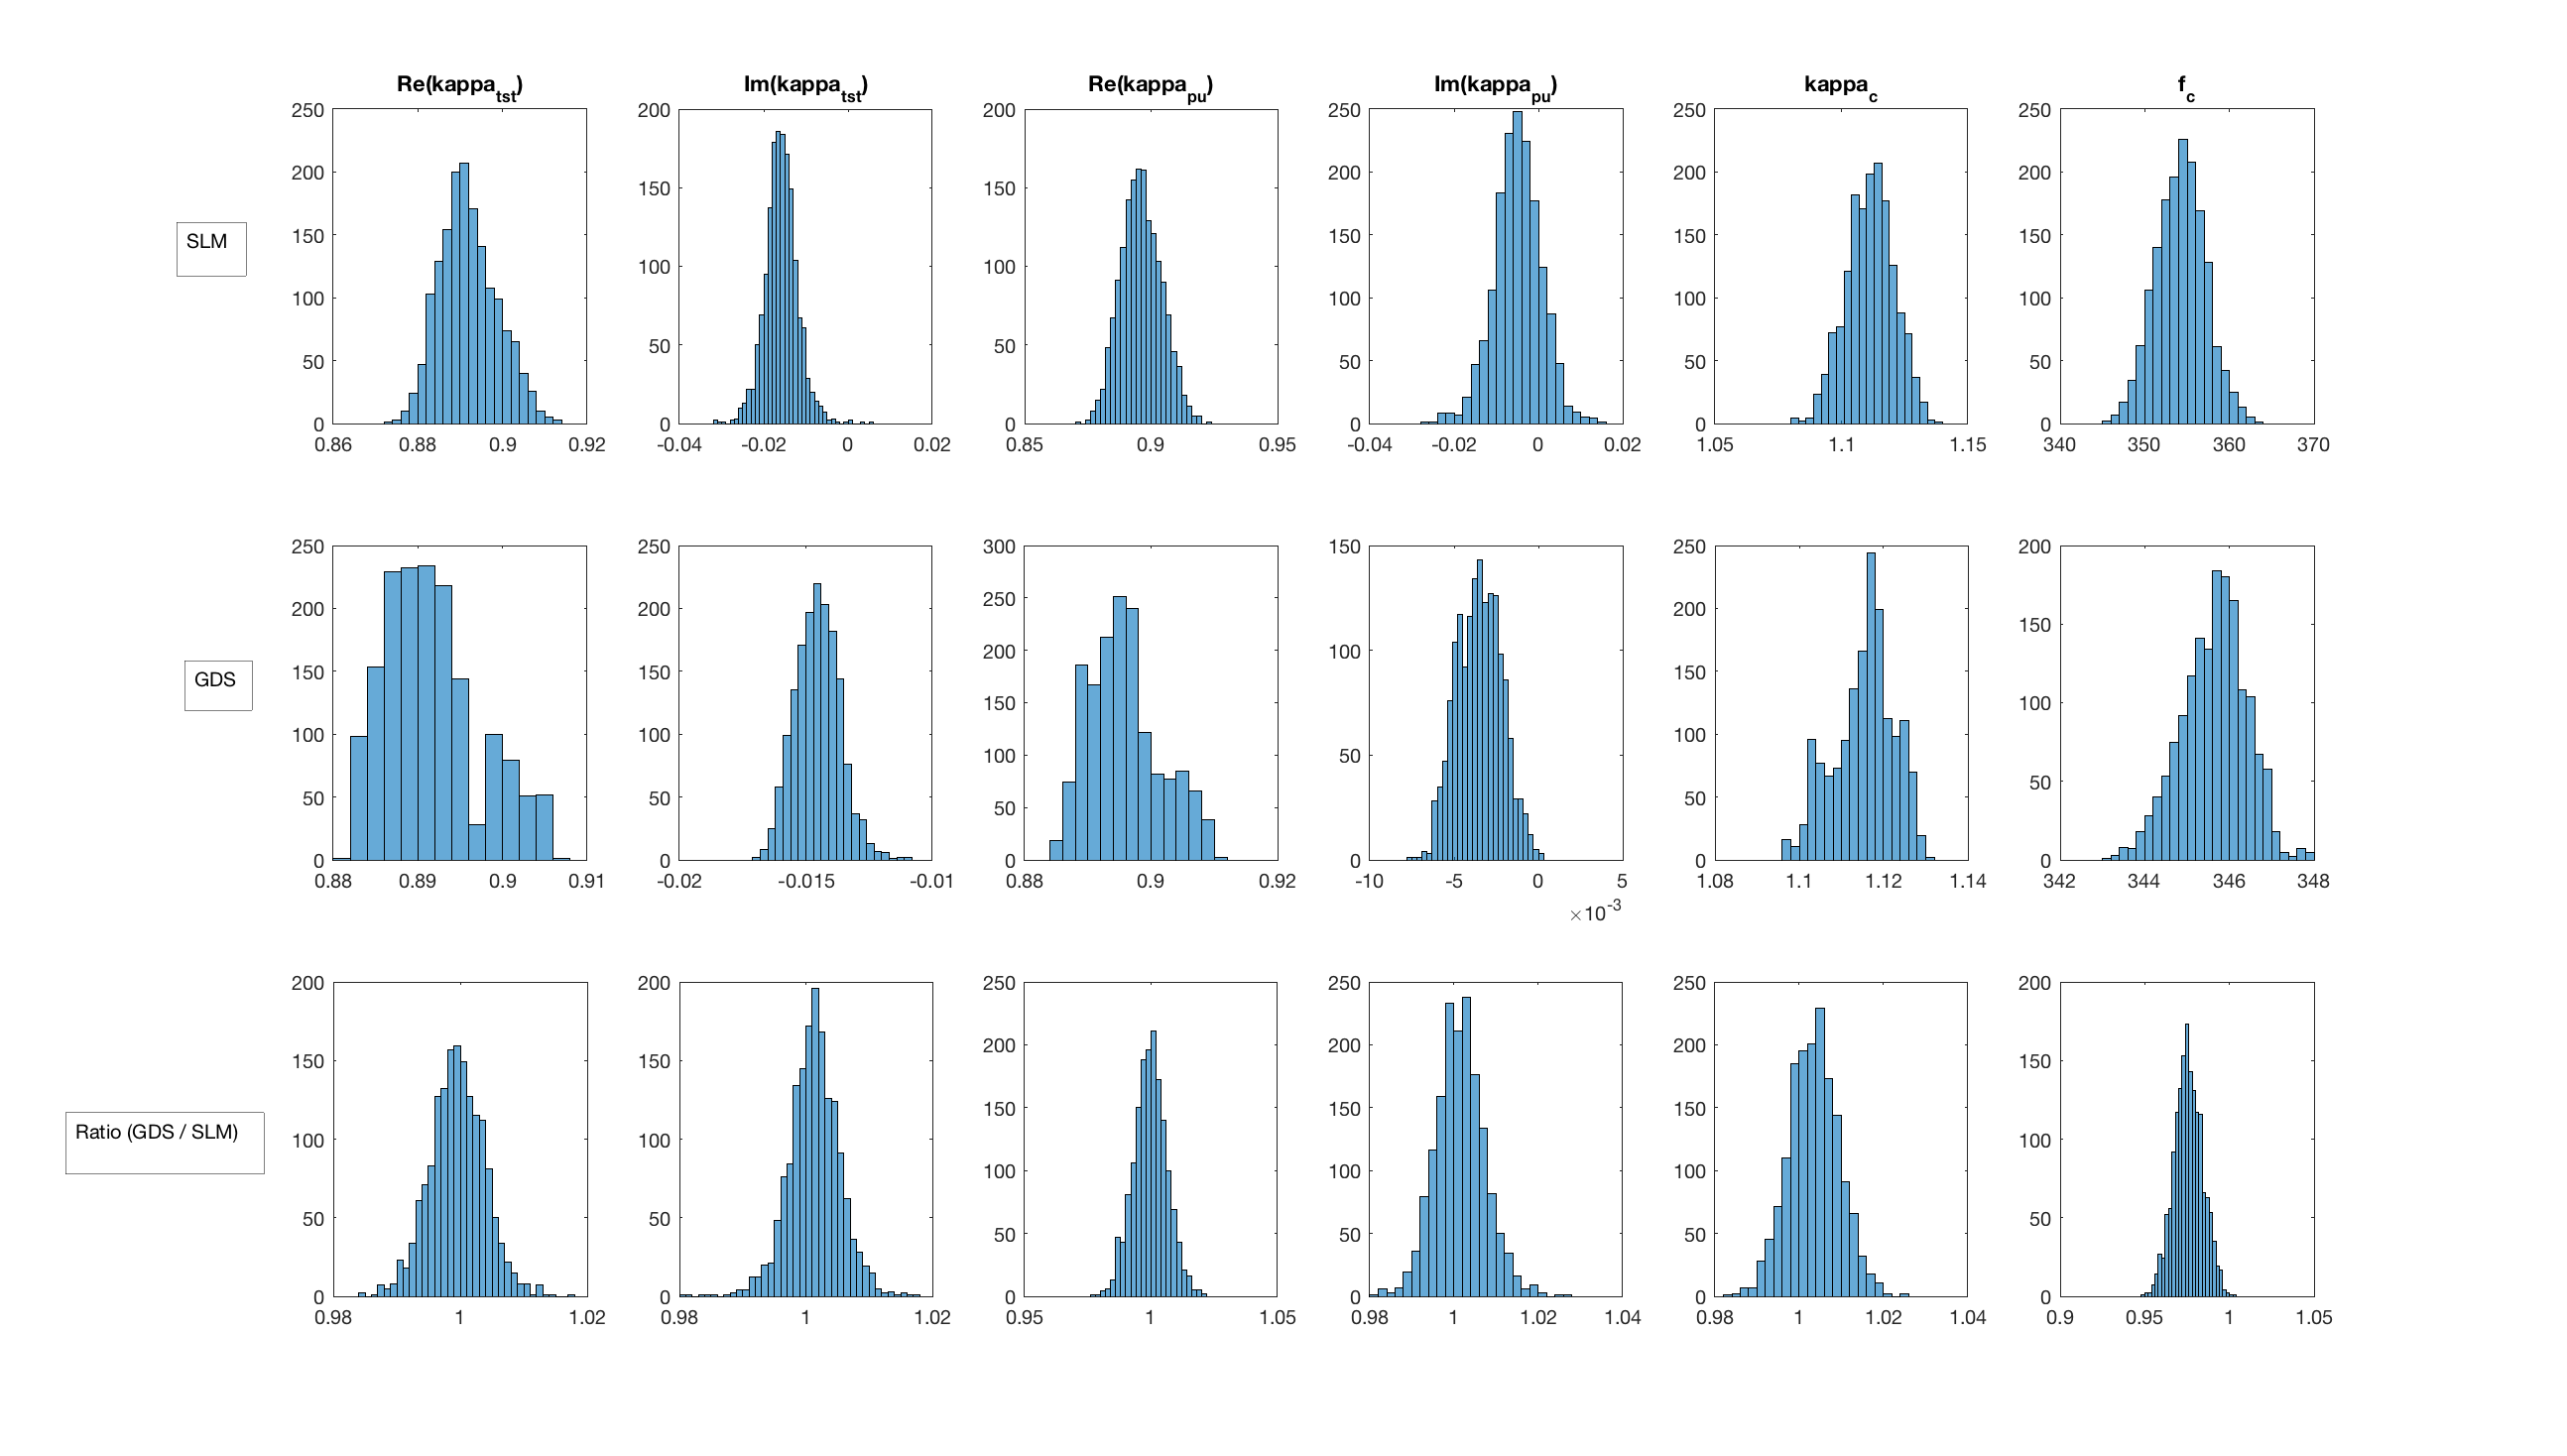
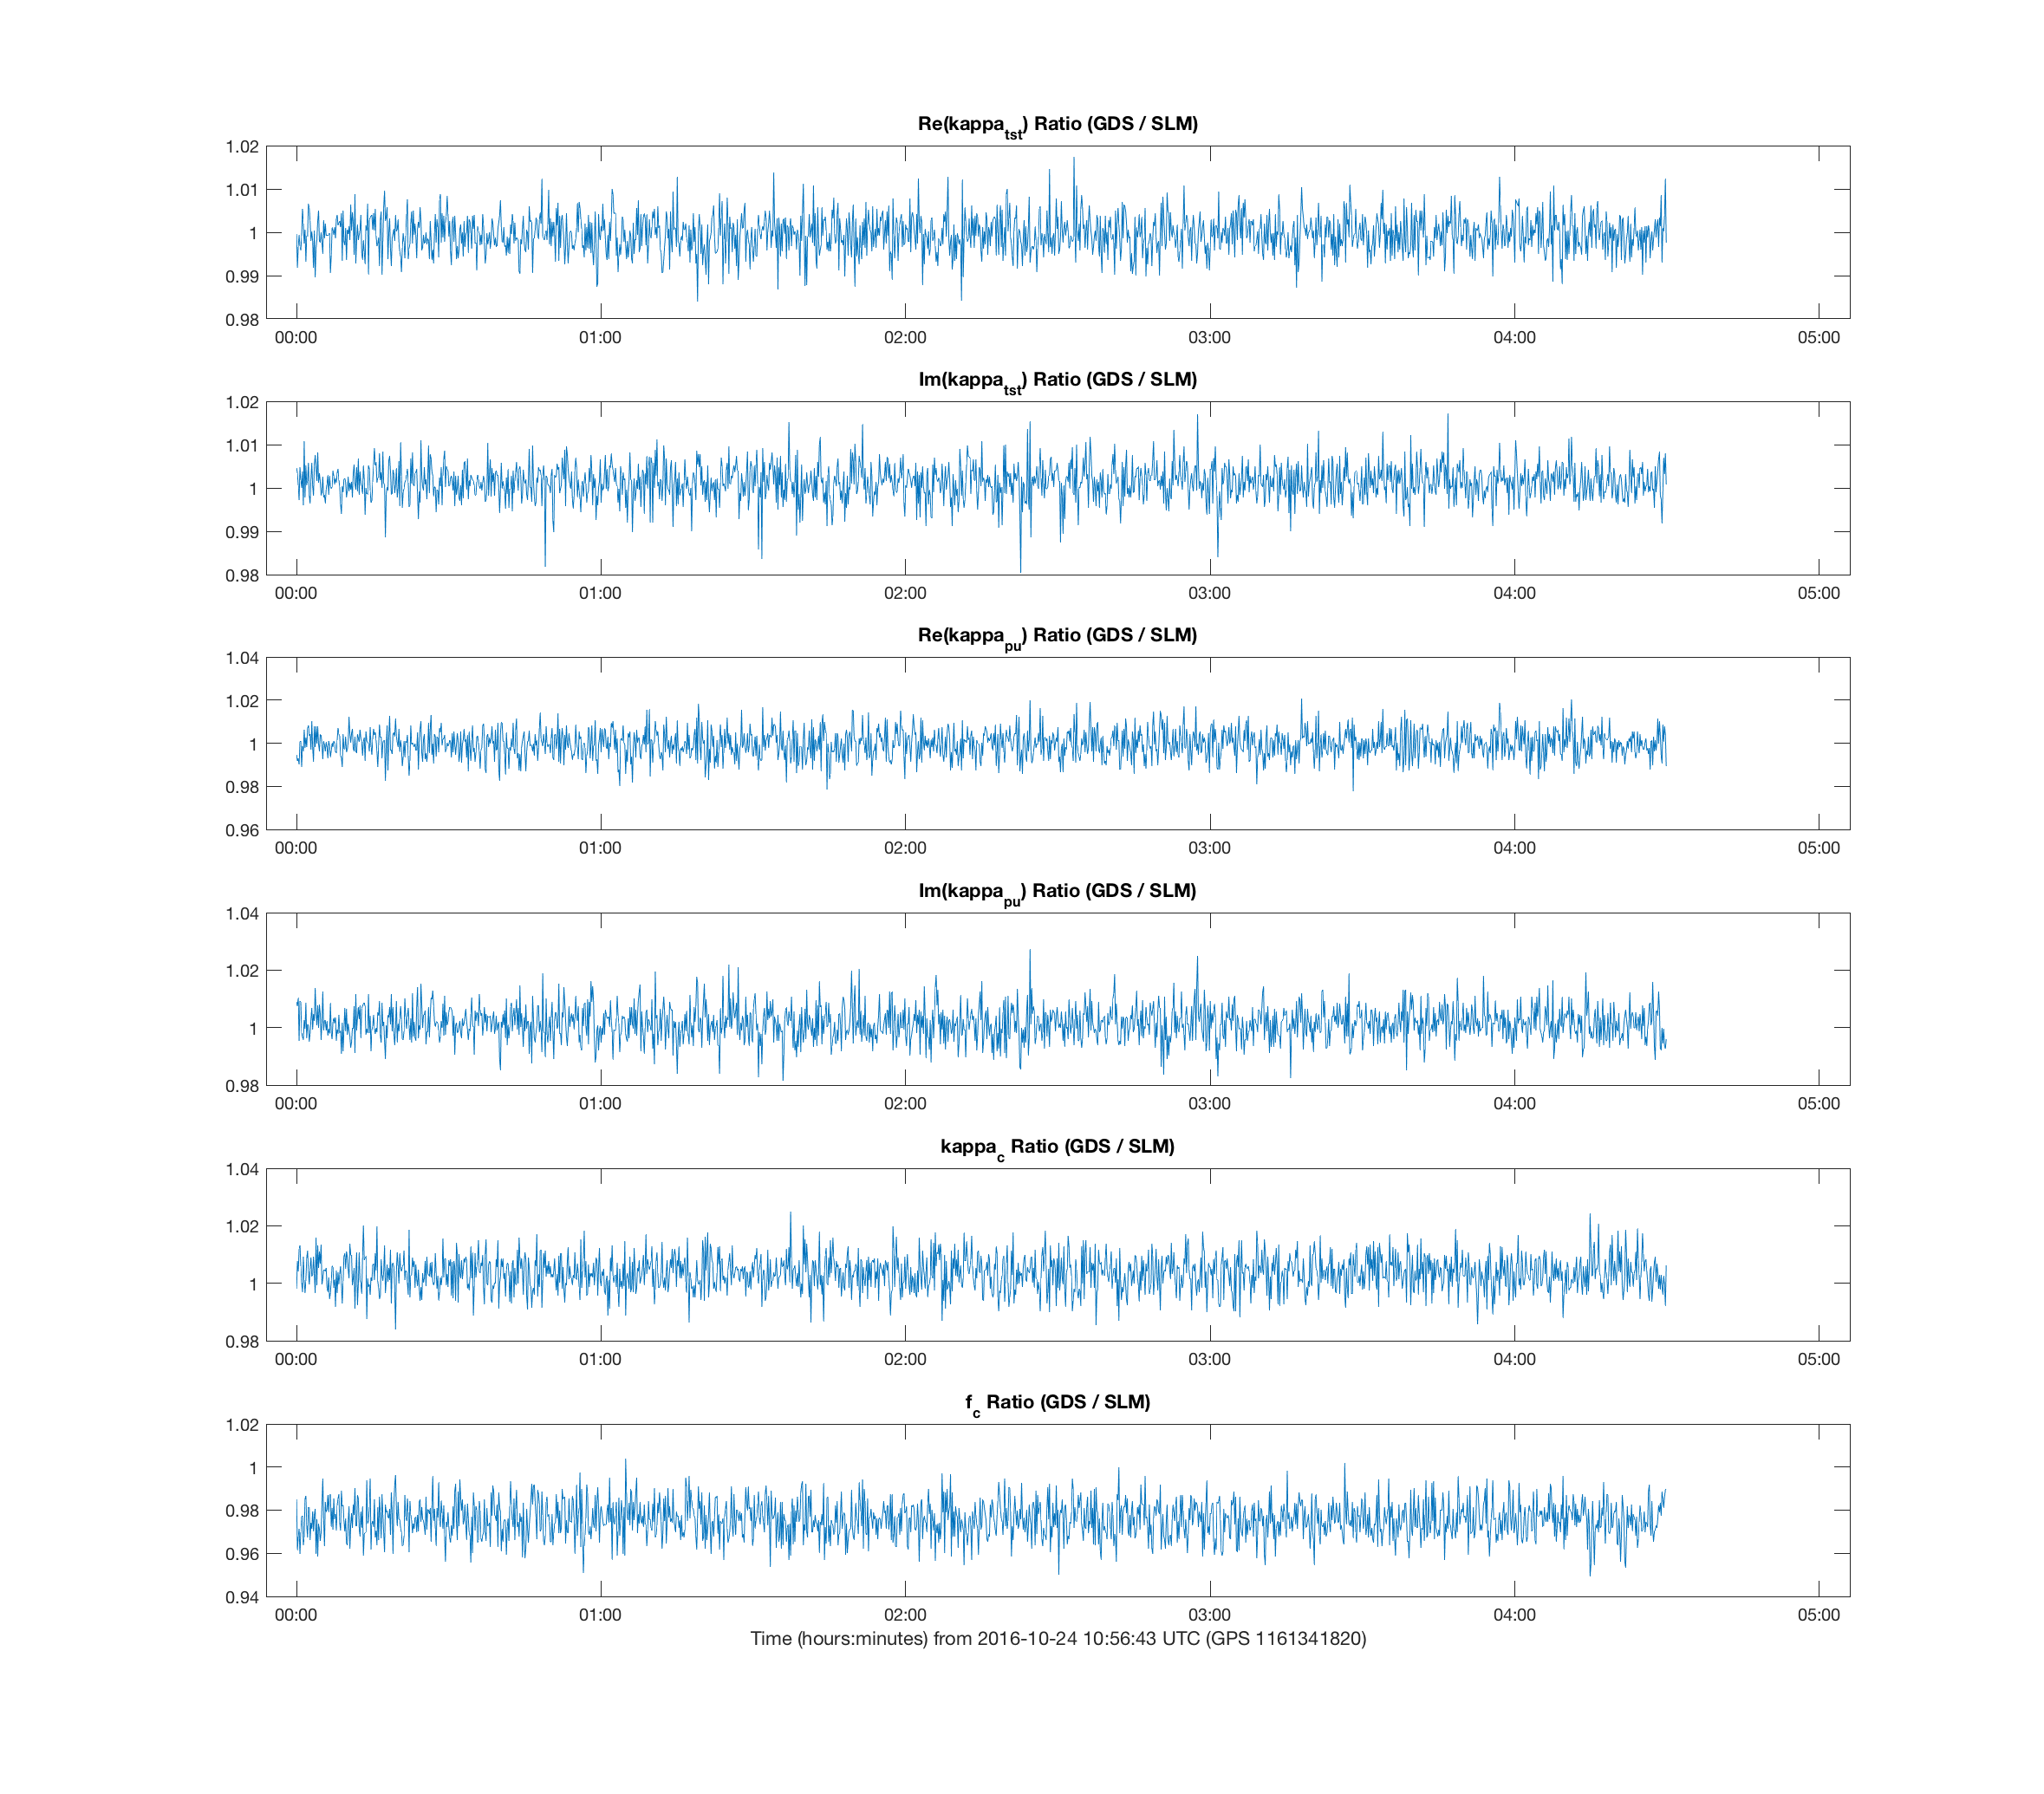
Below is a table of mean and standard deviation values for the data taken from GDS, SLM, and the ratio GDS / SLM:
SLM mean SLM std GDS mean GDS std ratio mean ratio std
Re(kappa_tst) 0.8920 0.0068 0.8916 0.0056 0.9995 0.0043
Im(kappa_tst) -0.0158 0.0039 -0.0145 0.0008882 1.0013 0.0041
Re(kappa_pu) 0.8961 0.0080 0.8958 0.0057 0.9997 0.0065
Im(kappa_pu) -0.0050 0.0056 -0.0035 0.0013 1.0015 0.0059
kappa_c 1.1115 0.0094 1.1154 0.0072 1.0035 0.0060
f_c 354.2338 2.9305 345.6435 0.7686 0.9758 0.0084
Here are covariance matrices and correlation coefficient matrices between SLM and GDS:
Covariance Correlation
Re(kappa_tst)
1.0e-04 *
0.4615 0.3157 1.0000 0.8238
0.3157 0.3181 0.8238 1.0000
Im(kappa_tst)
1.0e-04 *
0.1506 0.0007 1.0000 -0.0216
0.0007 0.0079 -0.0216 1.0000
Re(kappa_pu)
1.0e-04 *
0.6387 0.3113 1.0000 0.6866
0.3113 0.3219 0.6866 1.0000
Im(kappa_pu)
1.0e-04 *
0.3139 -0.0036 1.0000 -0.0490
-0.0036 0.0174 -0.0490 1.0000
kappa_c
1.0e-04 *
0.8895 0.4815 1.0000 0.7118
0.4815 0.5144 0.7118 1.0000
f_c
8.5876 -0.0023 1.0000 -0.0010
-0.0023 0.5908 -0.0010 1.0000
Plots and histograms are attached.
Images attached to this report