Evan, Sheila, Jenne
The overall message: looking at refl control and IMC control signals leads to different conculsion about our frequency noise, but we can slightly improve our DARM noise at high frequencies by engaging an additional boost in the IMC. The sensing noise should be large enough to see on the DBB, so it would be helpful to get the DBB running again.
IMC control signal suggests a lot of excess IMC sensing noise:
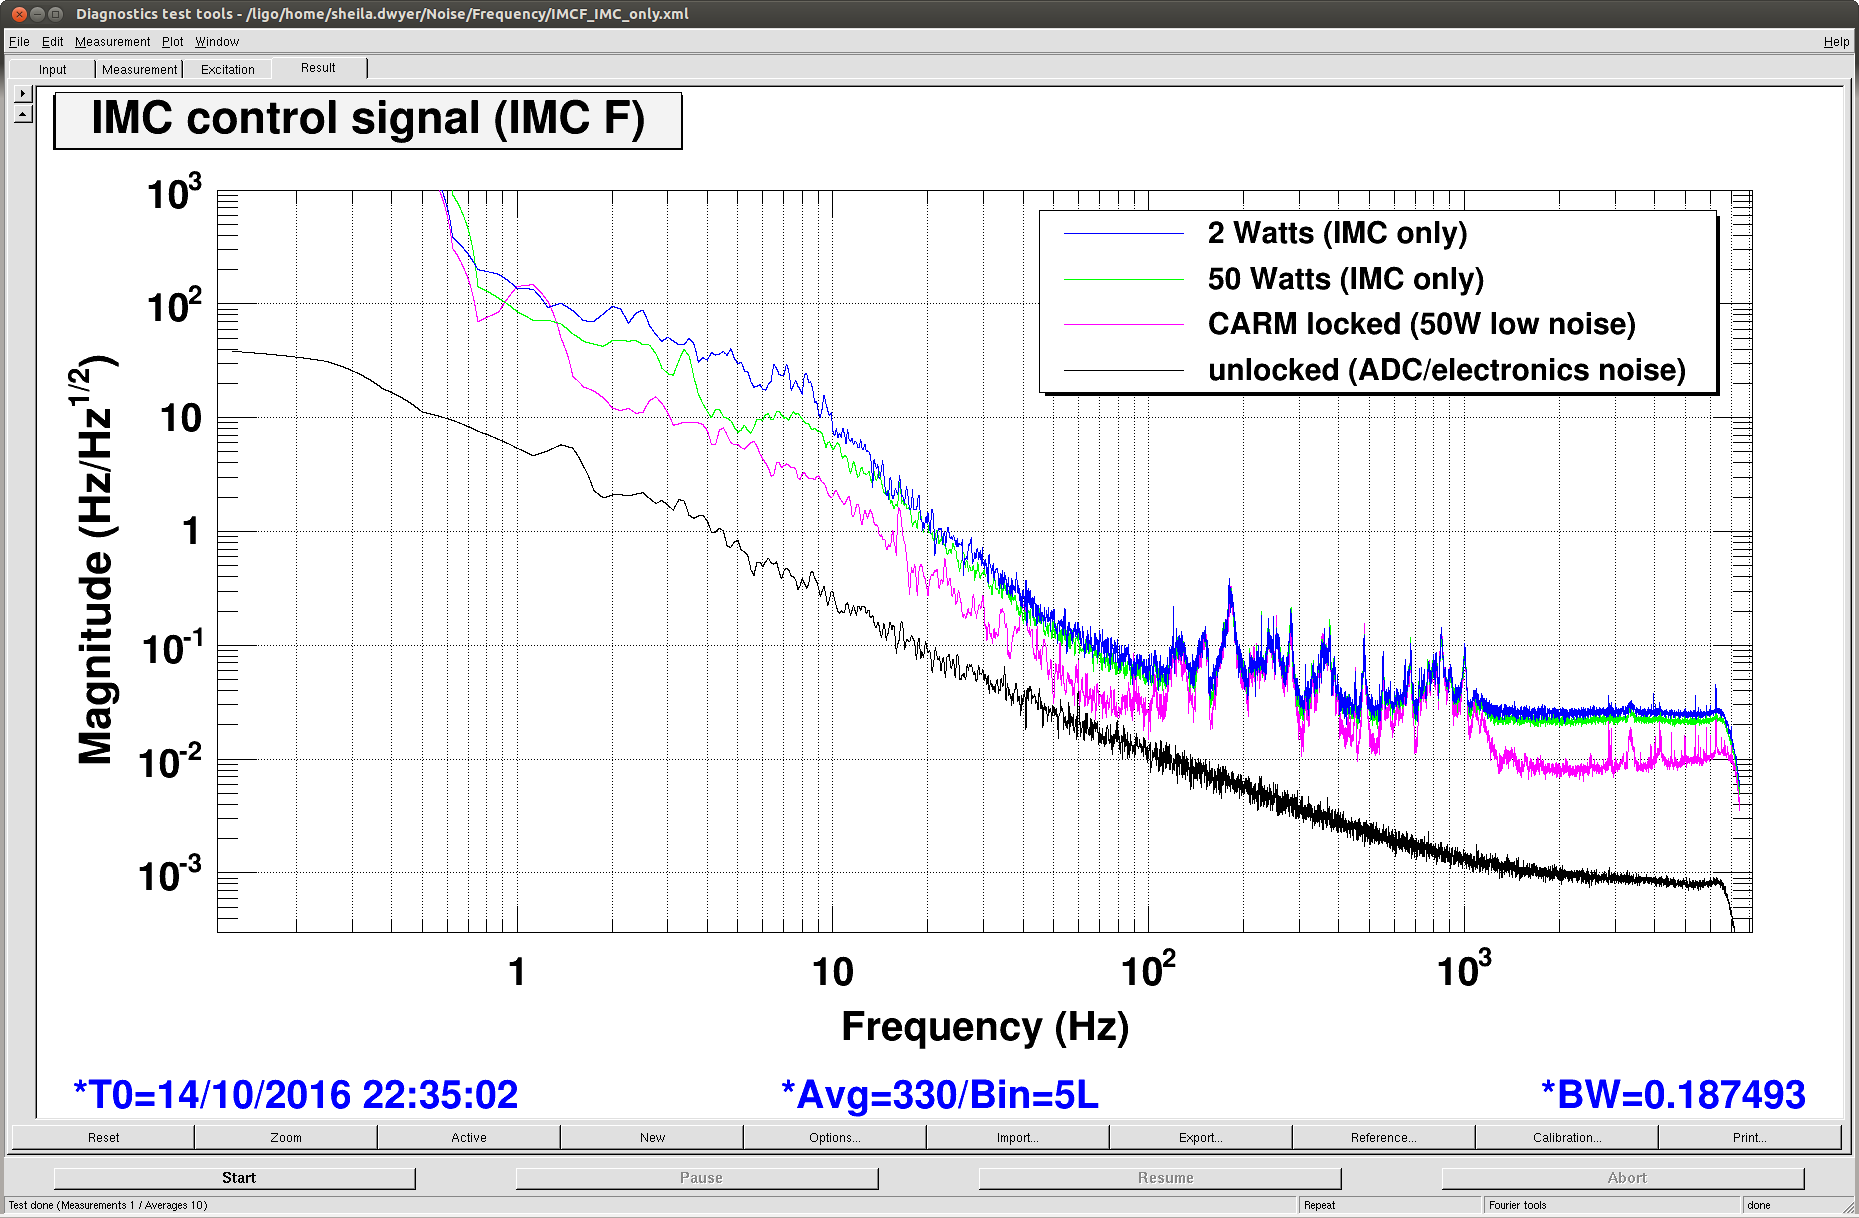
Yesterday afternoon Evan and I looked again at the frequency noise as seen in IMC control signal. The attached screenshot shows the IMCF spectrum with and without CARM locked.
We think that when the mode cleaner is locked the IMC control signal should be the sum of:
-
Laser frequency noise supressed by the FSS
-
Ref cav sensor noise impressed by the FSS
-
IMC sensor noise impressed by the IMC loop
-
VCO noise
Once CARM is locked, it will be the sum of:
-
laser frqeuency noise supressed by FSS
-
Ref cav sensor noise impressed by the FSS
-
IMC sensor noise supressed by the CARM loop
-
VCO noise supressed by the CARM loop
-
REFL sensor noise impressed by the CARM loop
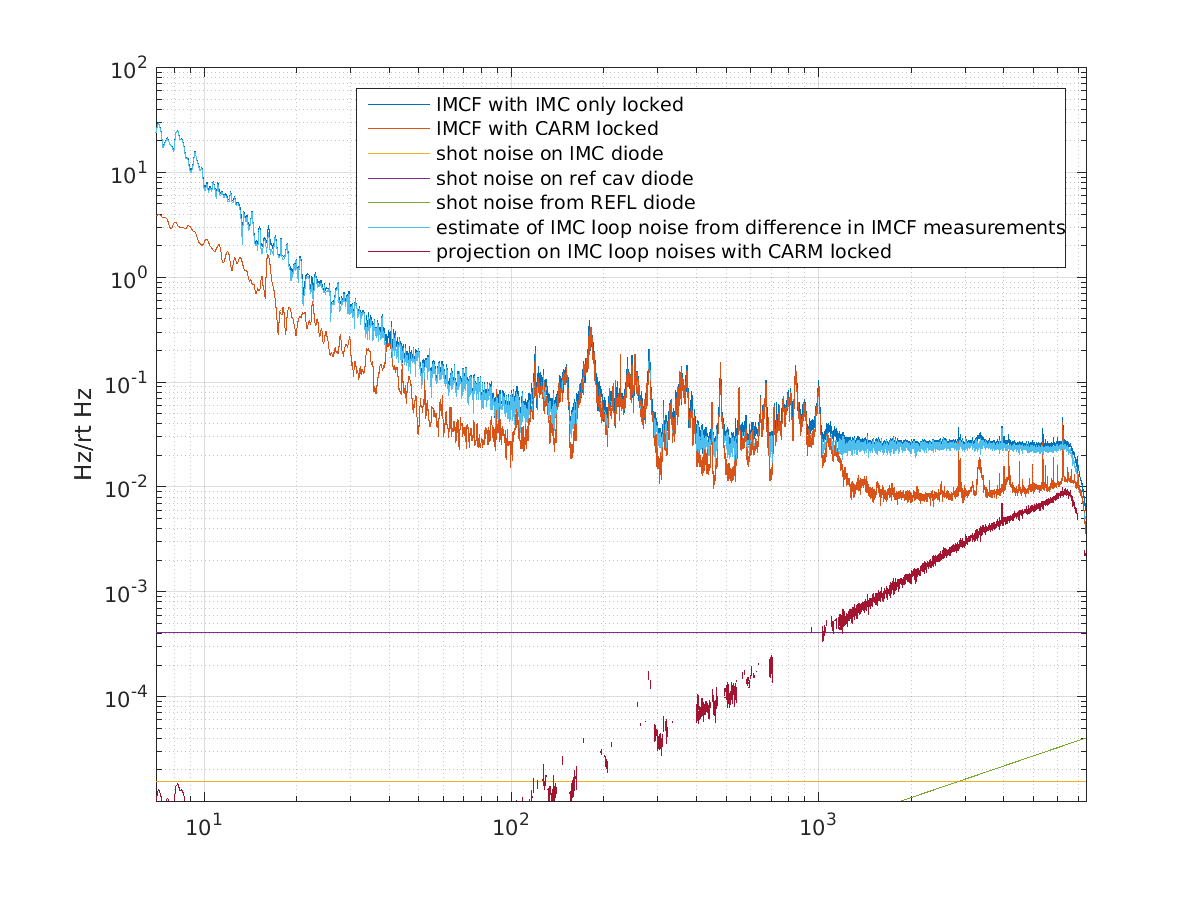
Between 100Hz and 1kHz, the noise stays in the same with and without CARM locked, so this noise should be either laser noise or ref cav sensor noise imposed by the laser. The noise which goes away when we lock CARM should be IMC sensing noise or VCO noise. Since there isn't any frequency where locking CARM increases the noise in IMCF, this measurement gives us an upper limit on the REFL9 sensing noise.
We think that the IMC shot noise should be abot 15uHz/rt Hz, the ref cav shot noise should be about 0.4mHz/rt Hz, and the shot noise on refl 9 should be about 5uHz/rt Hz at 1kHz, increasing as f. The second attached png shows the measurements for IMC with and without the mode cleaner locked, the estimated levels of shot noise we would expect to see in there and in maroon an estimate of the where the IMC loop noise should appear when CARM is locked. If you believe that and make a projection to the light blue and maroon traces are IMC sensor noise and make a projection to Watts on refl 9, then to DARM using the measurements posted here, I predict a noise in DARM of around 1-2e-21 m/rt Hz at 100 Hz. There are several things that don't quite make sense, the projection doesn't agree with the measured REFL9 spectrum or Evan's estimate of the REFL 9 spectrum using the refl control signal (those things don't agree with each other either).
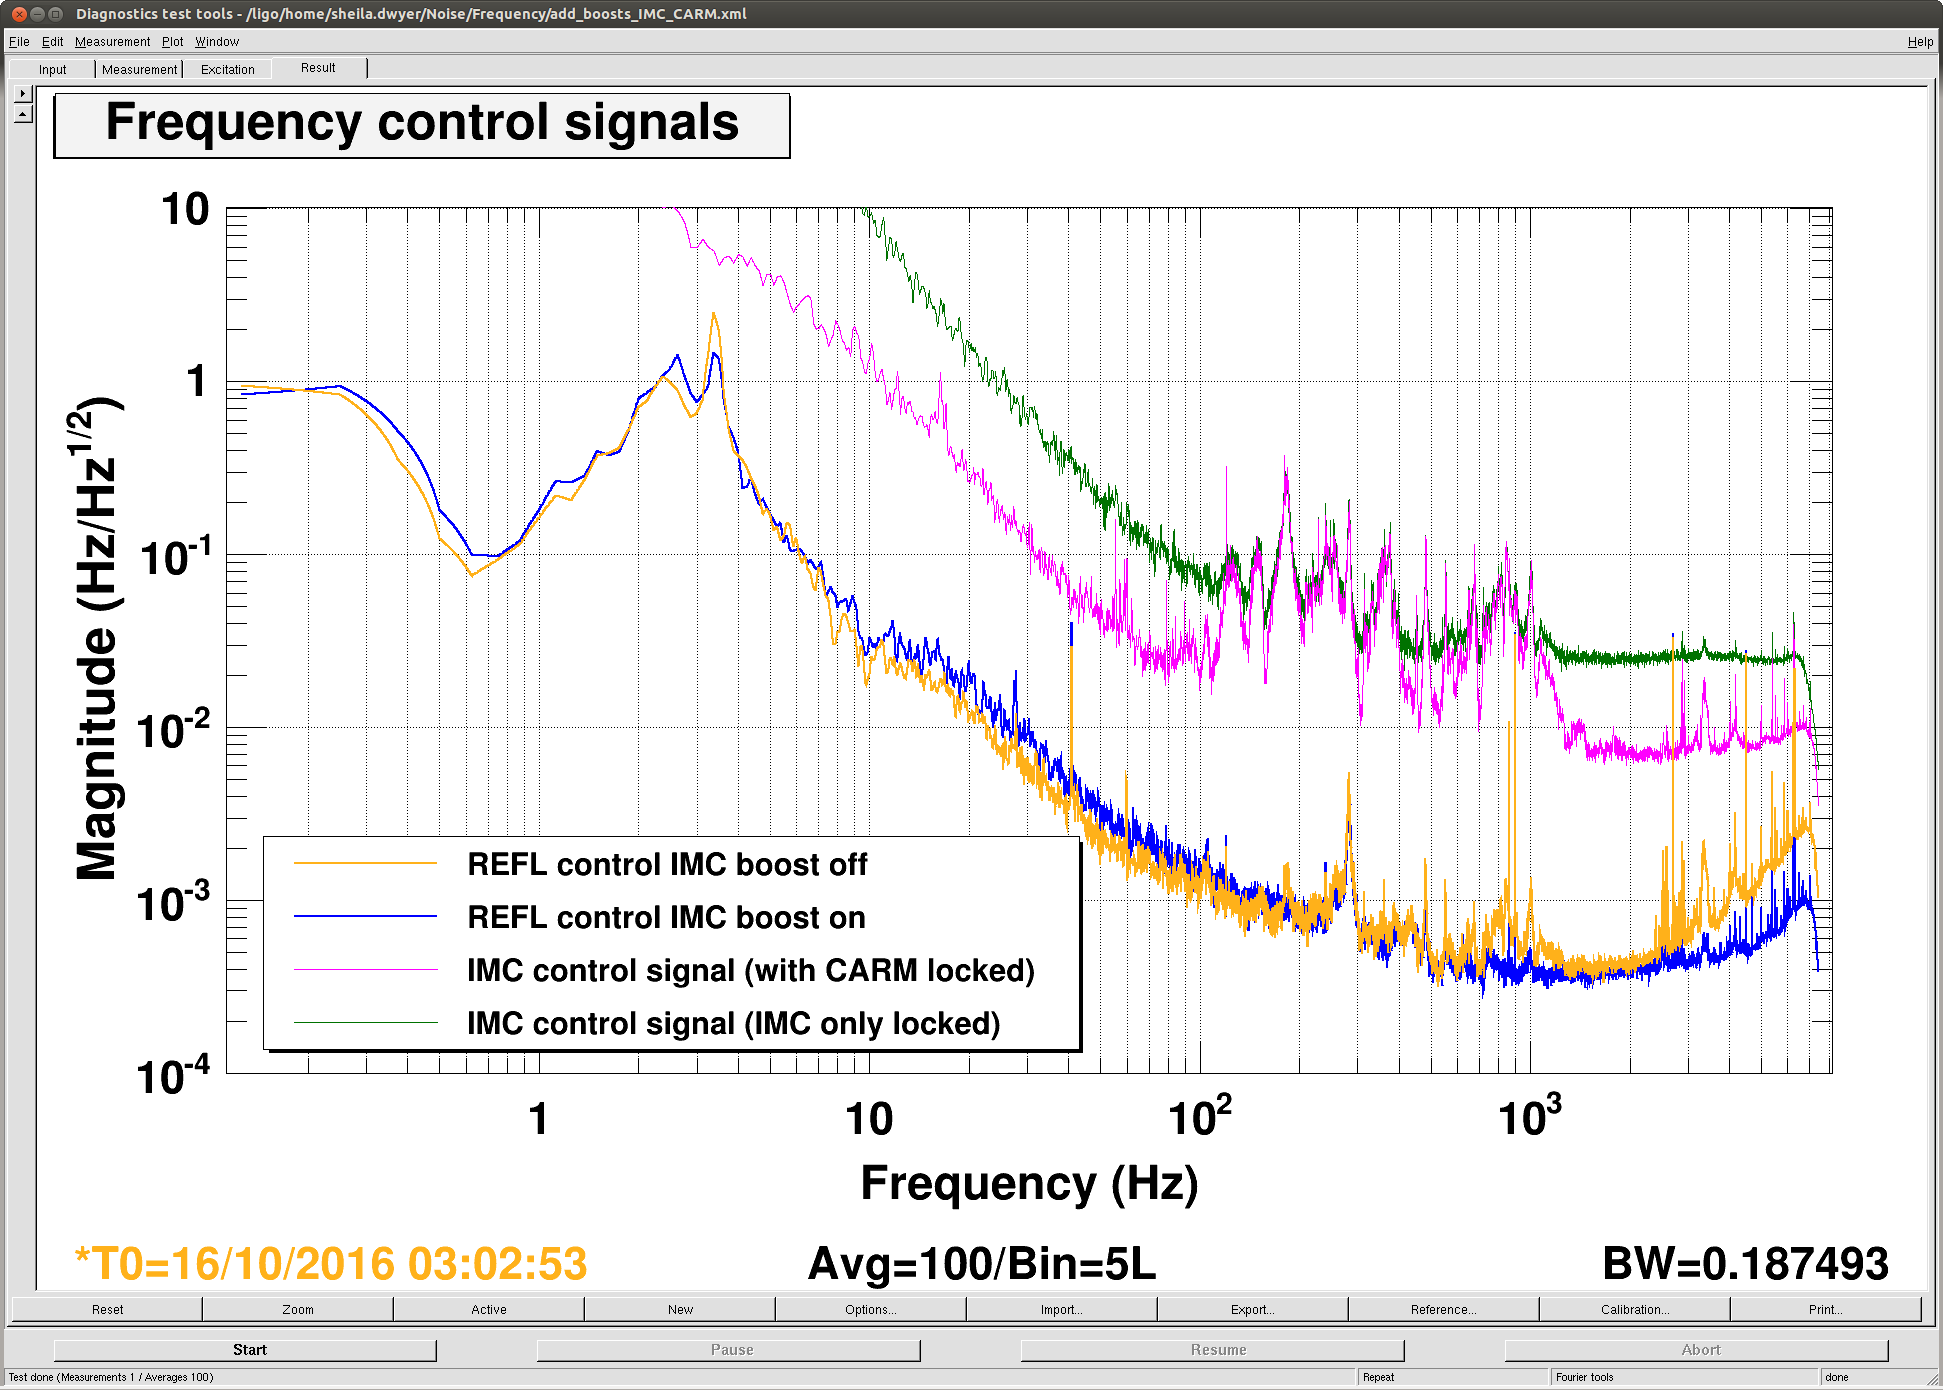
The refl control signal tells a different story:
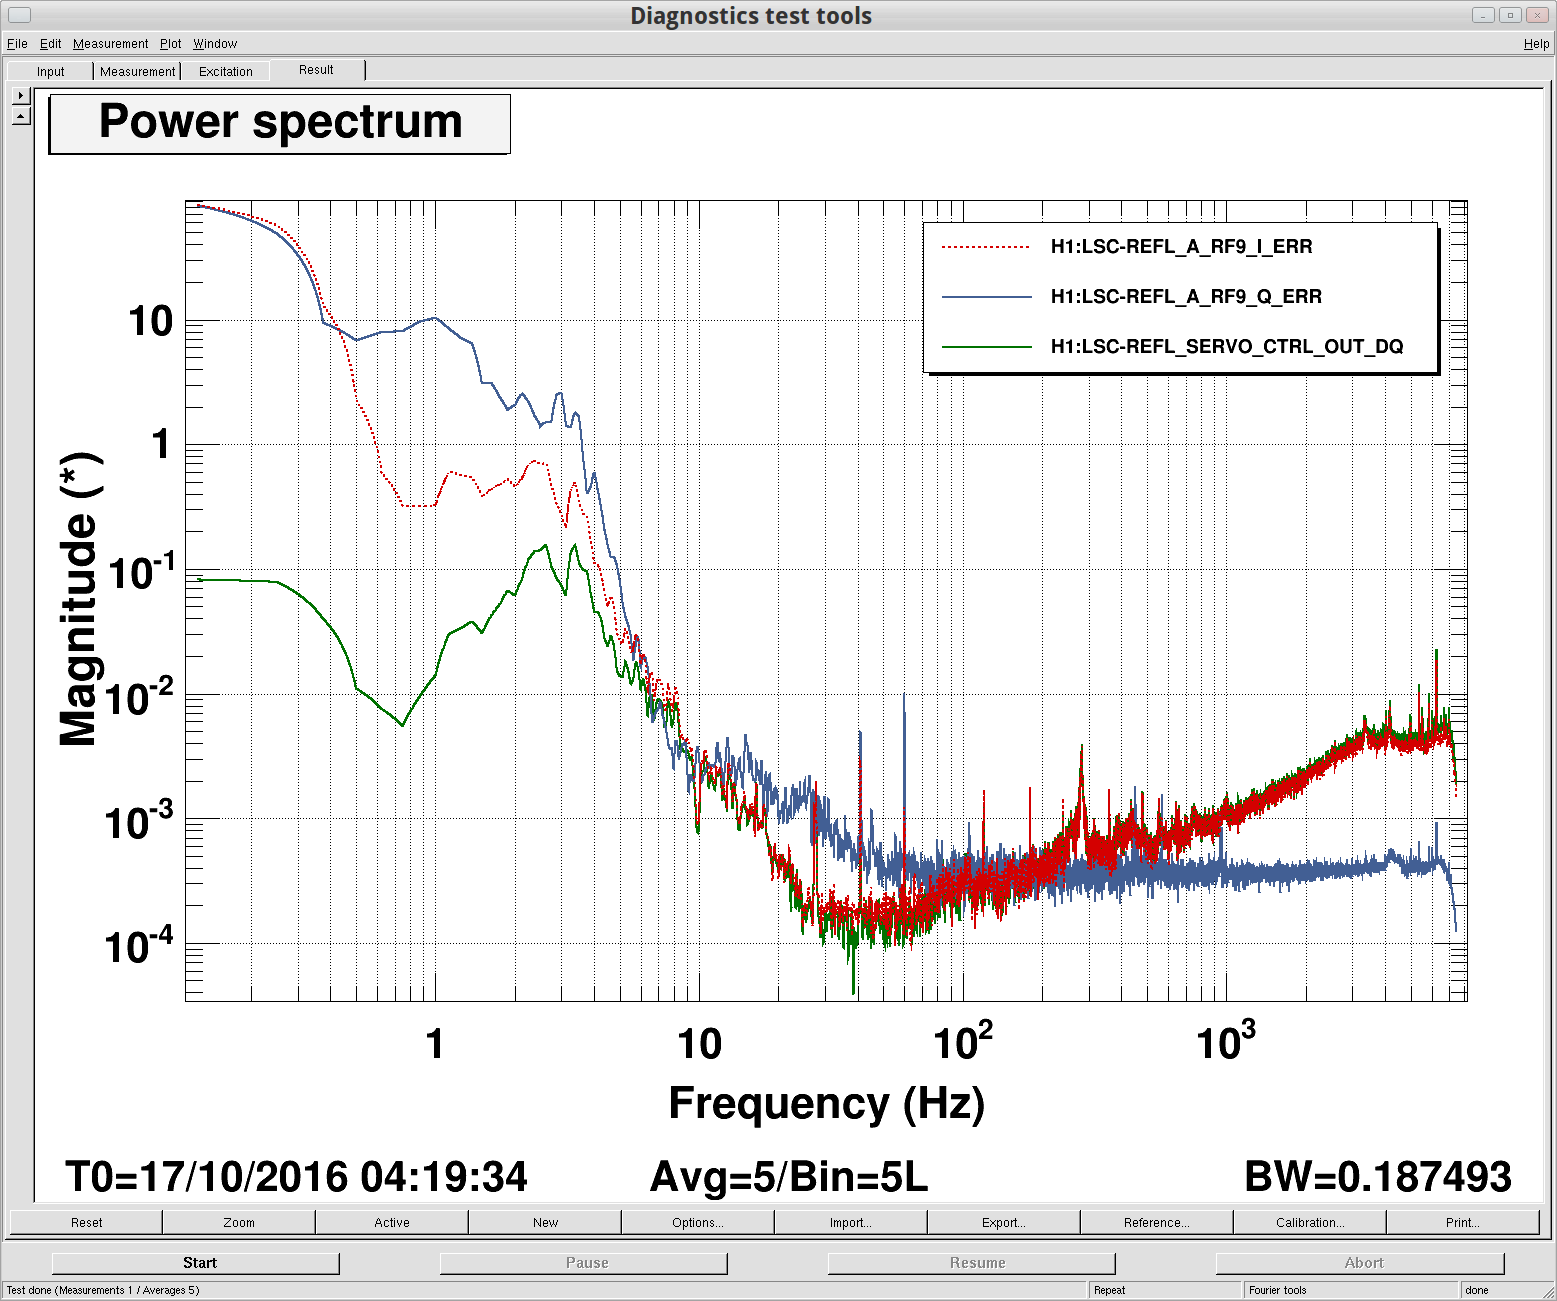
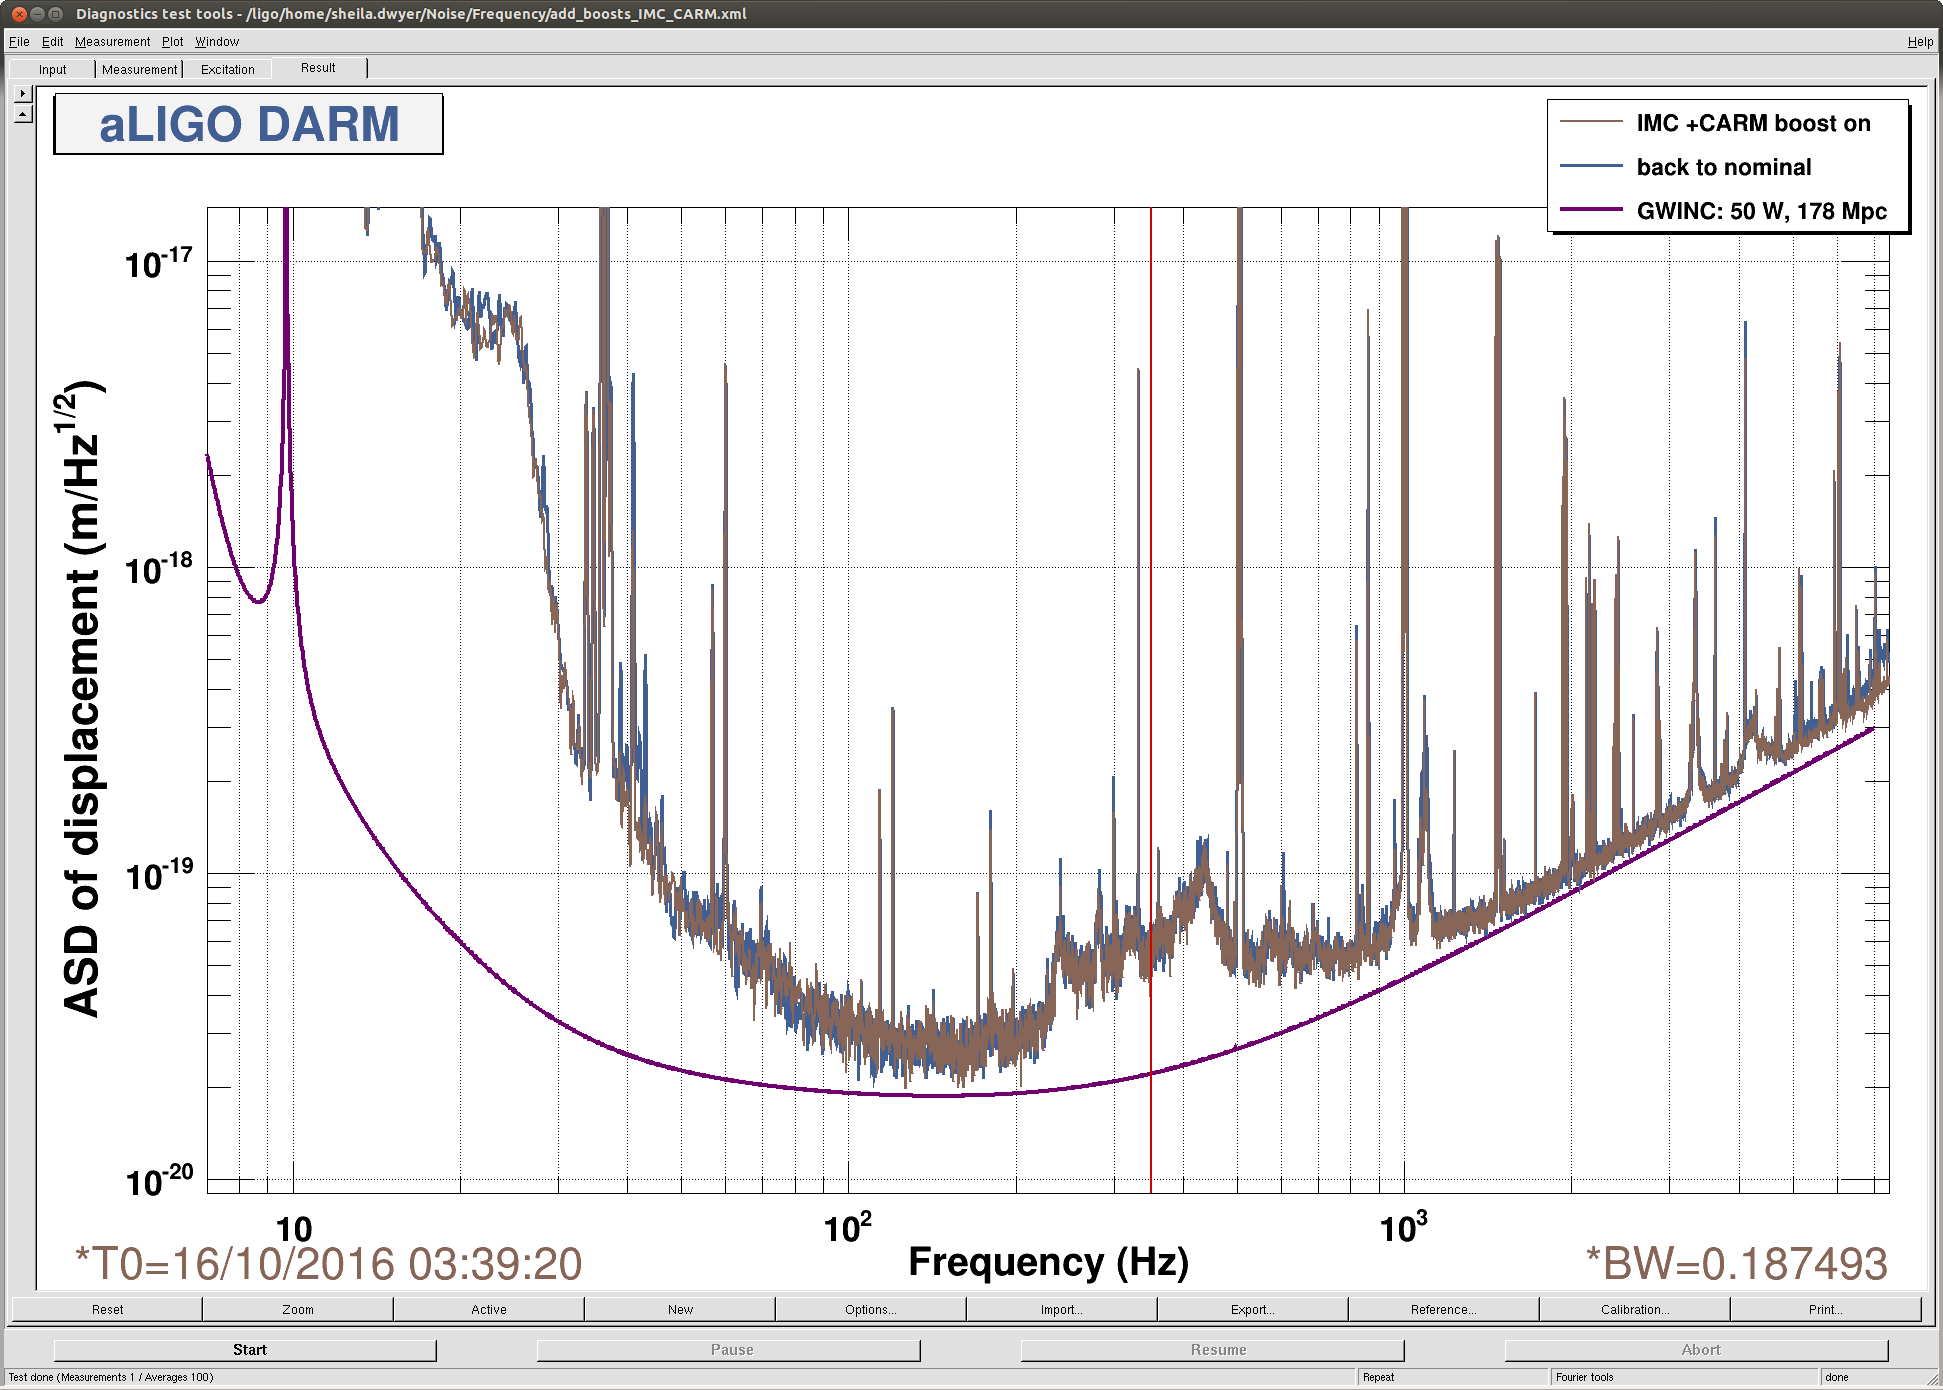
Tonight, Jenne and I tried engaging boosts in both the IMC and CARM. The third attached screenshot shows that the refl control signal was reduced when we added a boost to the IMC, both peaks at around 1 kHz and the higher frequency noise. This means that at these frequencies the frequency noise is not limited by sensing noise from REFL or the IMC, which contradicts the conclusion above. Not suprisingly, it looks like the peak at 280Hz is sensing noise from the IMC or REFL. In any case, we saw a small improvement in DARM at high frequencies by using the IMC boost, so we should probably make this a regular part of our locking sequence. Boosting the CARM loop (using the 40Hz/4kHz filter) didn't change anything in DARM.
Edit:
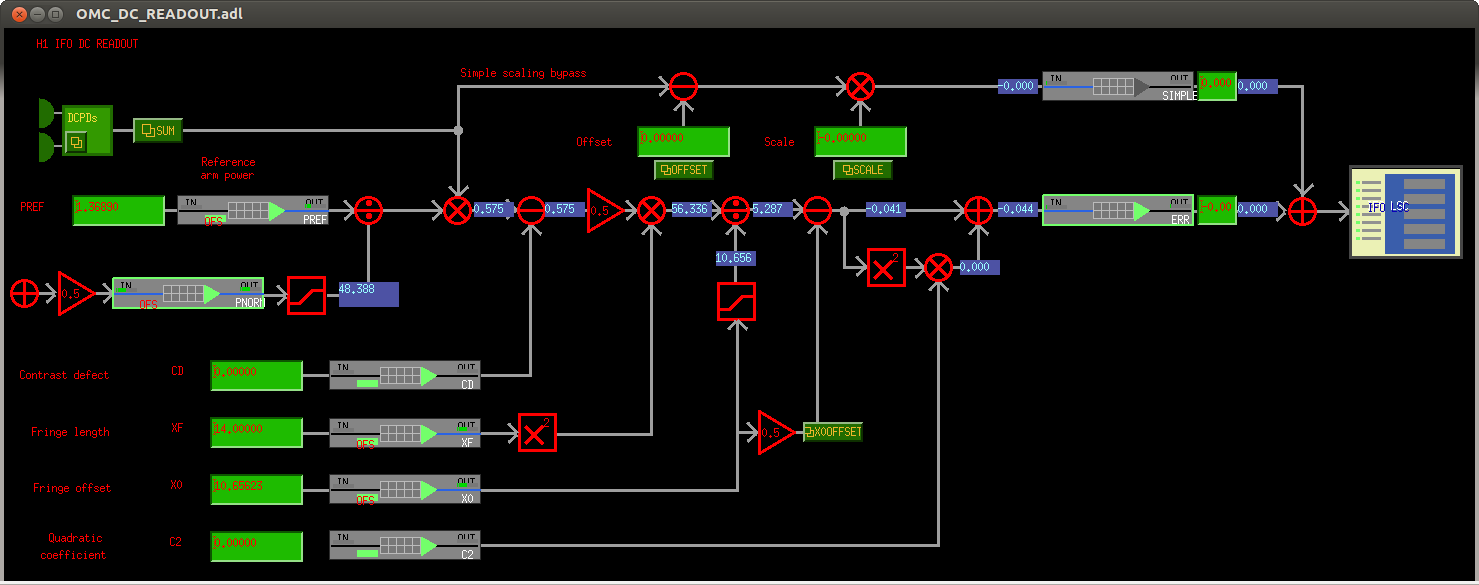
I've done a quick calibration of the REFL control signal by wathcing the IMC PDH signal at the point where the REFL AO path gets summed in. We have about 2.4Vpp there (at 2Watts, with 16 dB of gain), using the IMC cavity pole of 8812Hz, Alexa's quick PDH calibration in 7054, -24 dB AO path gain, and 0.00061Volts/count, REFL control has about 0.1413 Hz/count. I've added this to the front end filter for REFL control. Now we can plot the IMC and refl control signals together. At 1kHz, we expect a supression of about 200 without the IMC boost on, so the noise at 1kHz makes sense as laser frequency noise or ref cav sensing noise.


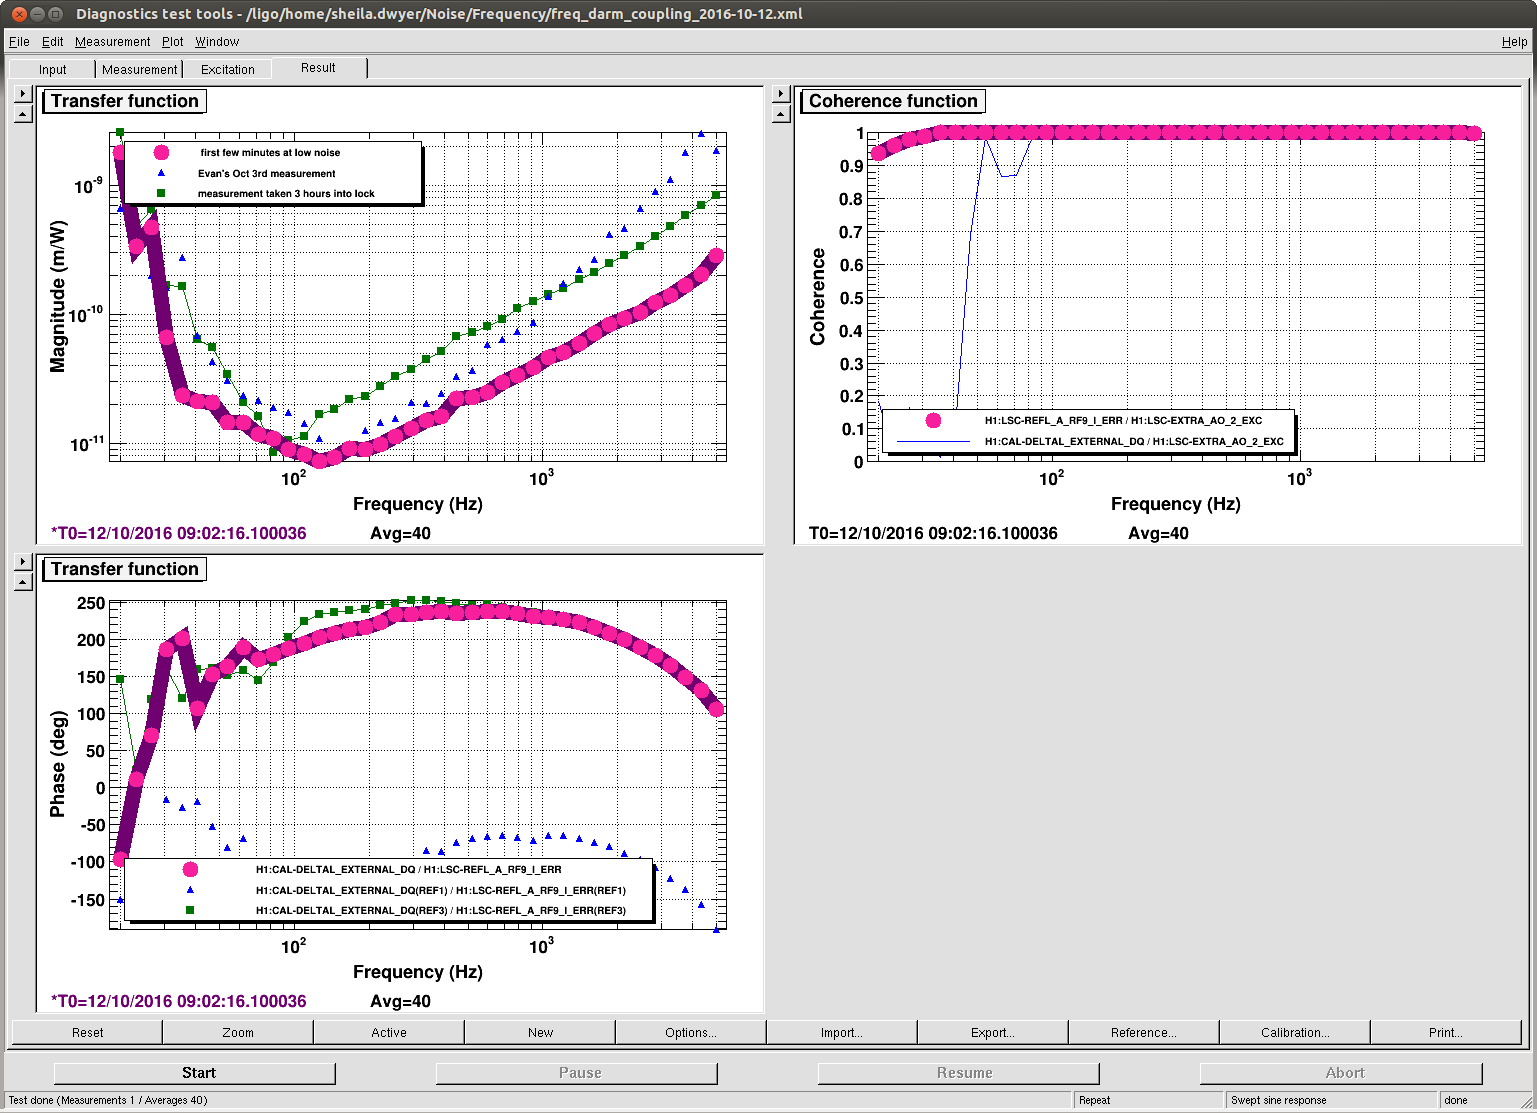
Some additional comments:
This calculation estimates the jitter noise at the input to the ifo by forward propagating the measured jitter into the IMC. It then assumes a jitter coupling in reflection that mixes the carrier jitter with a RF sideband TEM10 mode due to misalignment. The corresponding RF signal would be an error point offset in the frequency suppression servo, so it would be added to the frequency noise. Finally, we are using the frequency noise to OMC DCPD coupling function to estimate how much would show up in DARM.
If this is the main jitter coupling path, it will show up in POP9I as long as it is above the shot noise. Indeed, alog 30610 shows the POP9I inferred frequency noise (out-of-loop) more than an order of magnitude above the one inferred from REFL9I (in-loop) at 100Hz. It isn't large enough to explain the noise visible in DARM. However, it is not far below the expected level for 50W shot noise.