Joseph B, Darkhan,
Overview
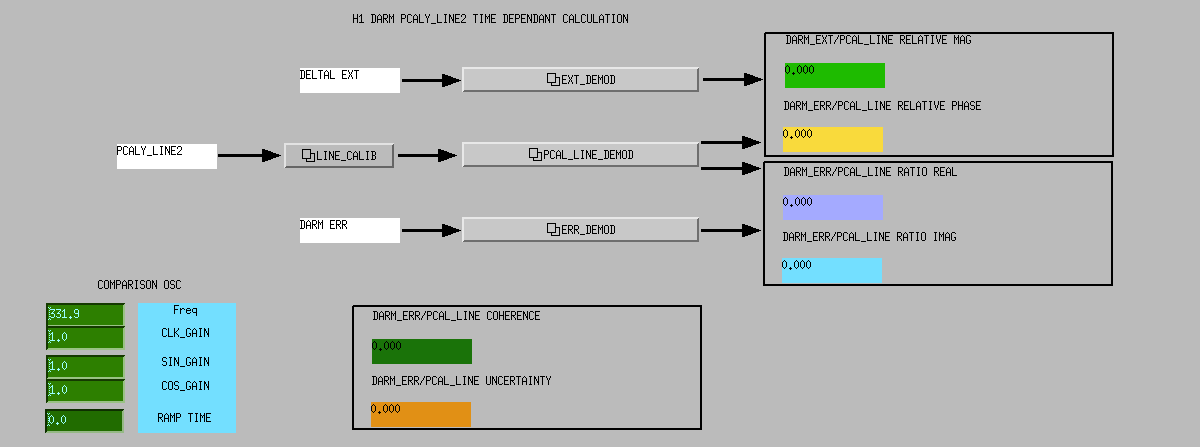
Updated settings of CAL-CS oscillators and filters that are used for calculating calibration line coherences. These coherences will be used to inform the validity of the DARM time-dependent parameters calculated in the front-end.
At the moment the coherence outputs are 0, once we accumulate data at "low-noise" we should see cal. line coherence and uncertainty values.
The changes have been "accepted" in safe.snap and observe.snap
Details
The most recent version of CAL-CS update (see LHO alog 27733, LLO alog 26491) enabled calibration line coherences and uncertainties calculations in the front-end. These calculations require demodulation of excitation and DARM_ERR channels at line frequencies, band-pass and low-pass filters (see DCC T1600349).
Following Python script is used to set synchronized oscillators (in the "line coherence" blocks of CAL-CS) and the filters:
/userapps/trunk/cal/common/scripts/set_coherence_h1.py
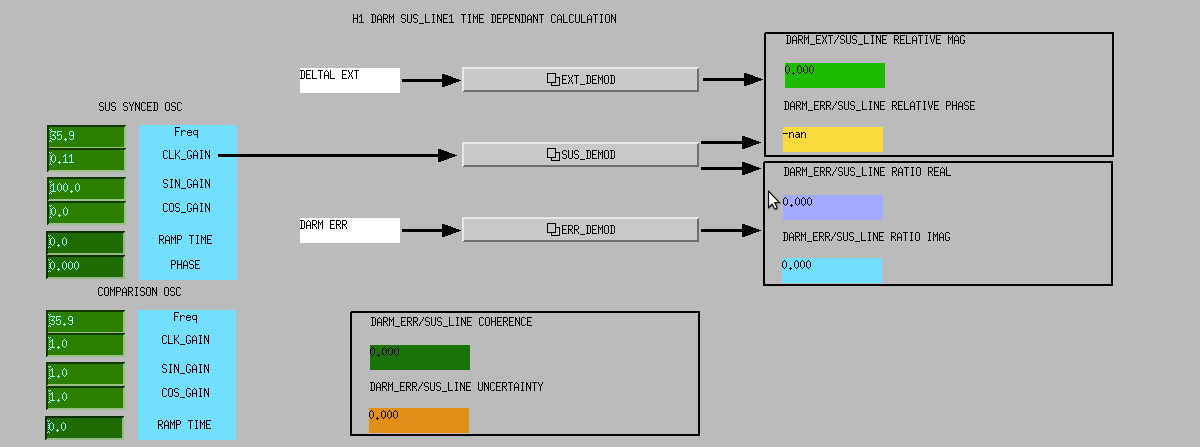
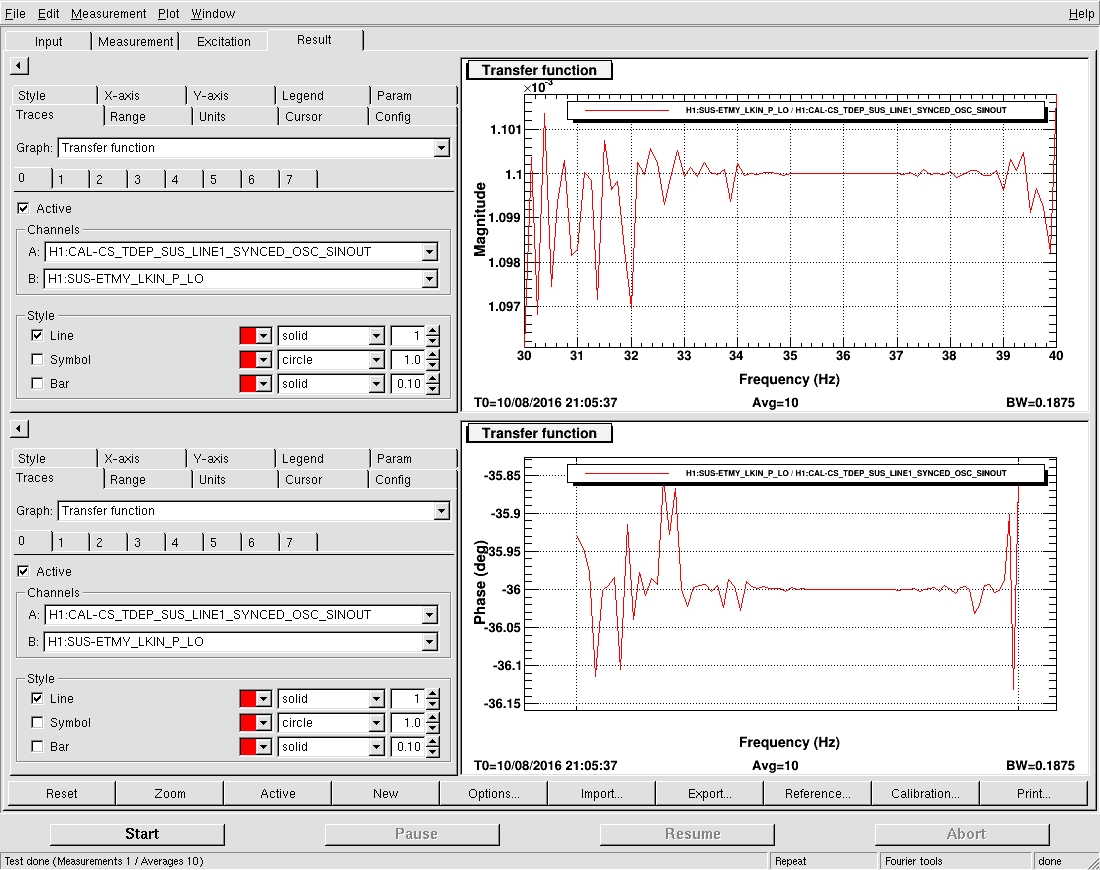
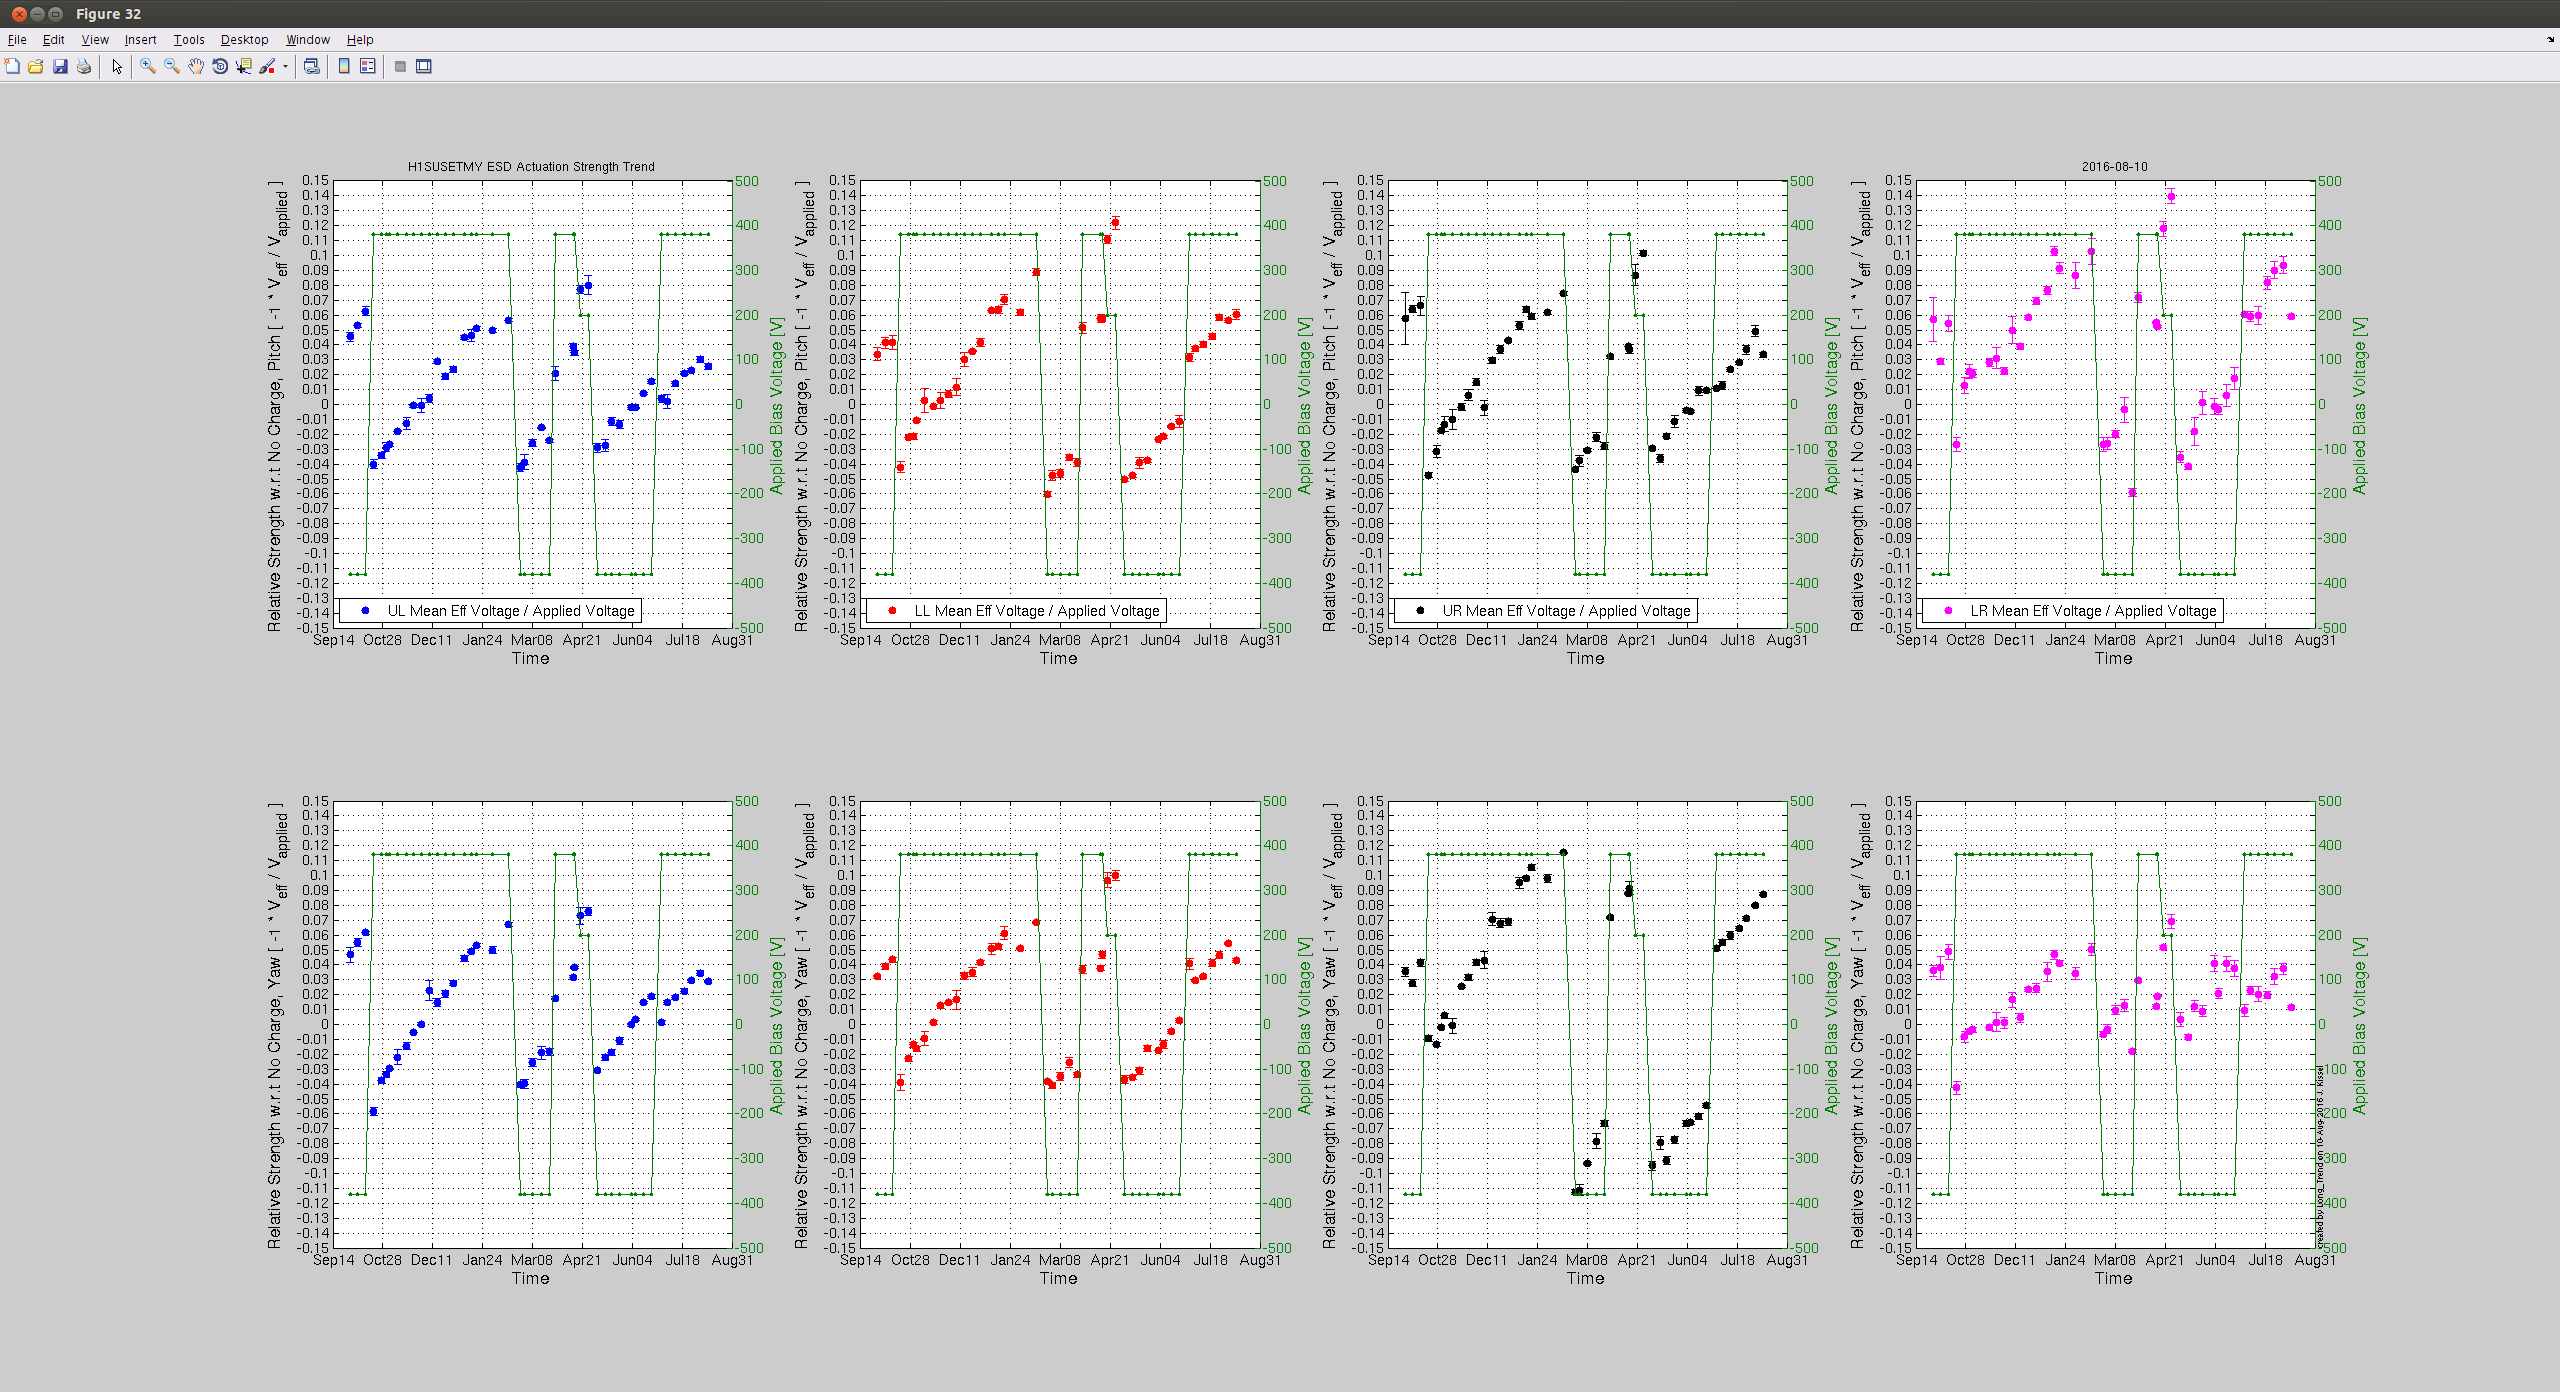
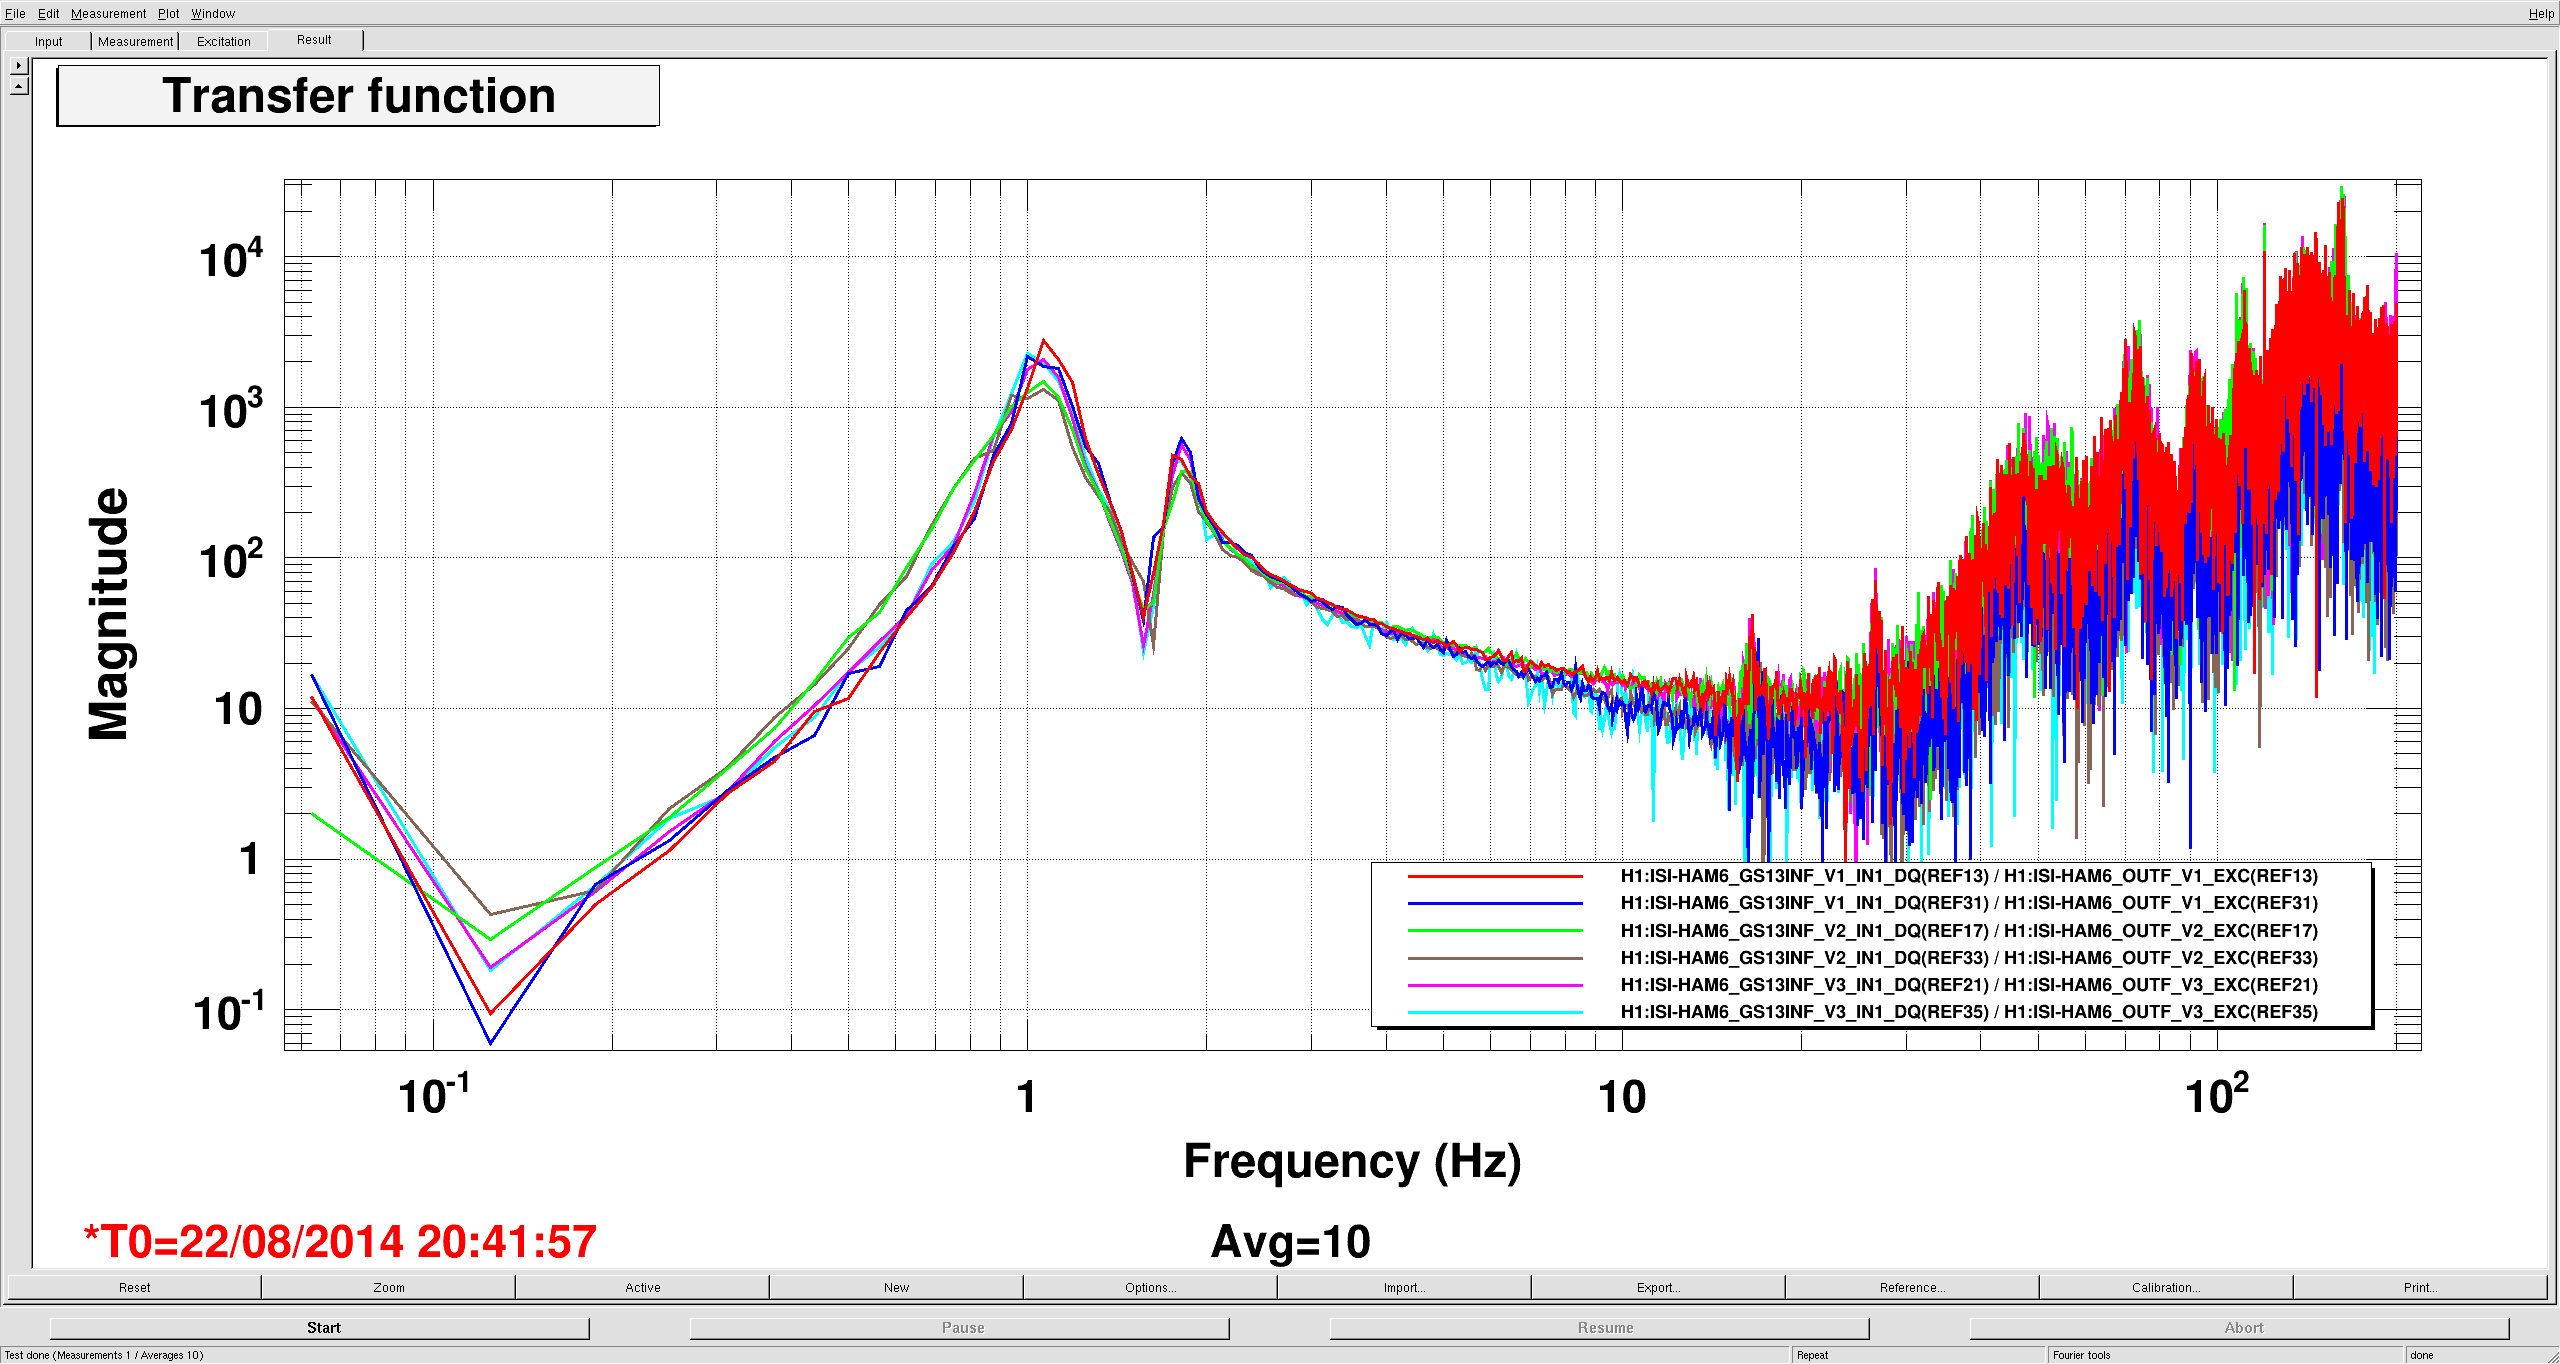
An oscillator (for coherence calculation) that replicates an ESD line oscillator in SUSETMY model was set manually (see Attachment 1). Ideally this oscillator should give an equivalent output to the ESD line oscillator (currently SUS-ETMY_LKIN_P_OSC), but their amplitude ratio is ~10% different at the moment (see Attachment 2). Needs investigation.
Note that a possible source of an issue is that ETMY_LKIN_P_OSC is not a synchronized one. This might mean that every time this oscillator restarts the phase of the demod. osc. in CAL-CS should be adjusted for a meaningful κT calculation.
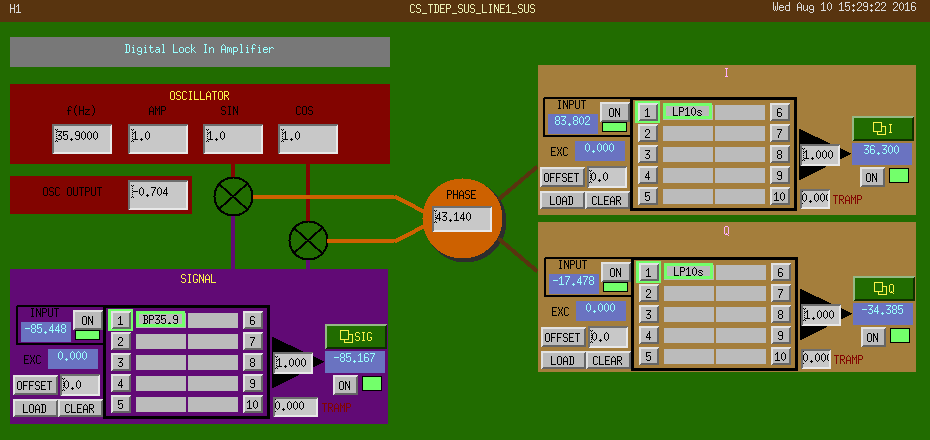
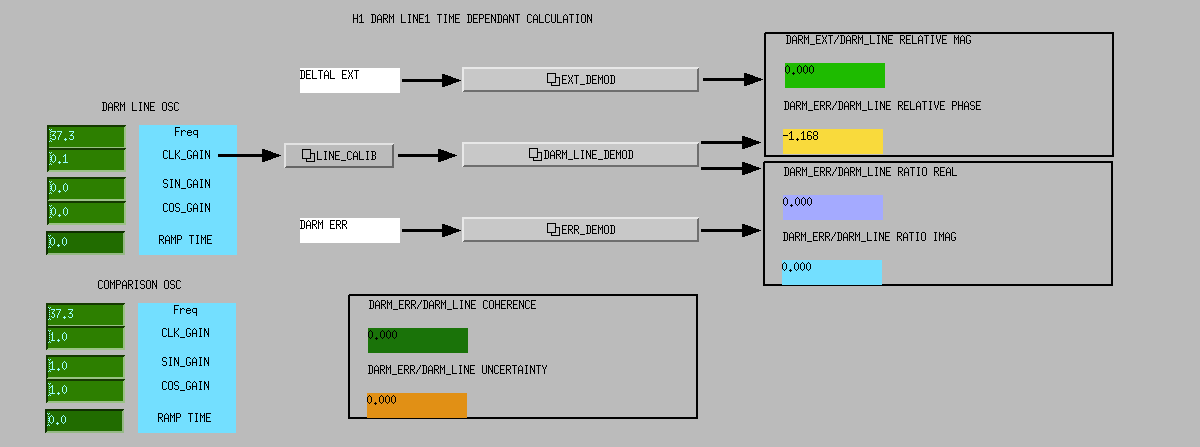
A screenshot of ESD line coh. demodulator and filters setup (as an example) is given in Attachments 3. Attachments 4-7 show CAL_CS_TDEP_*_LINE# MEDM screens.