[Betsy, Corey, Chris, Koji]
Summary
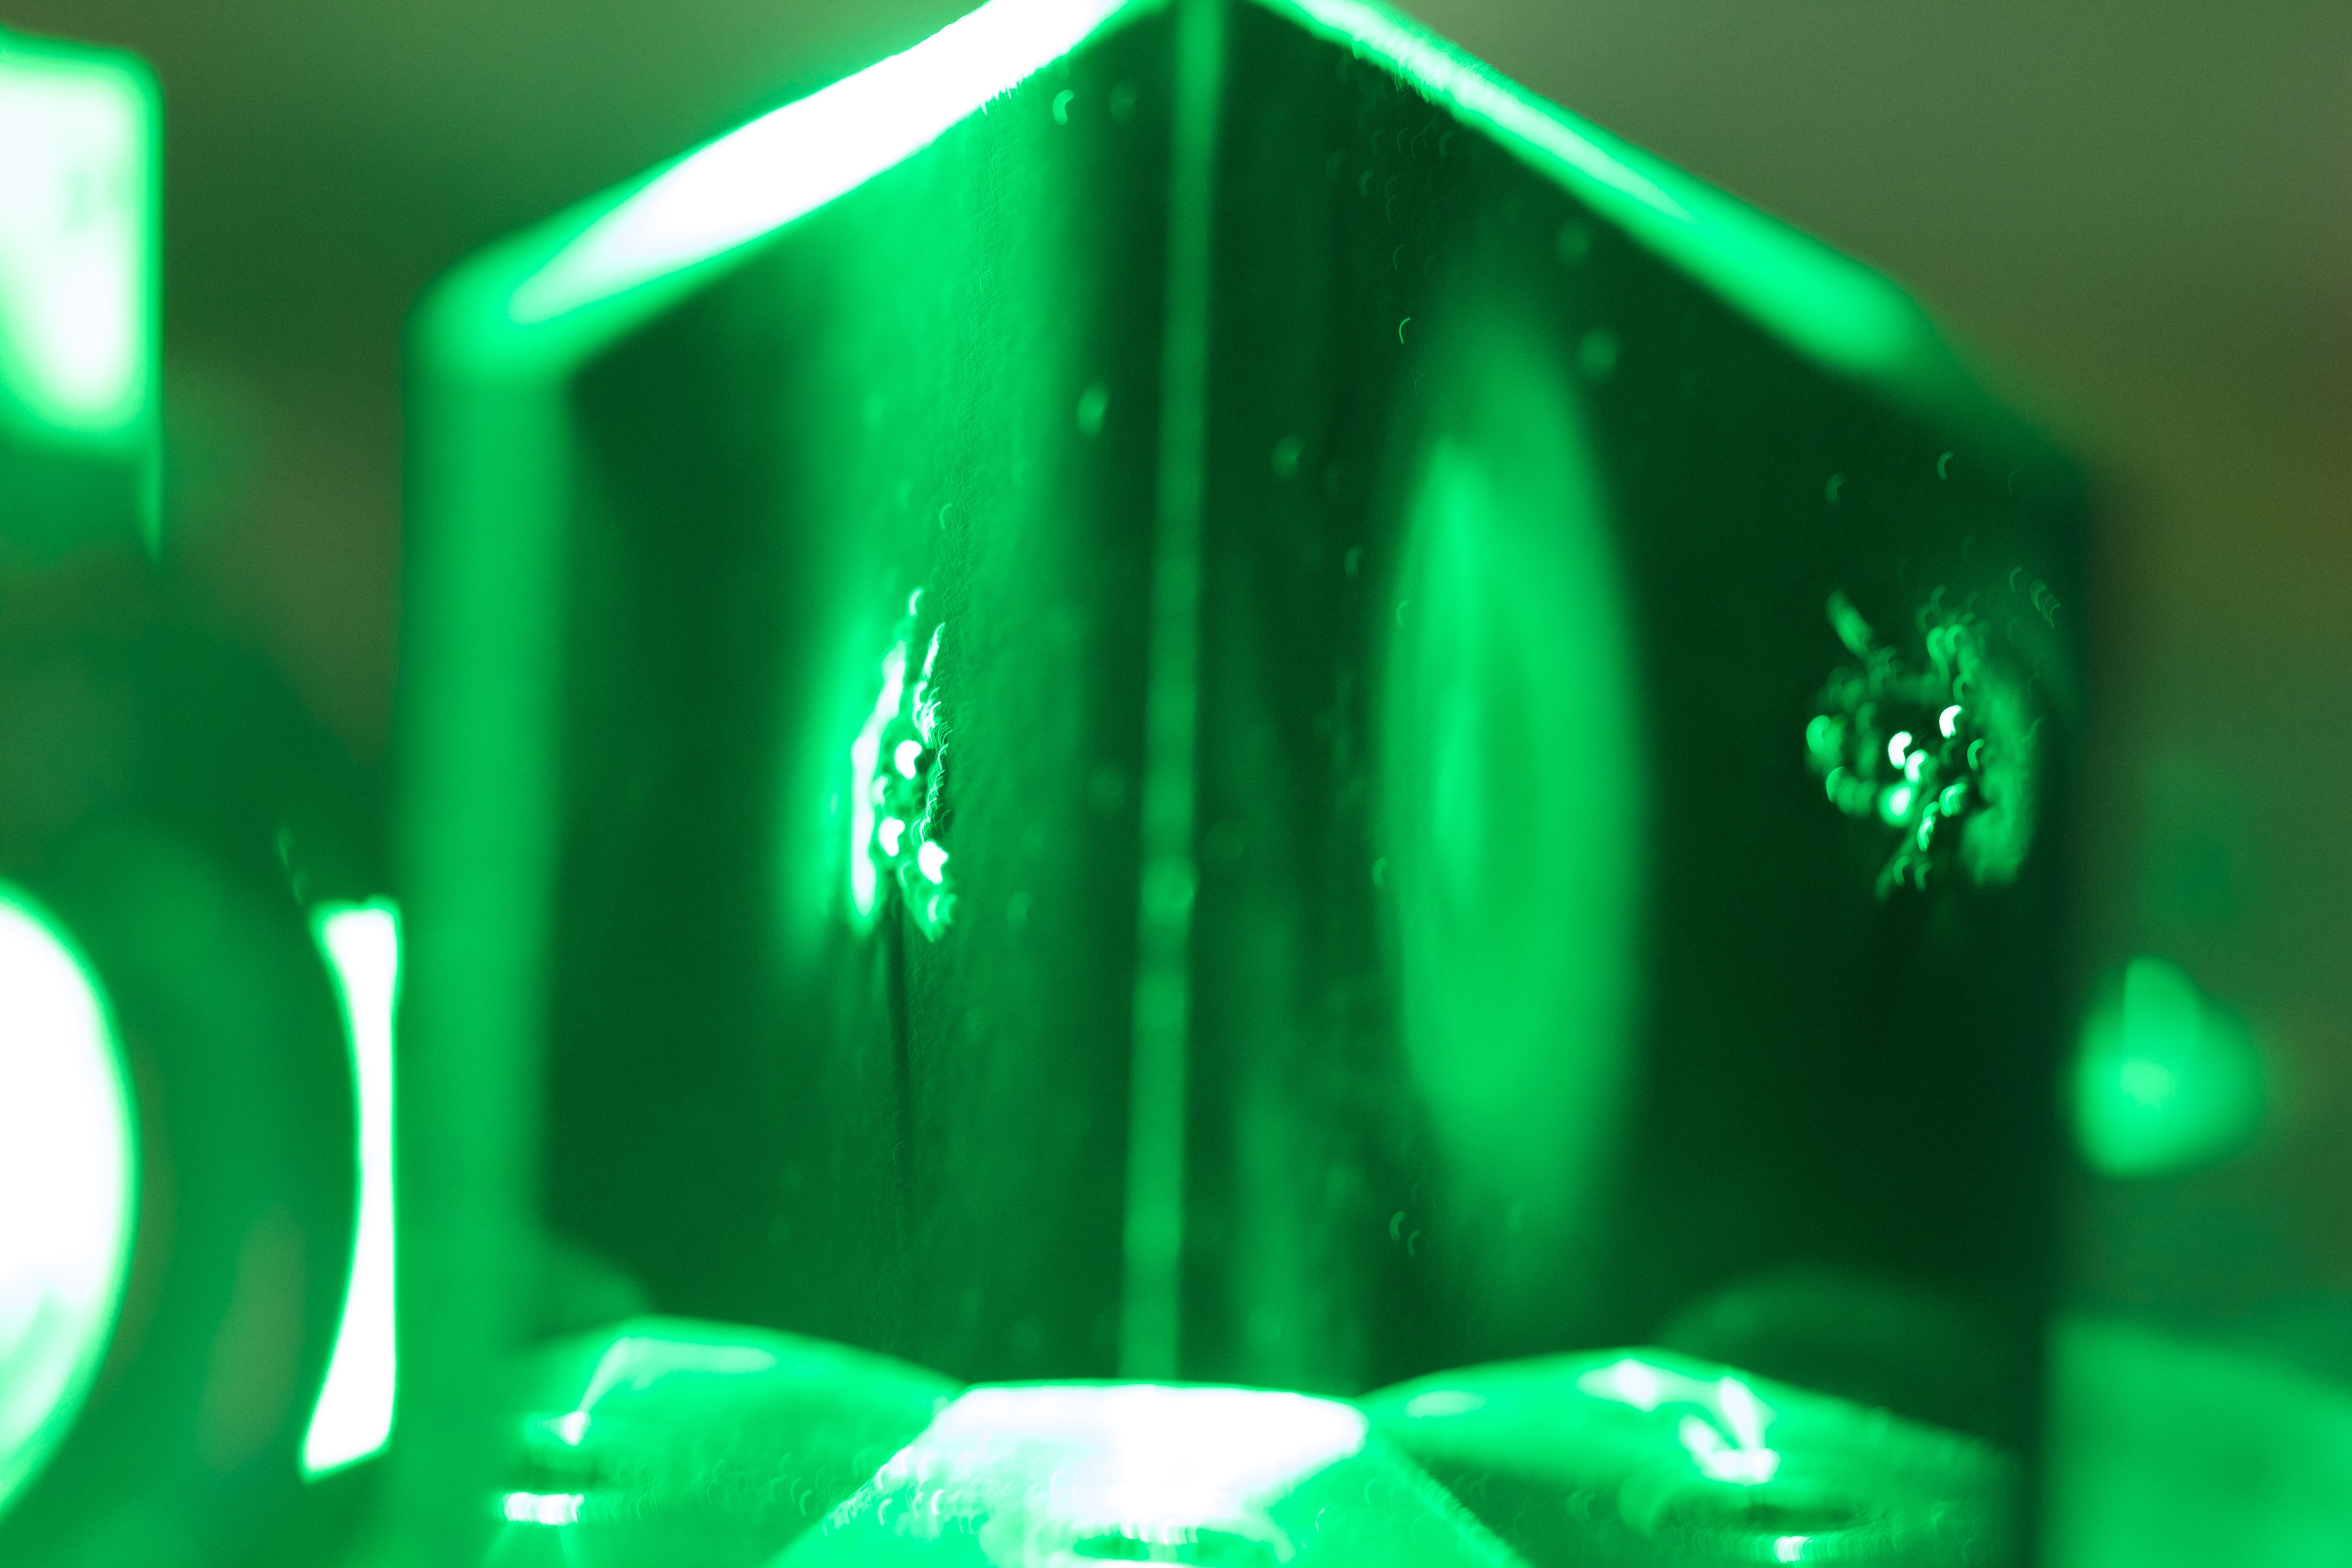
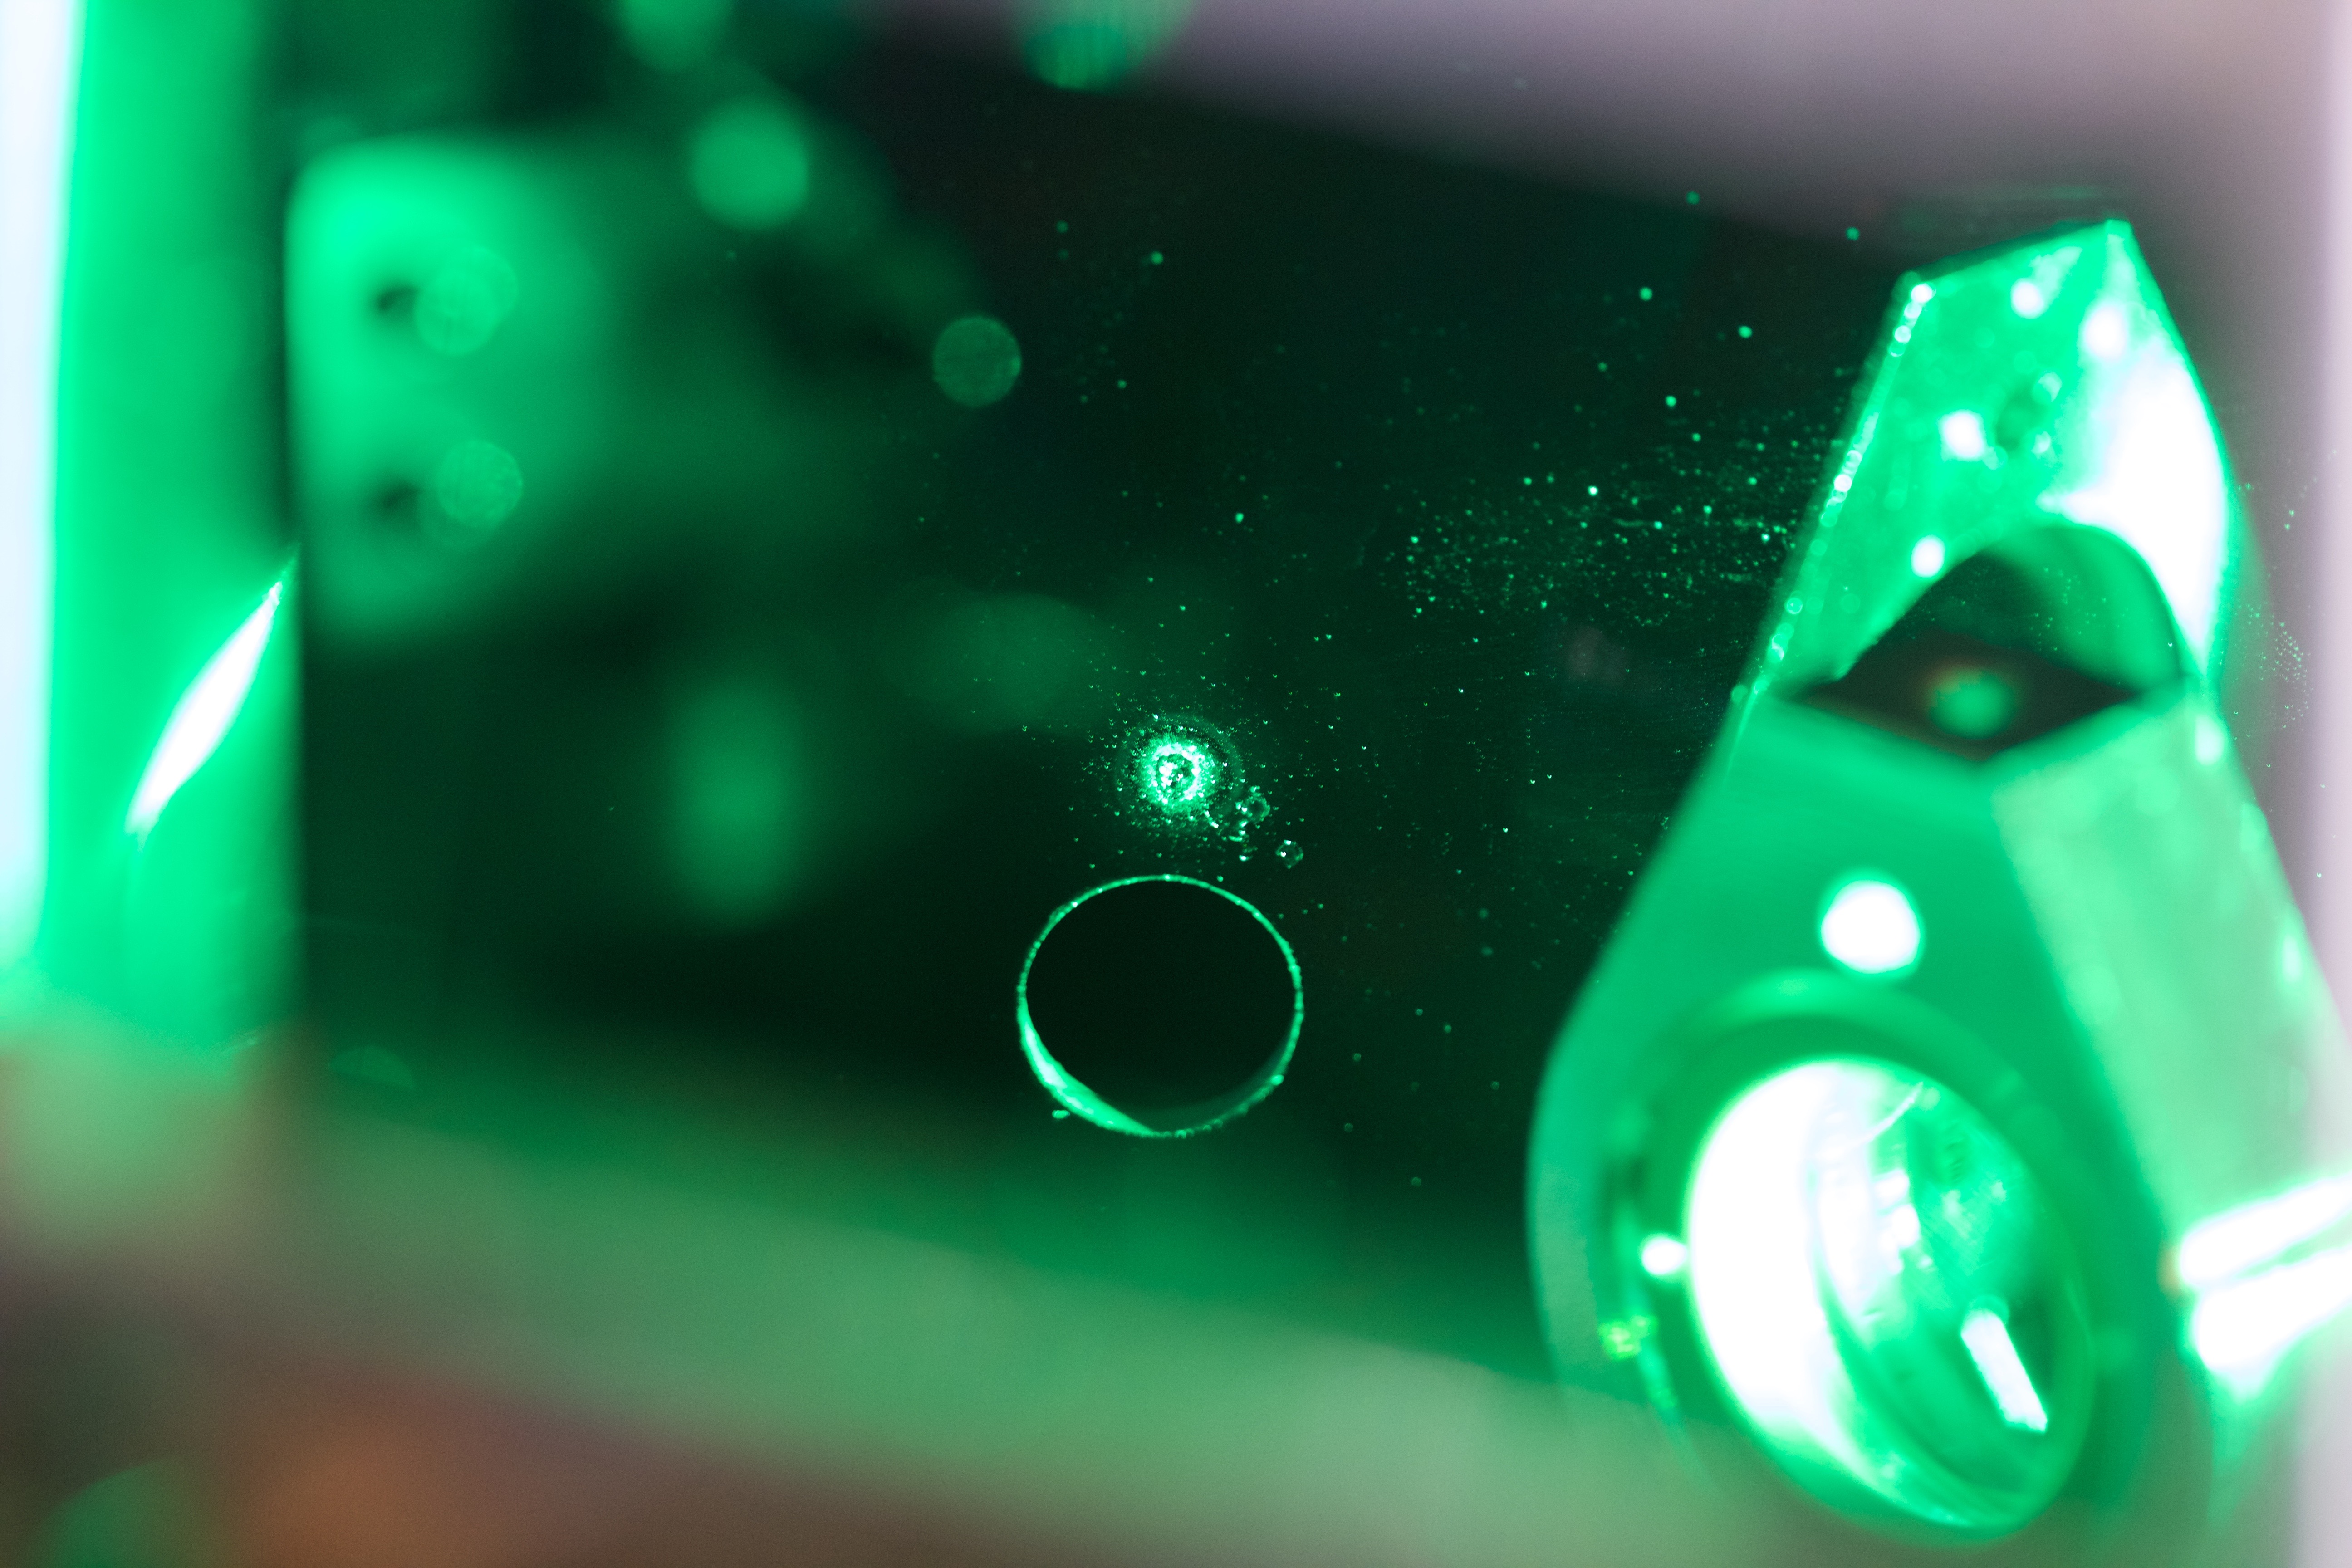
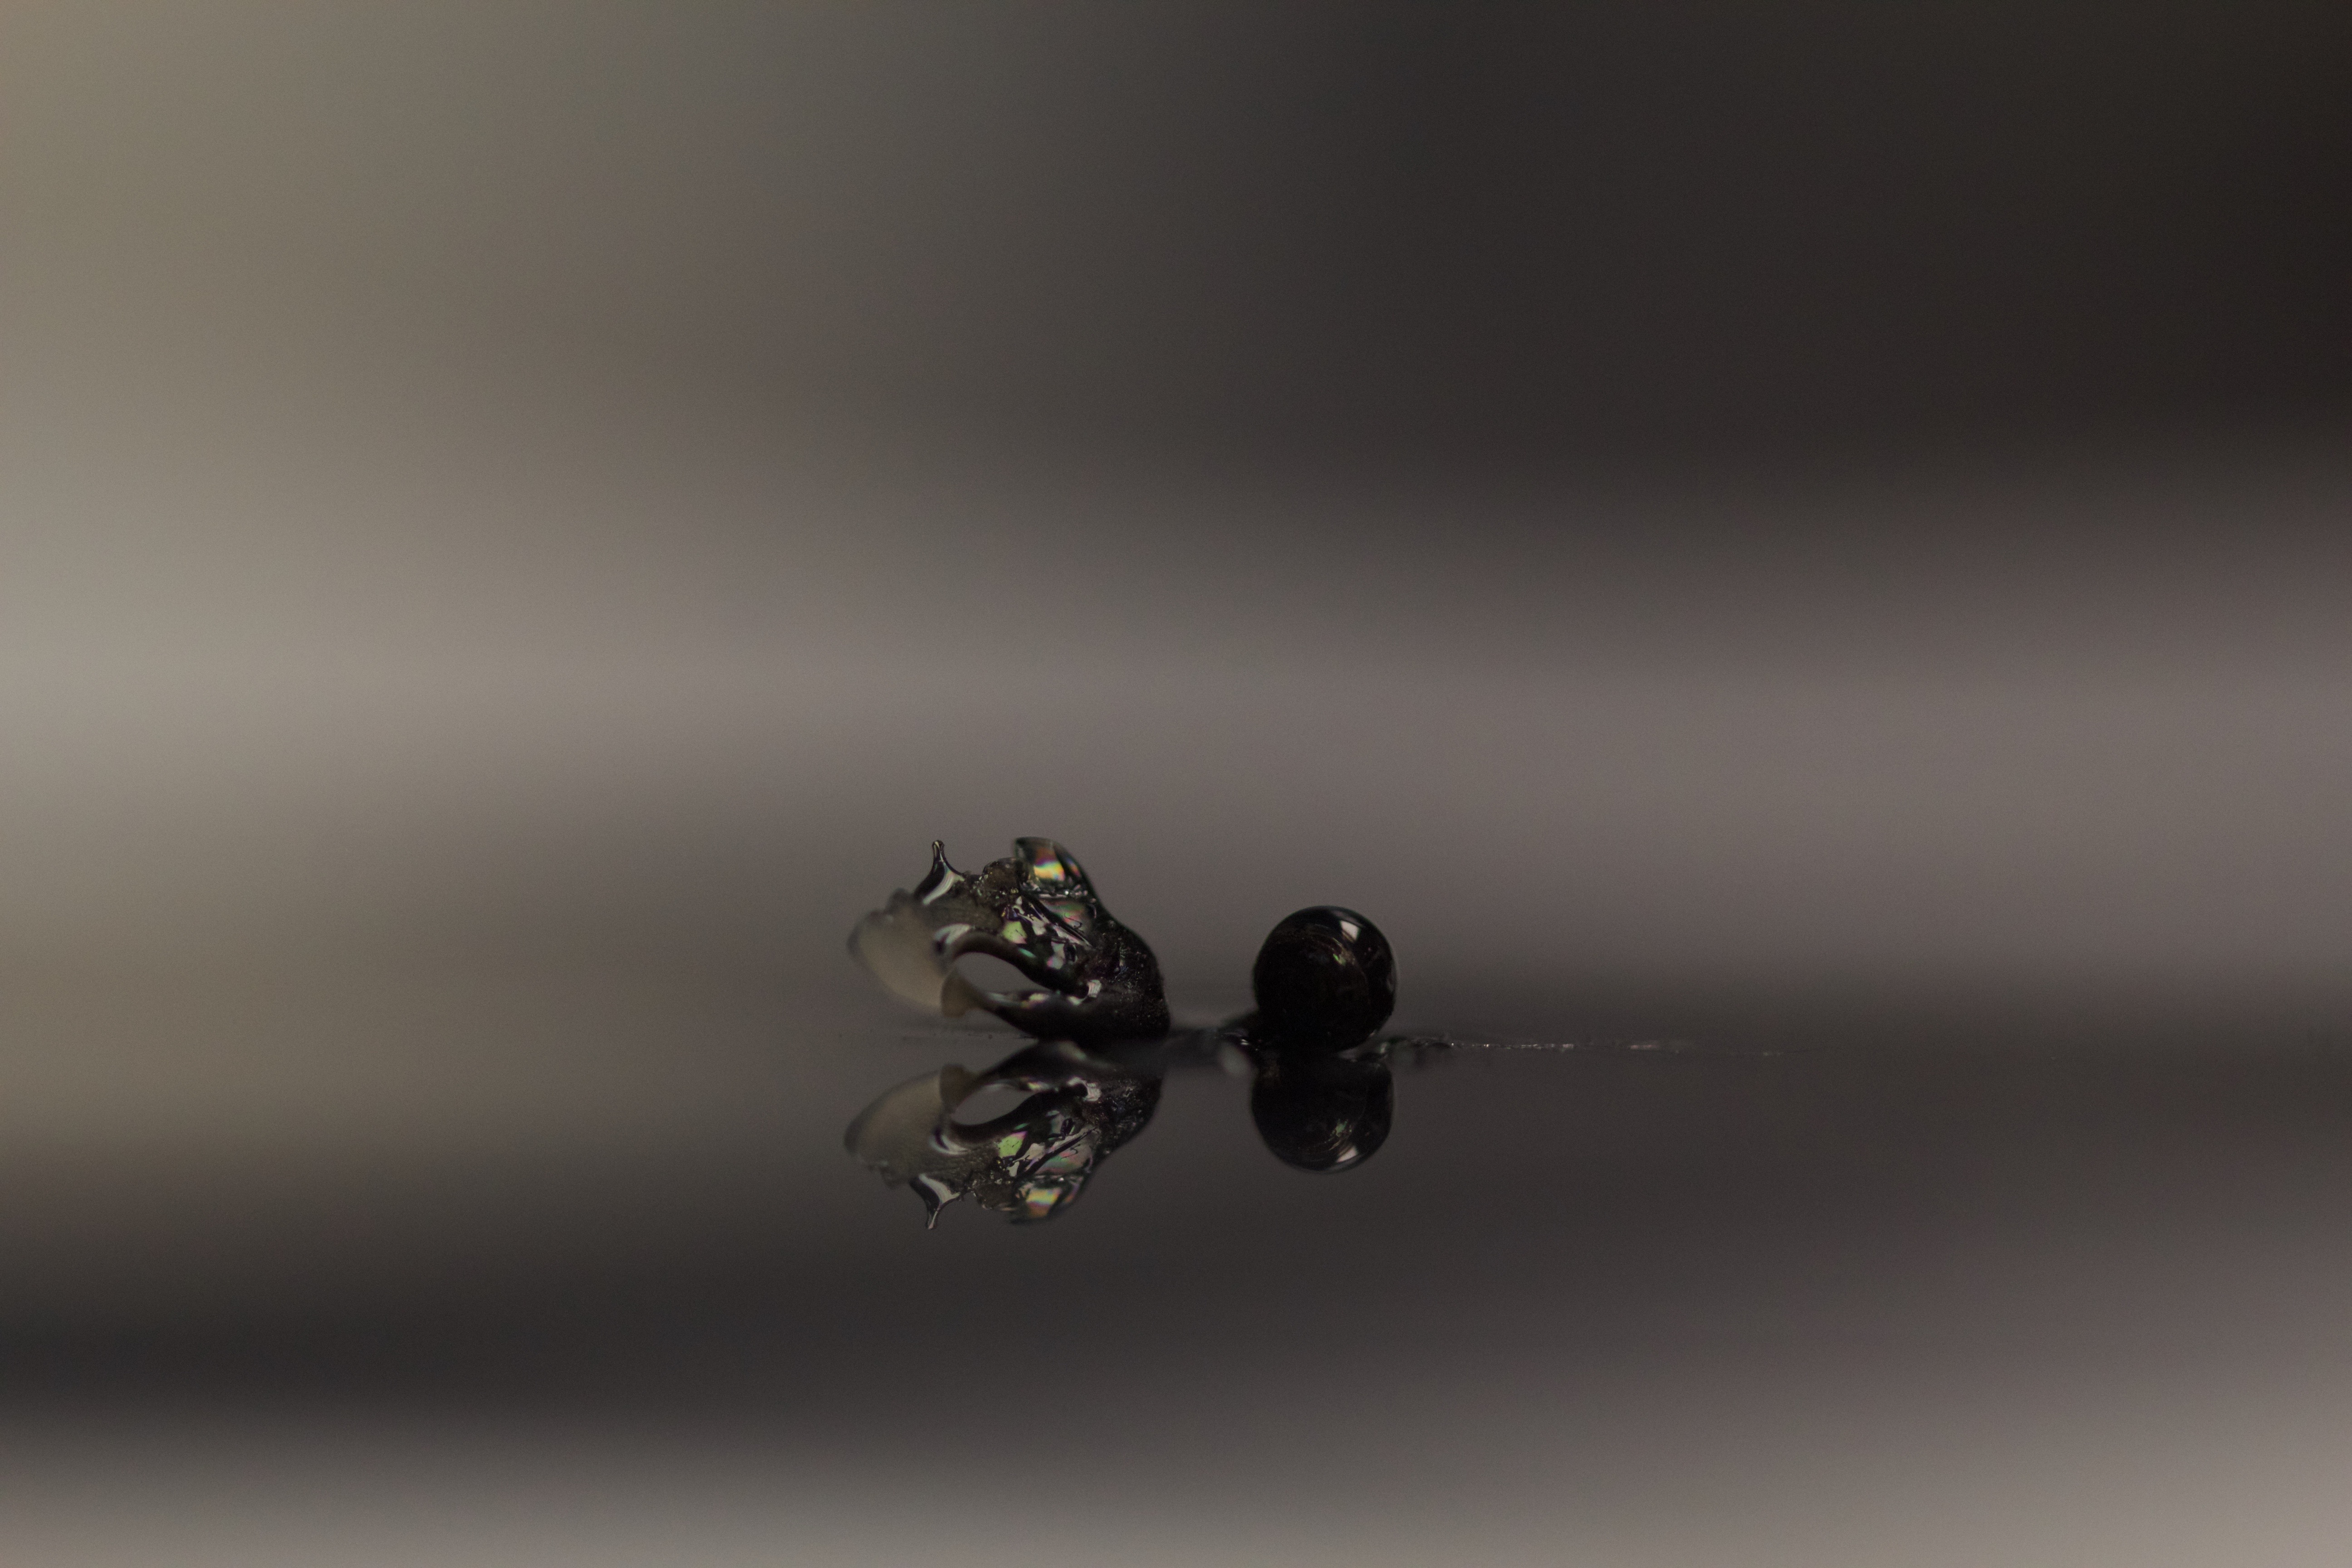
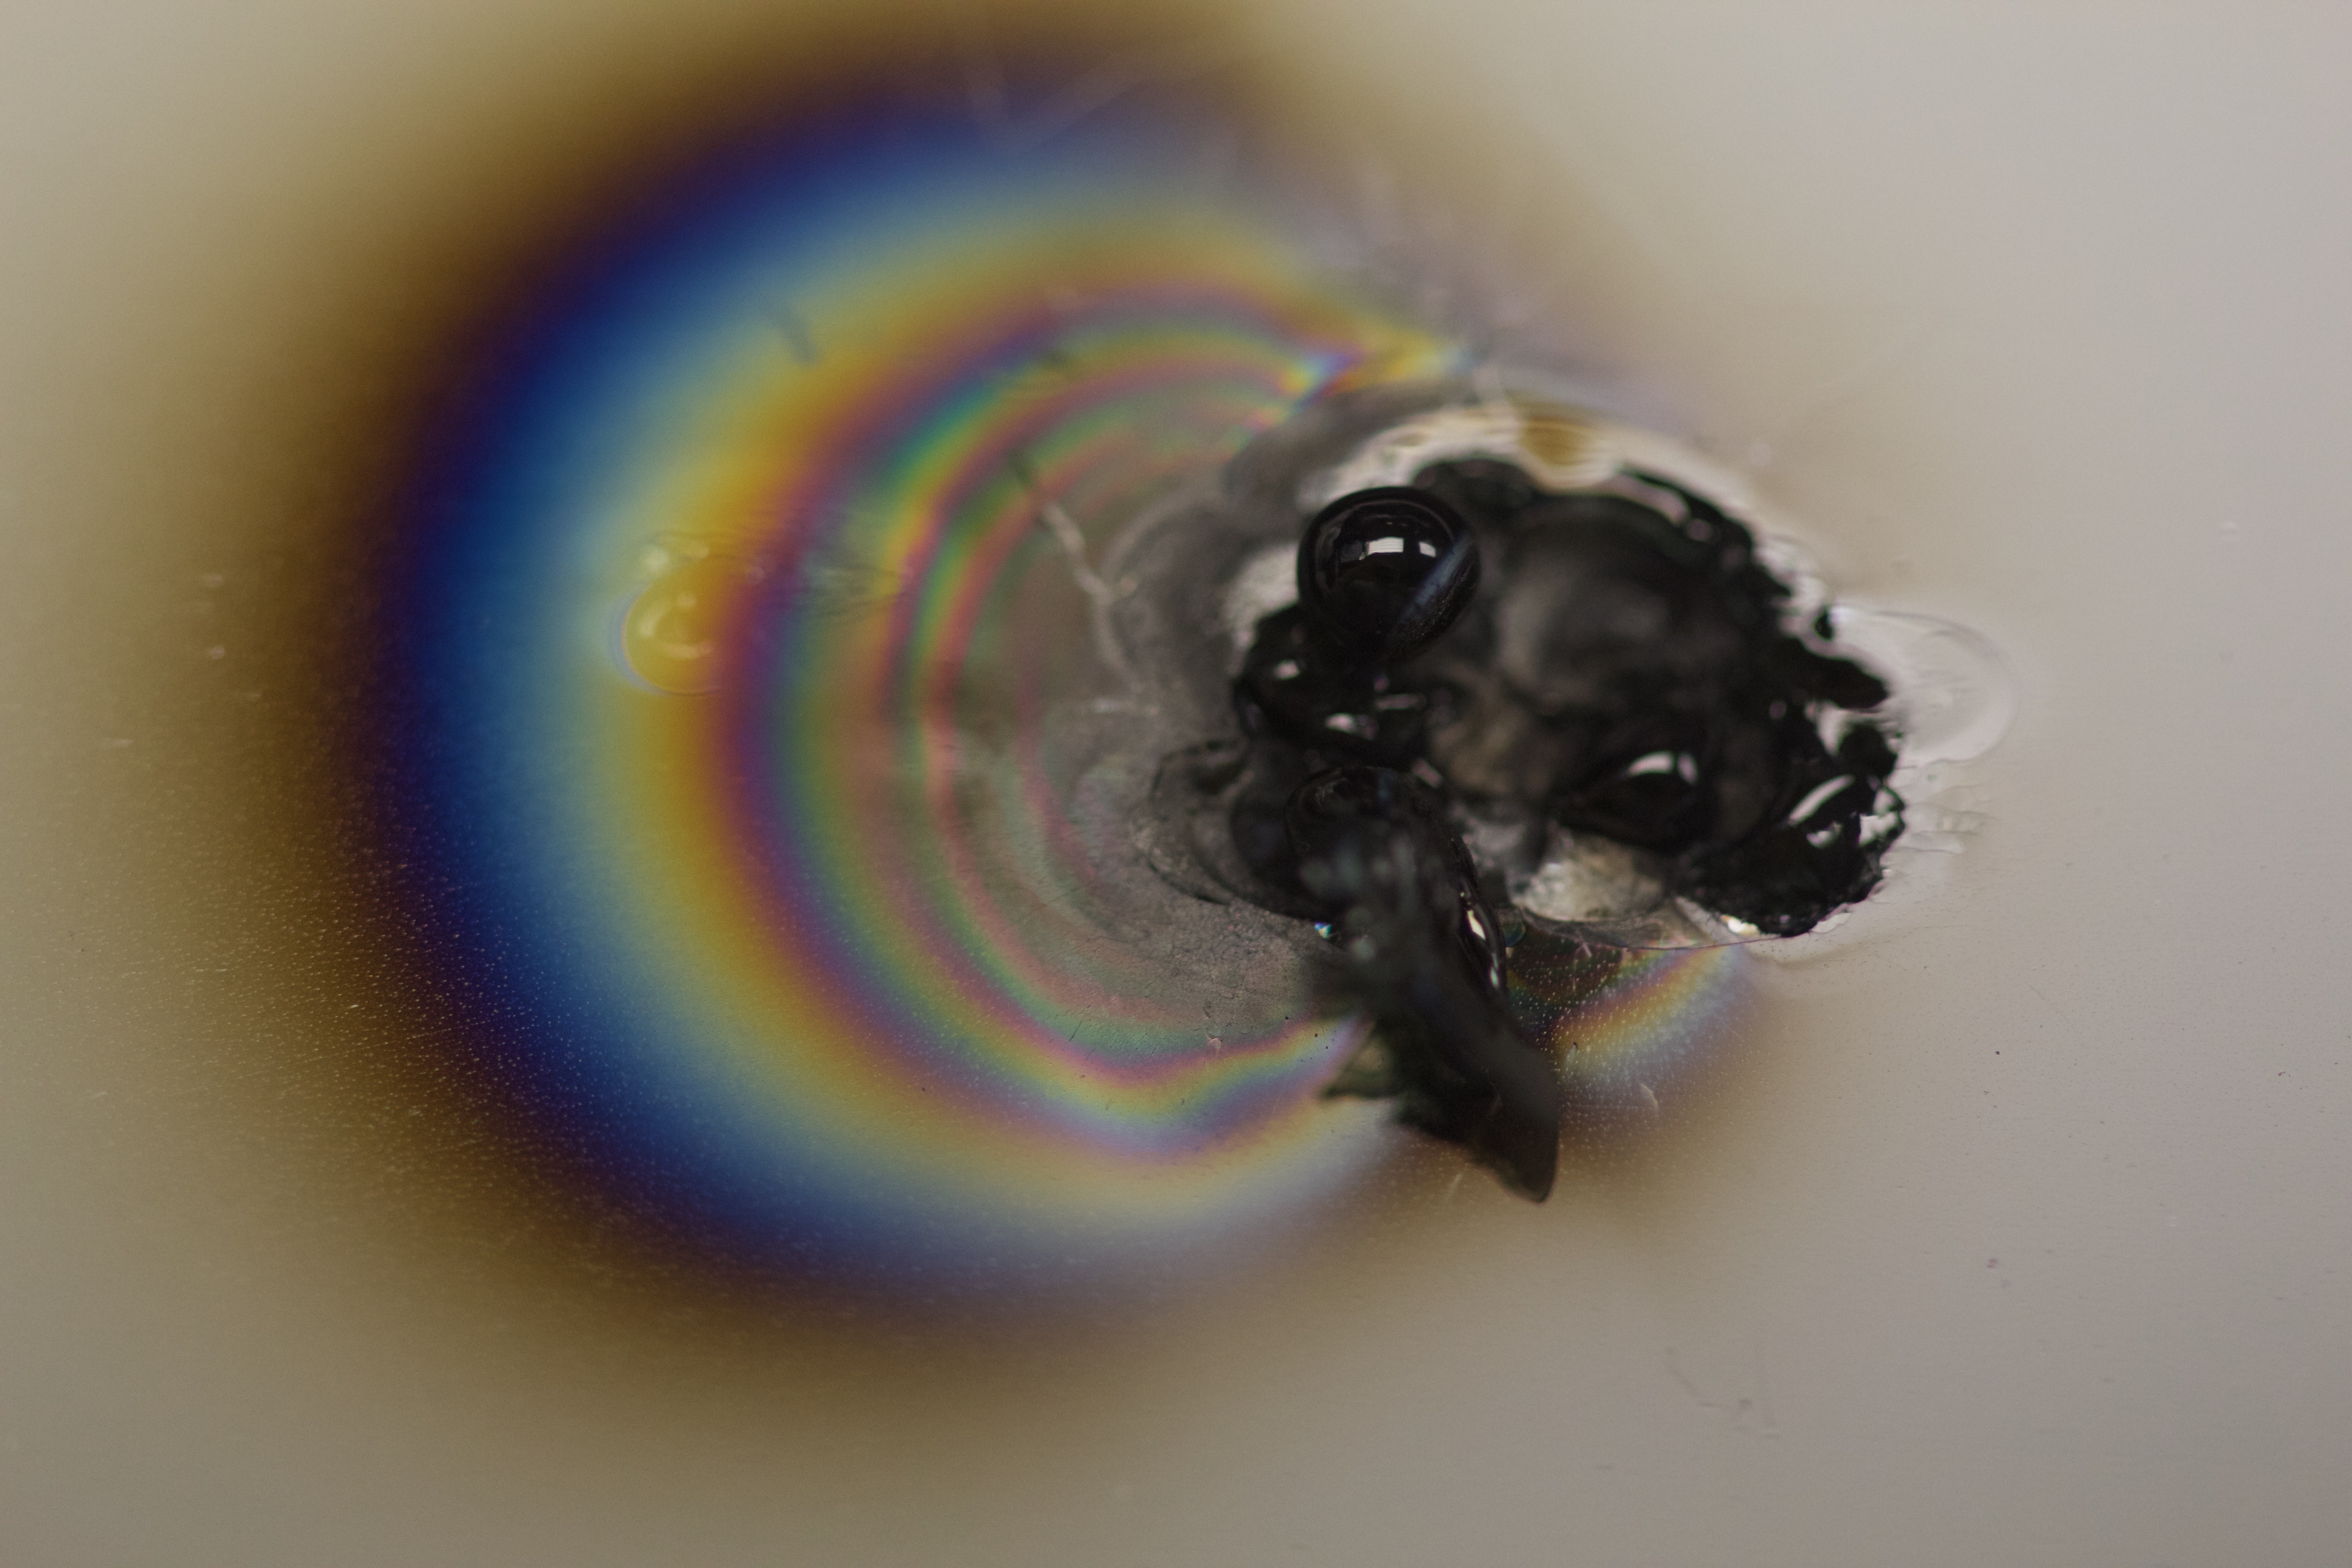
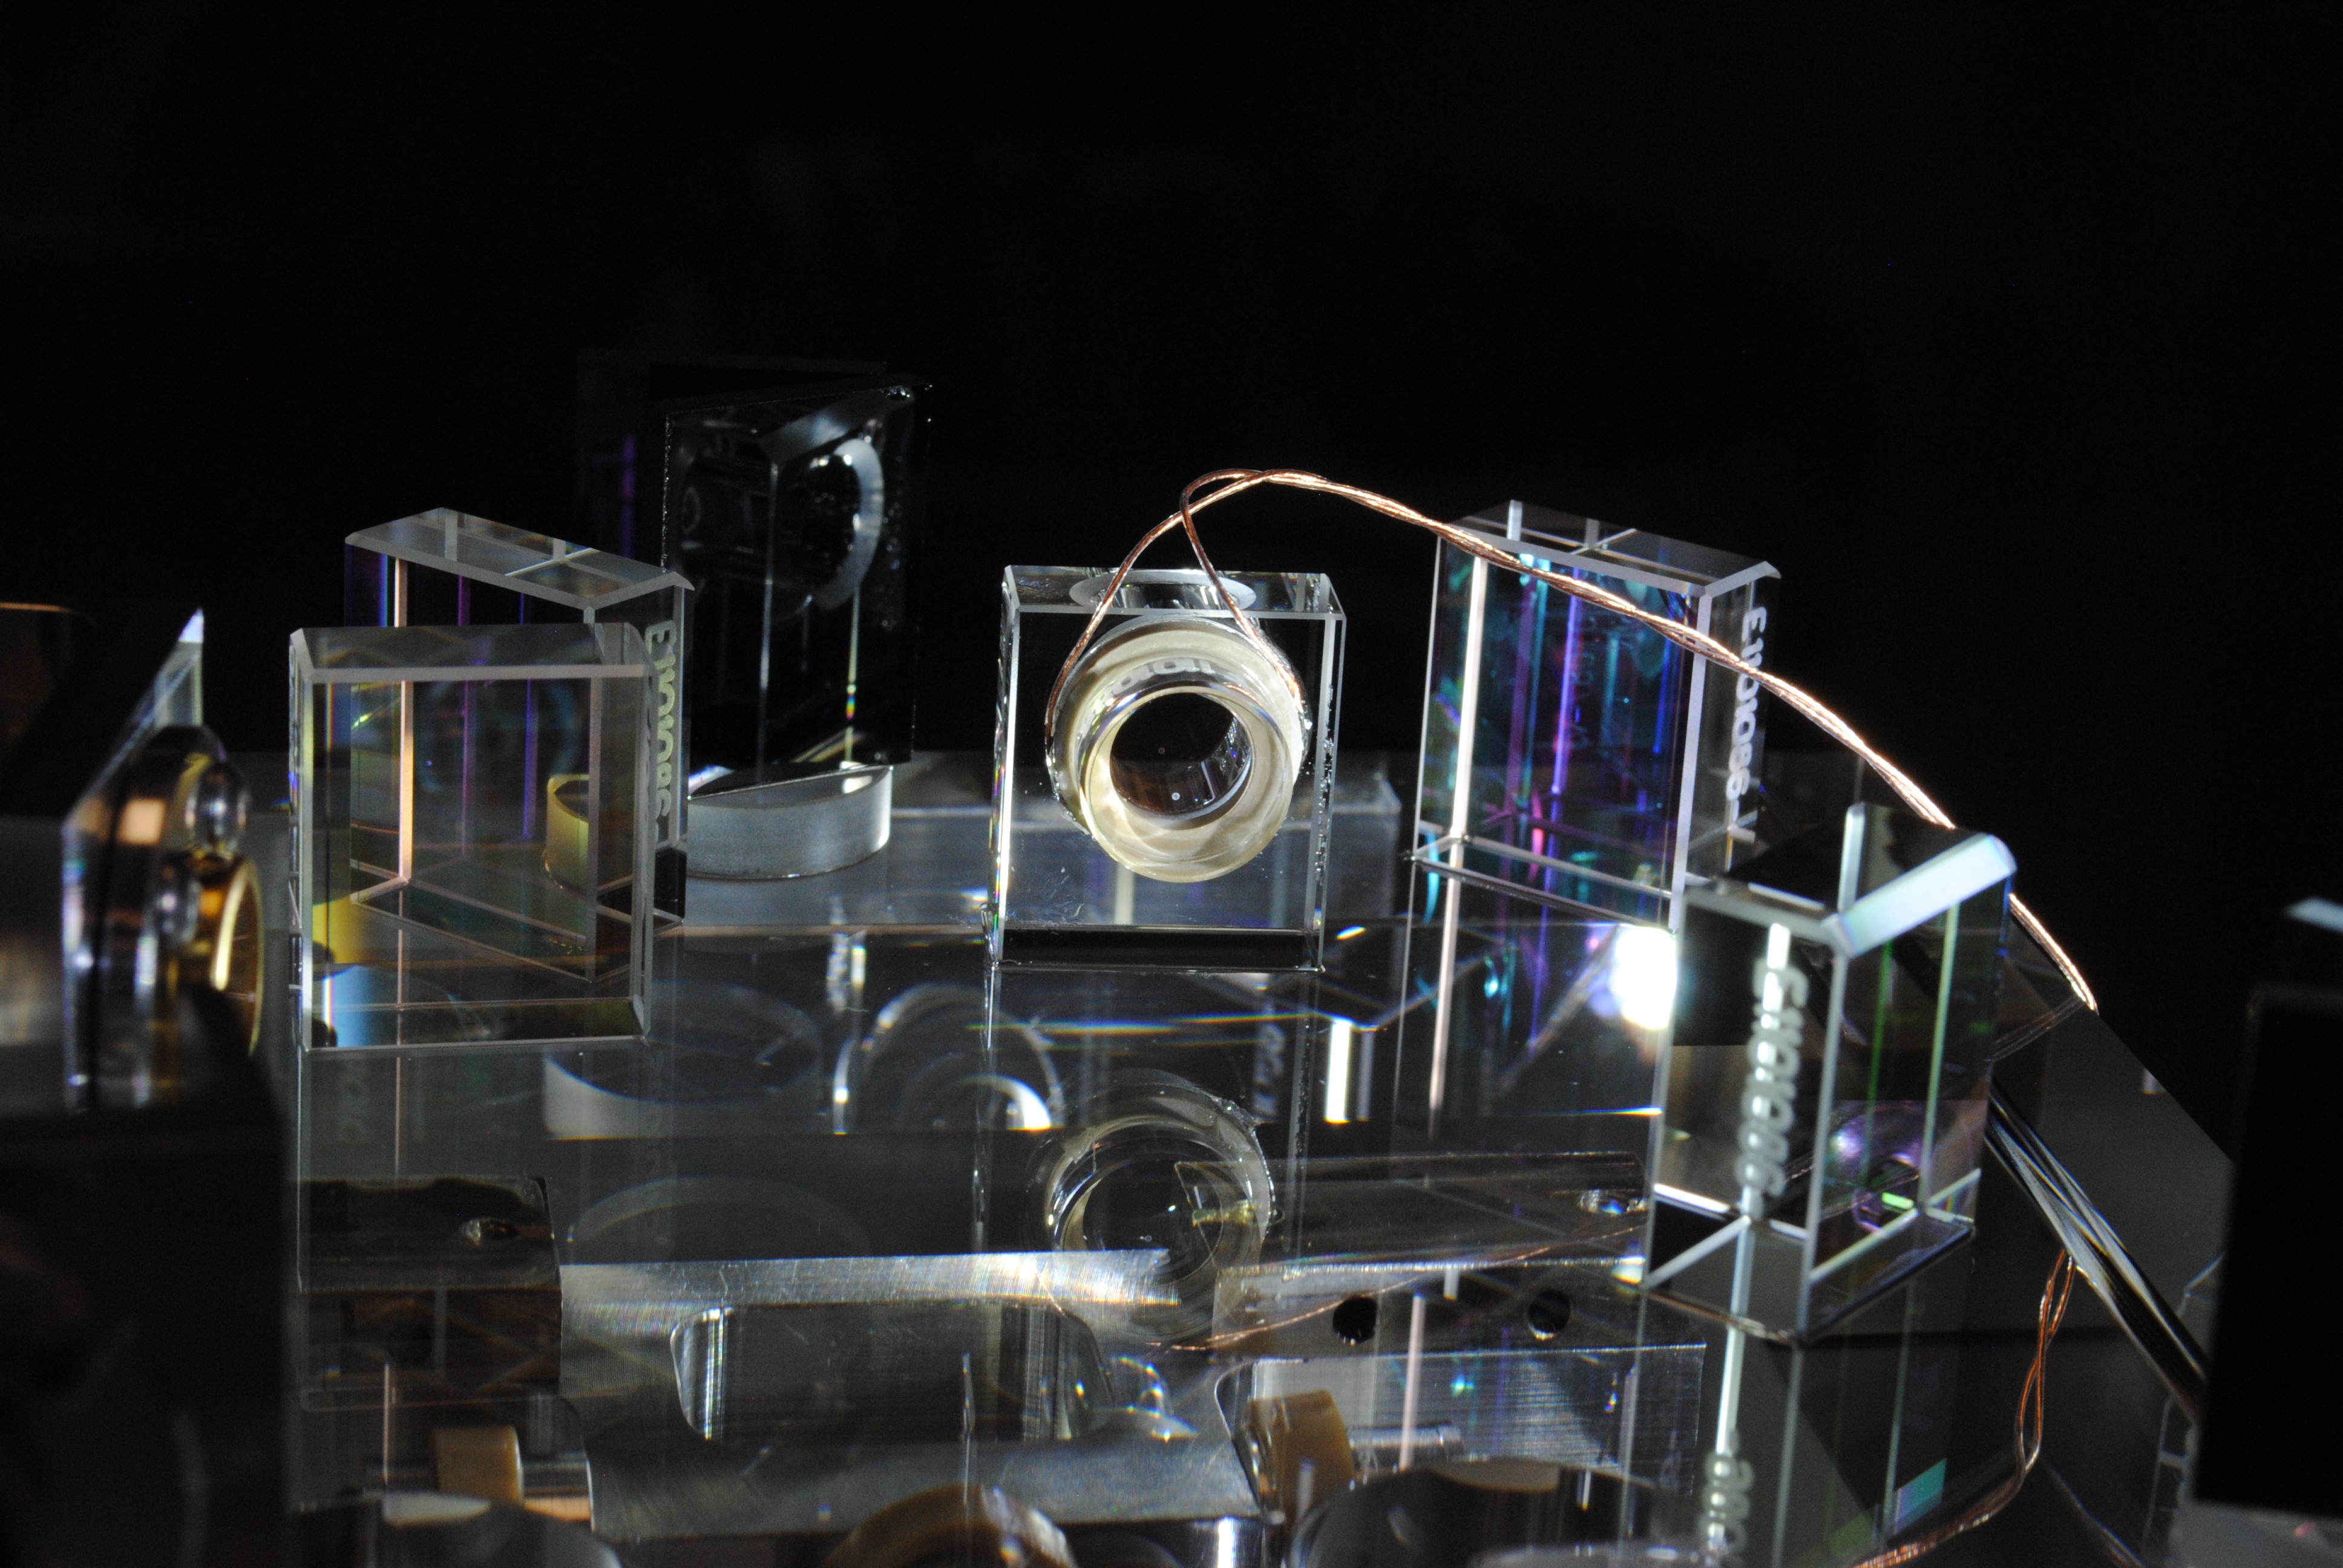
- A panel of the OMC black glass shroud with a burned spot was removed. LHO aLOG 28861
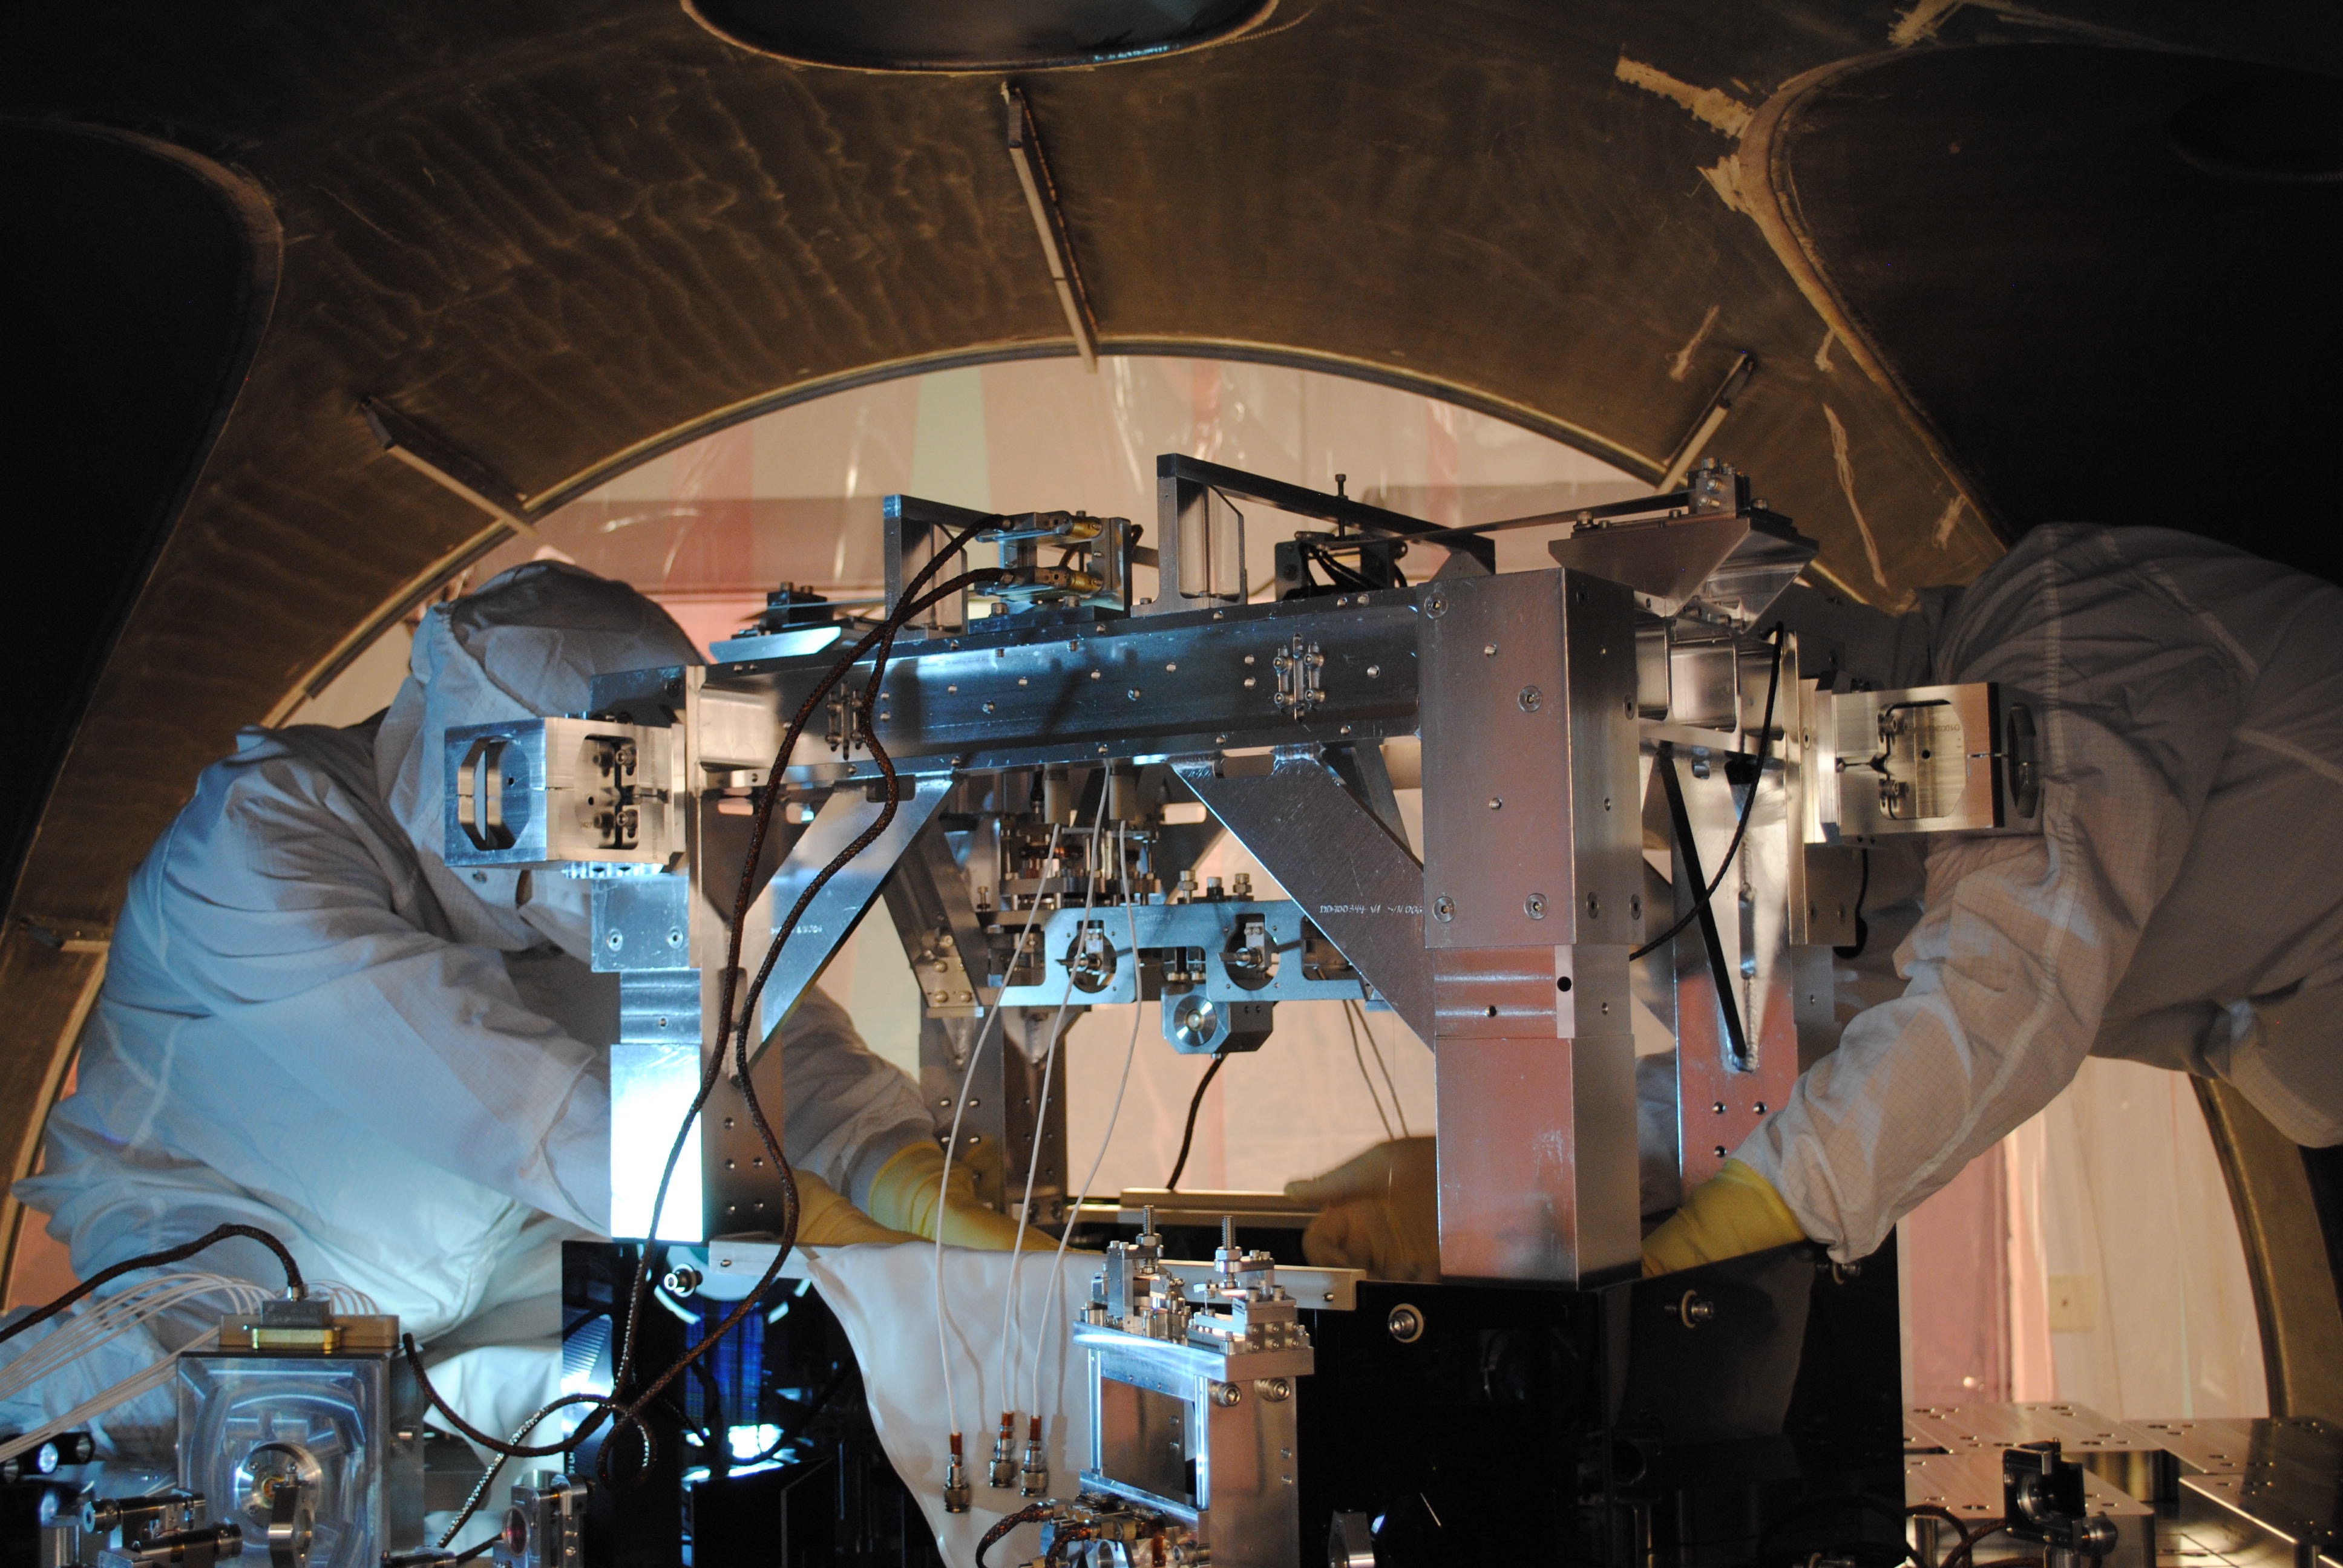
- The new OMC is now suspended in the OMC SUS
- We still need balancing work of the suspension
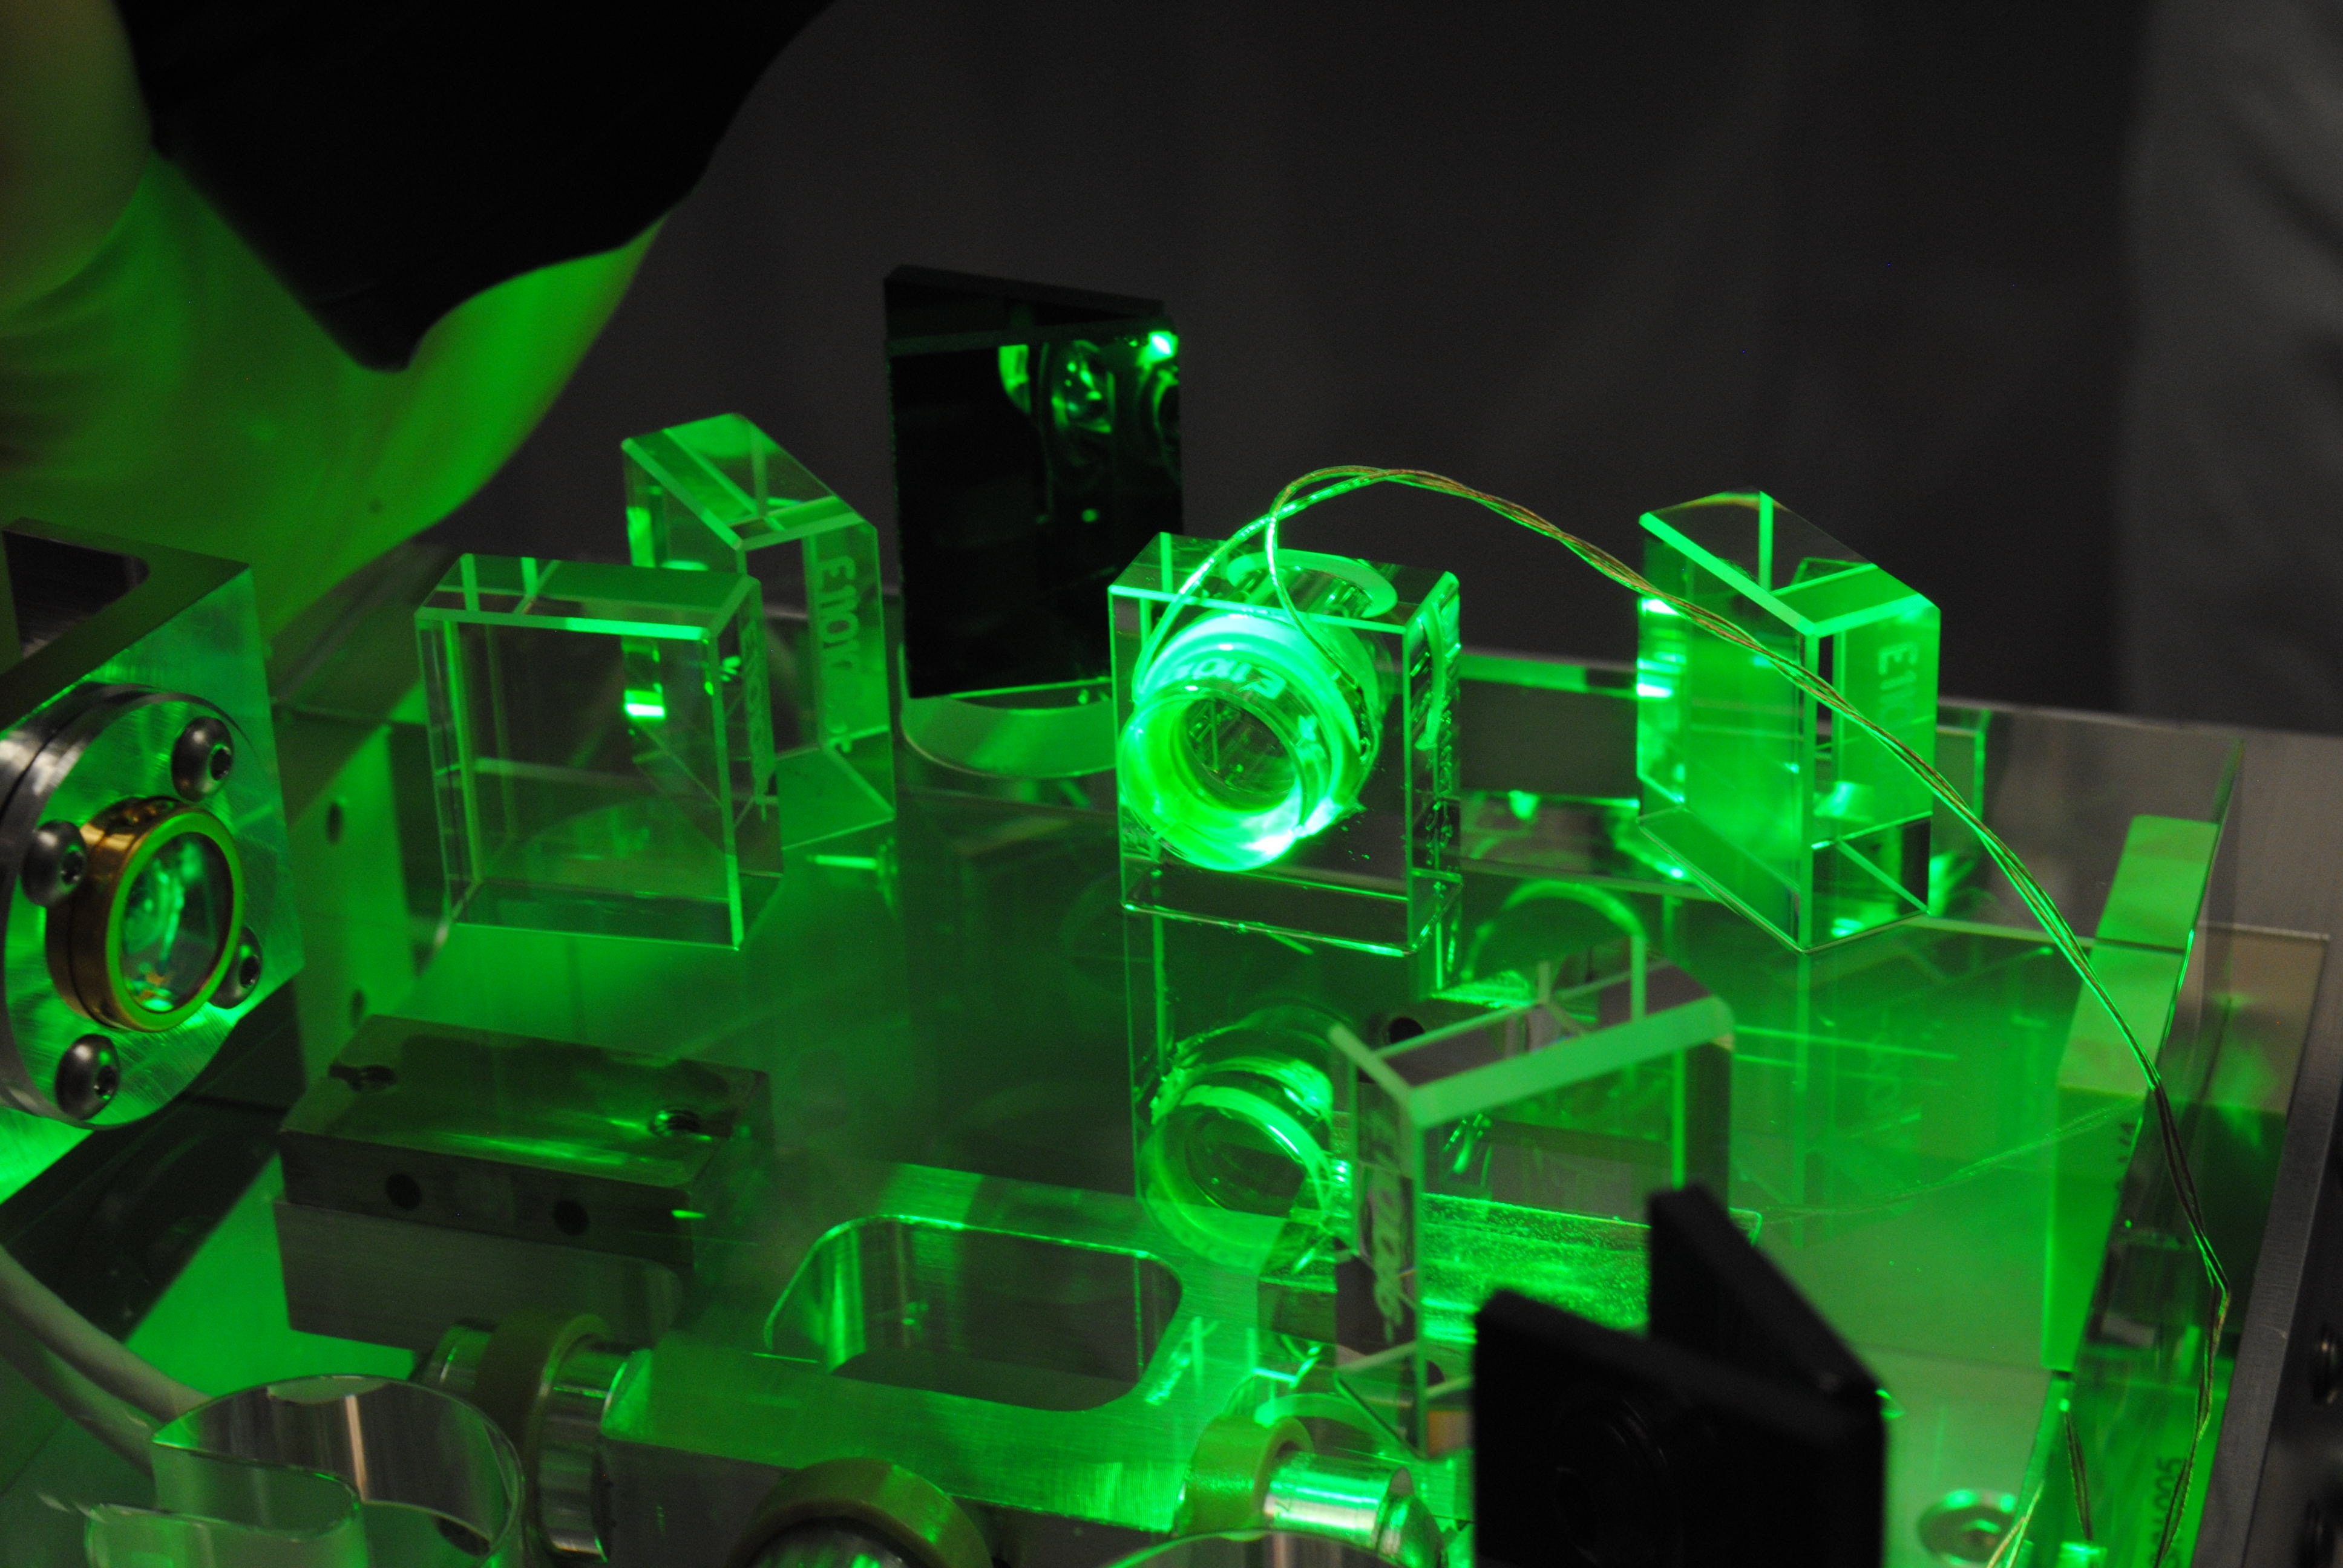
- Once the OMC breadboard is nicely balanced, the beam will be aligned.
- We'll performe the electrical function check.
Details
- The new OMC container was moved from the bonding lab to LVEA
- The weight of the old and new OMC was compared. All the balance masses were moved from the old OMC to the new OMC. Then to reduce the exess mass of the new OMC, 10g mass was removed from each ballast at the DCPD side. (10g+10g was removed.) This made the new OMC 2g lighter then the old one. Betsy keeps the actual numbers.
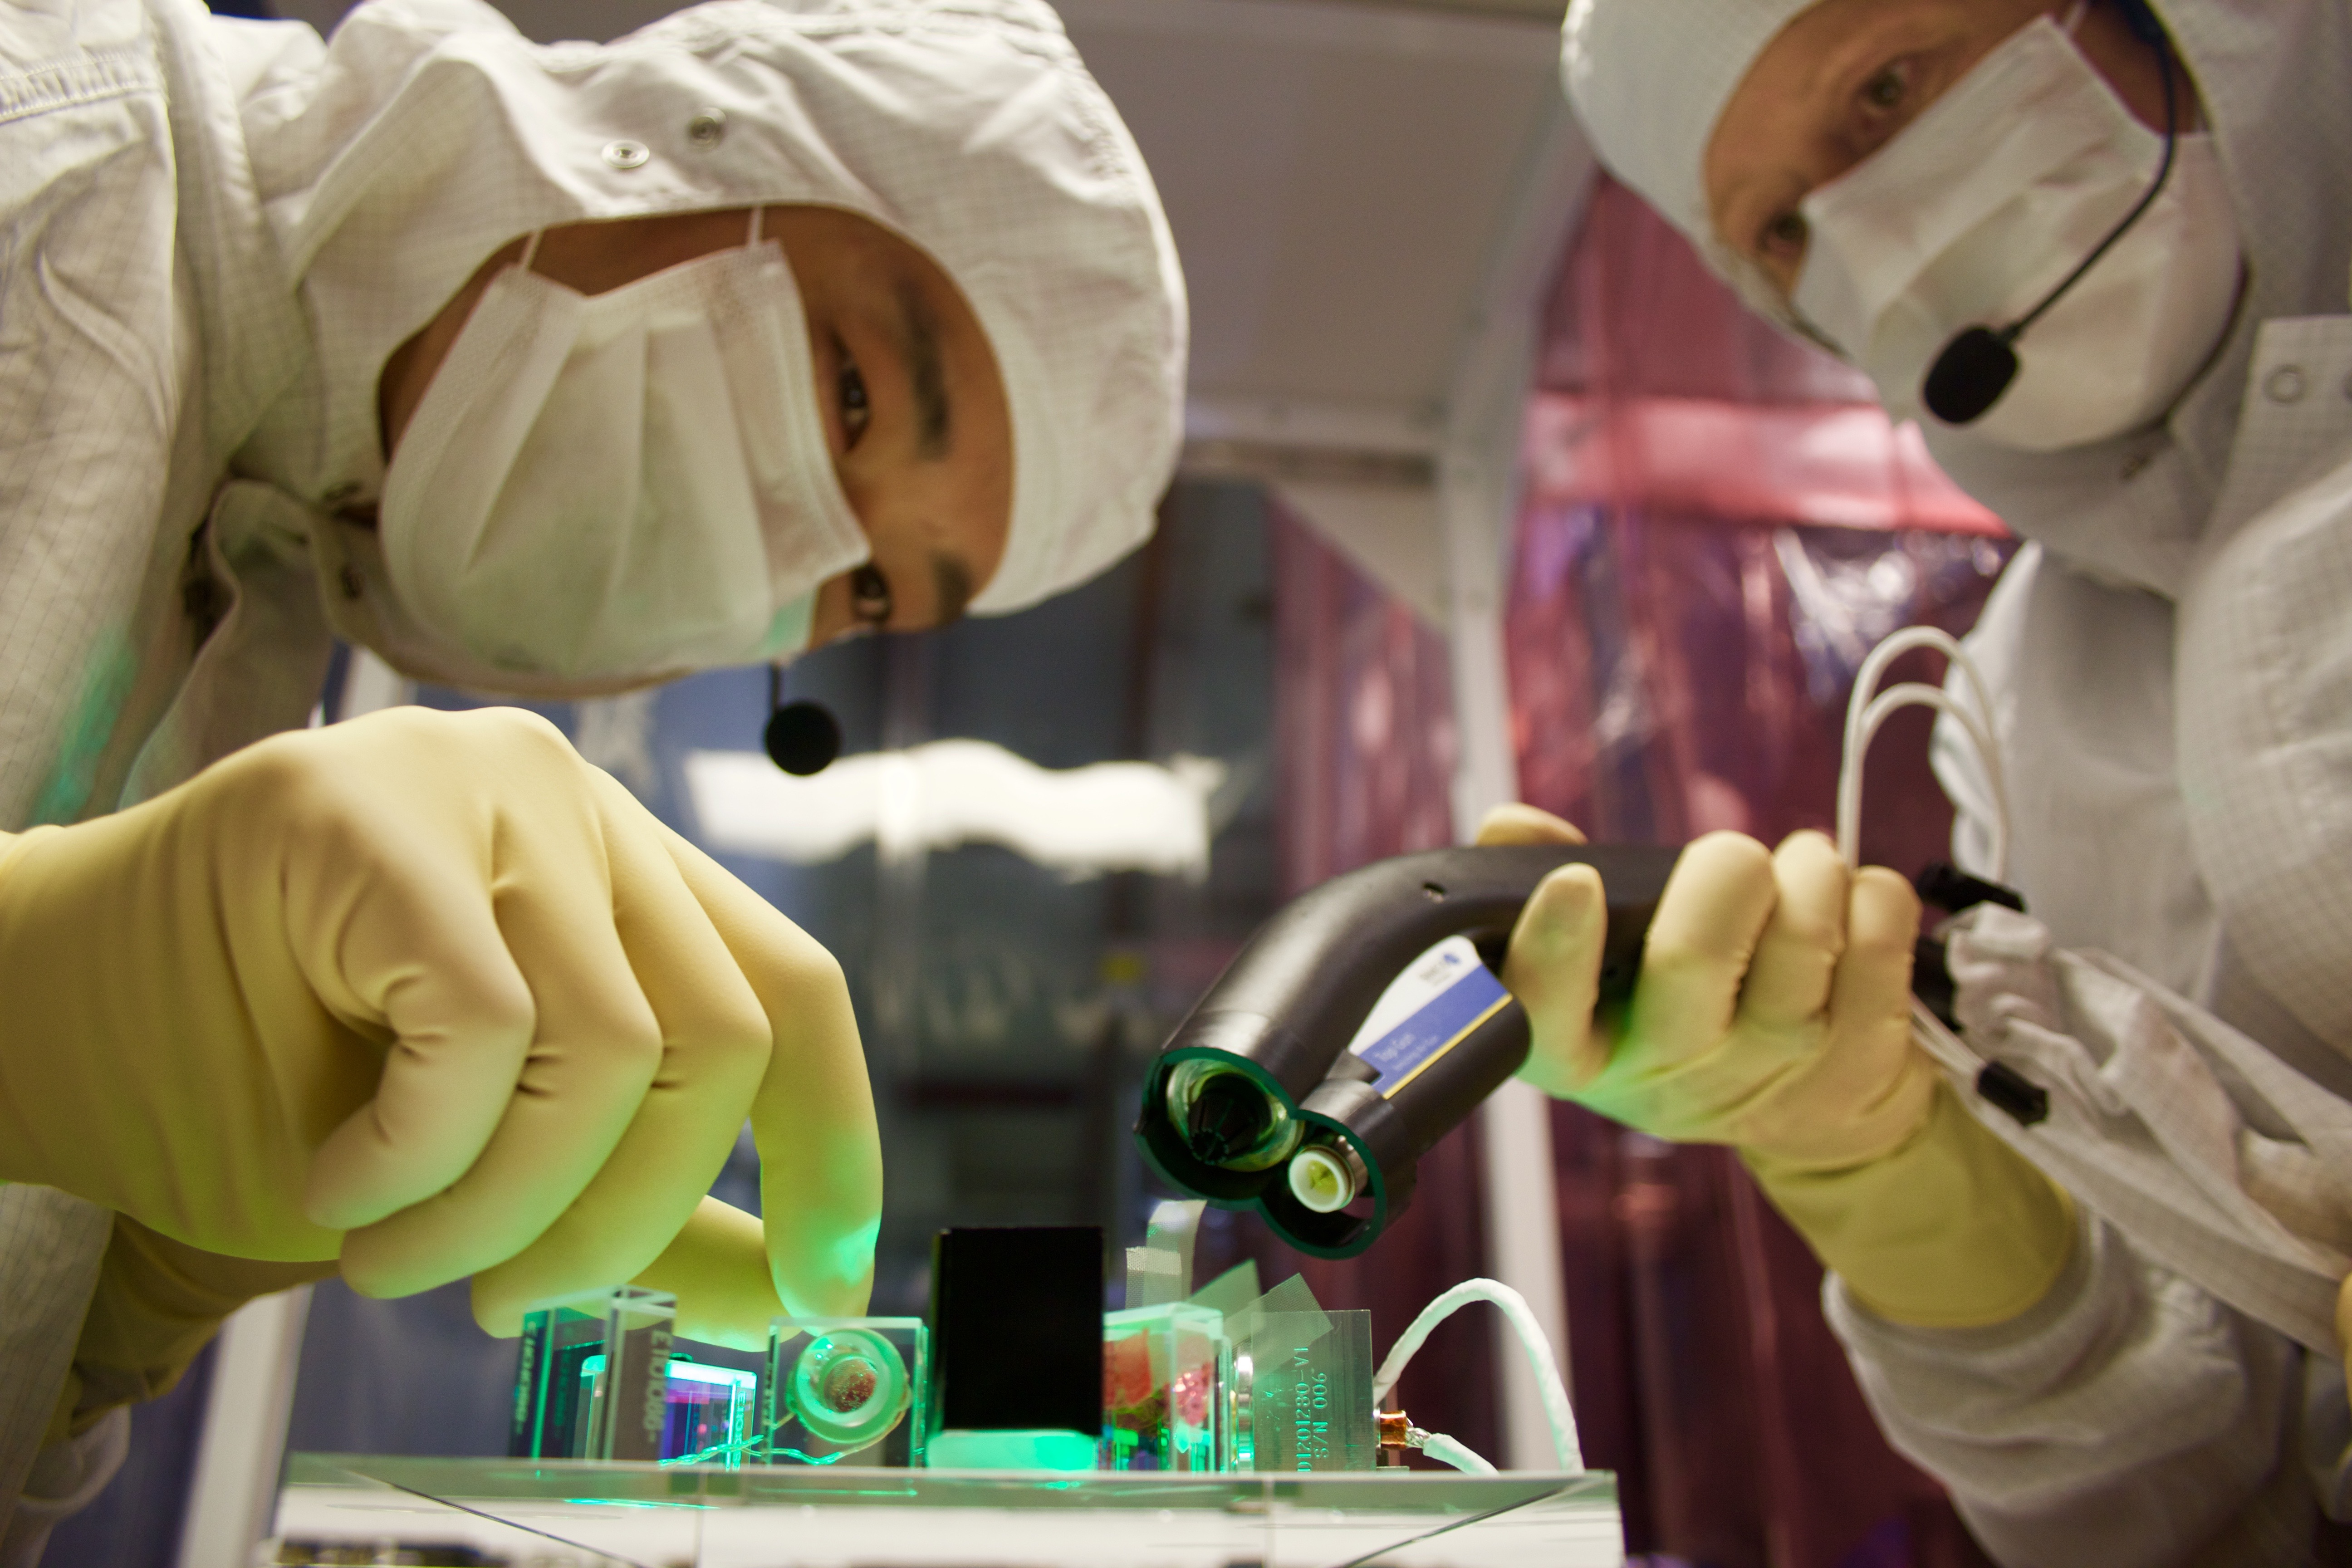
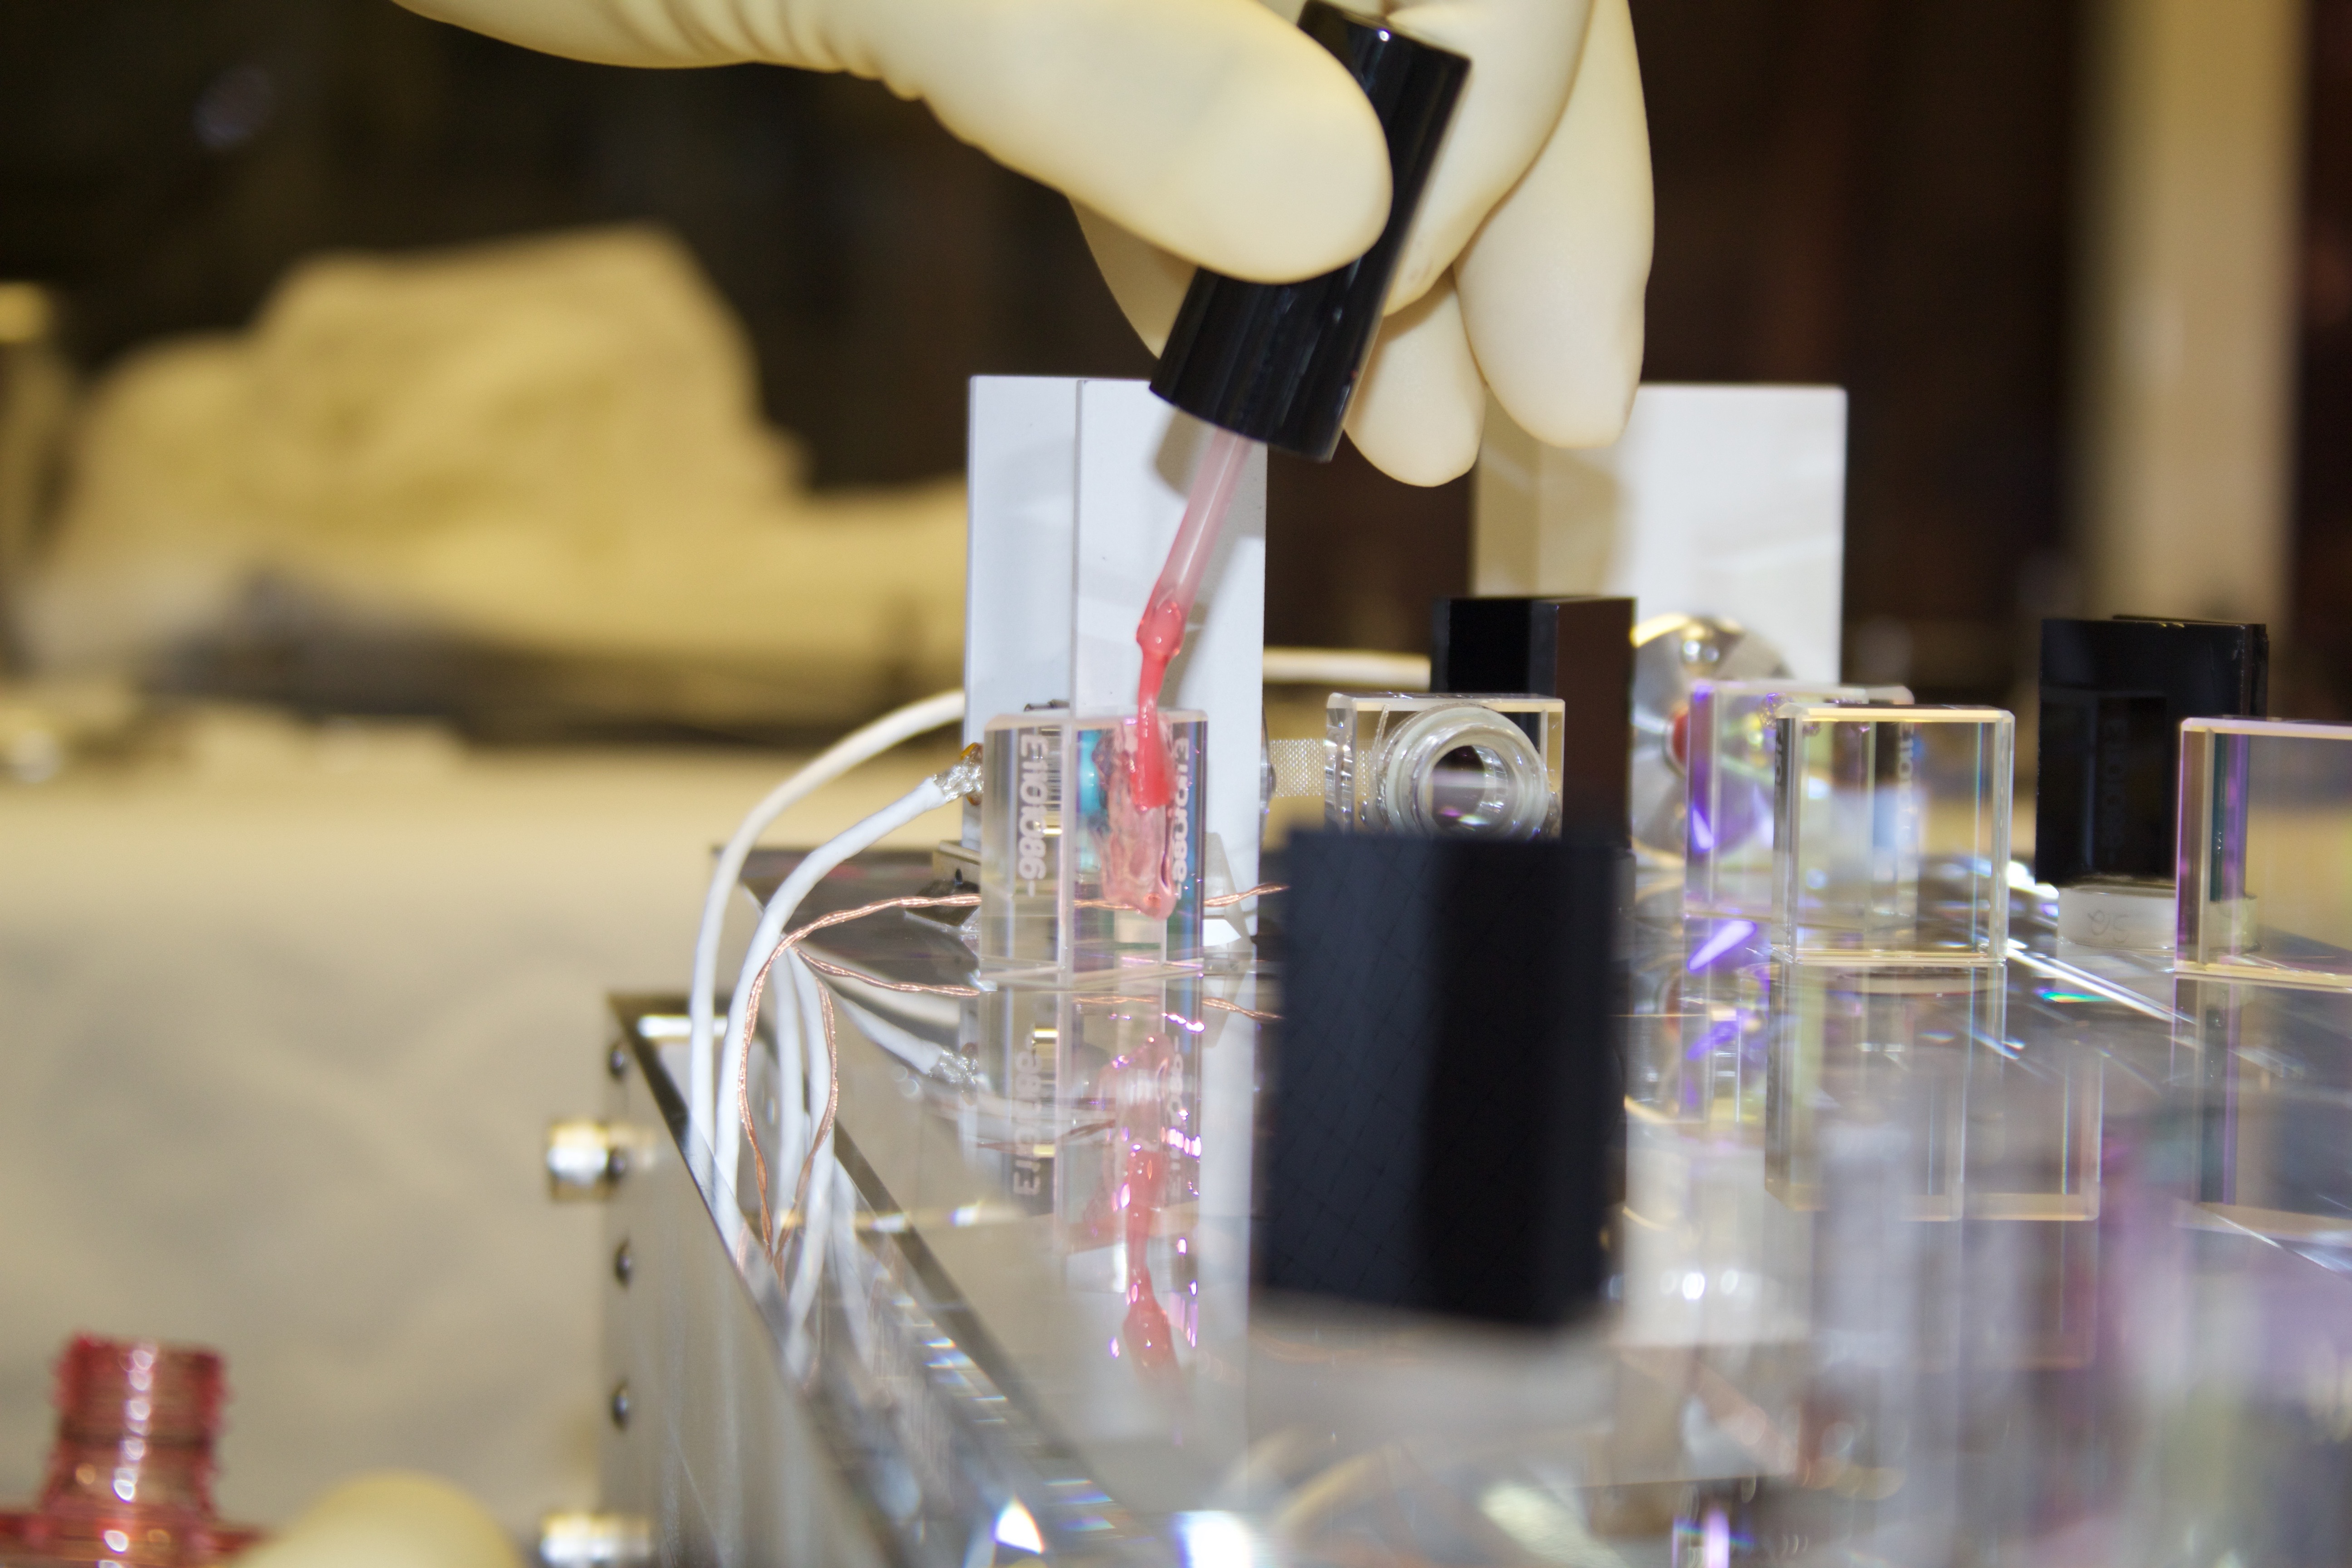
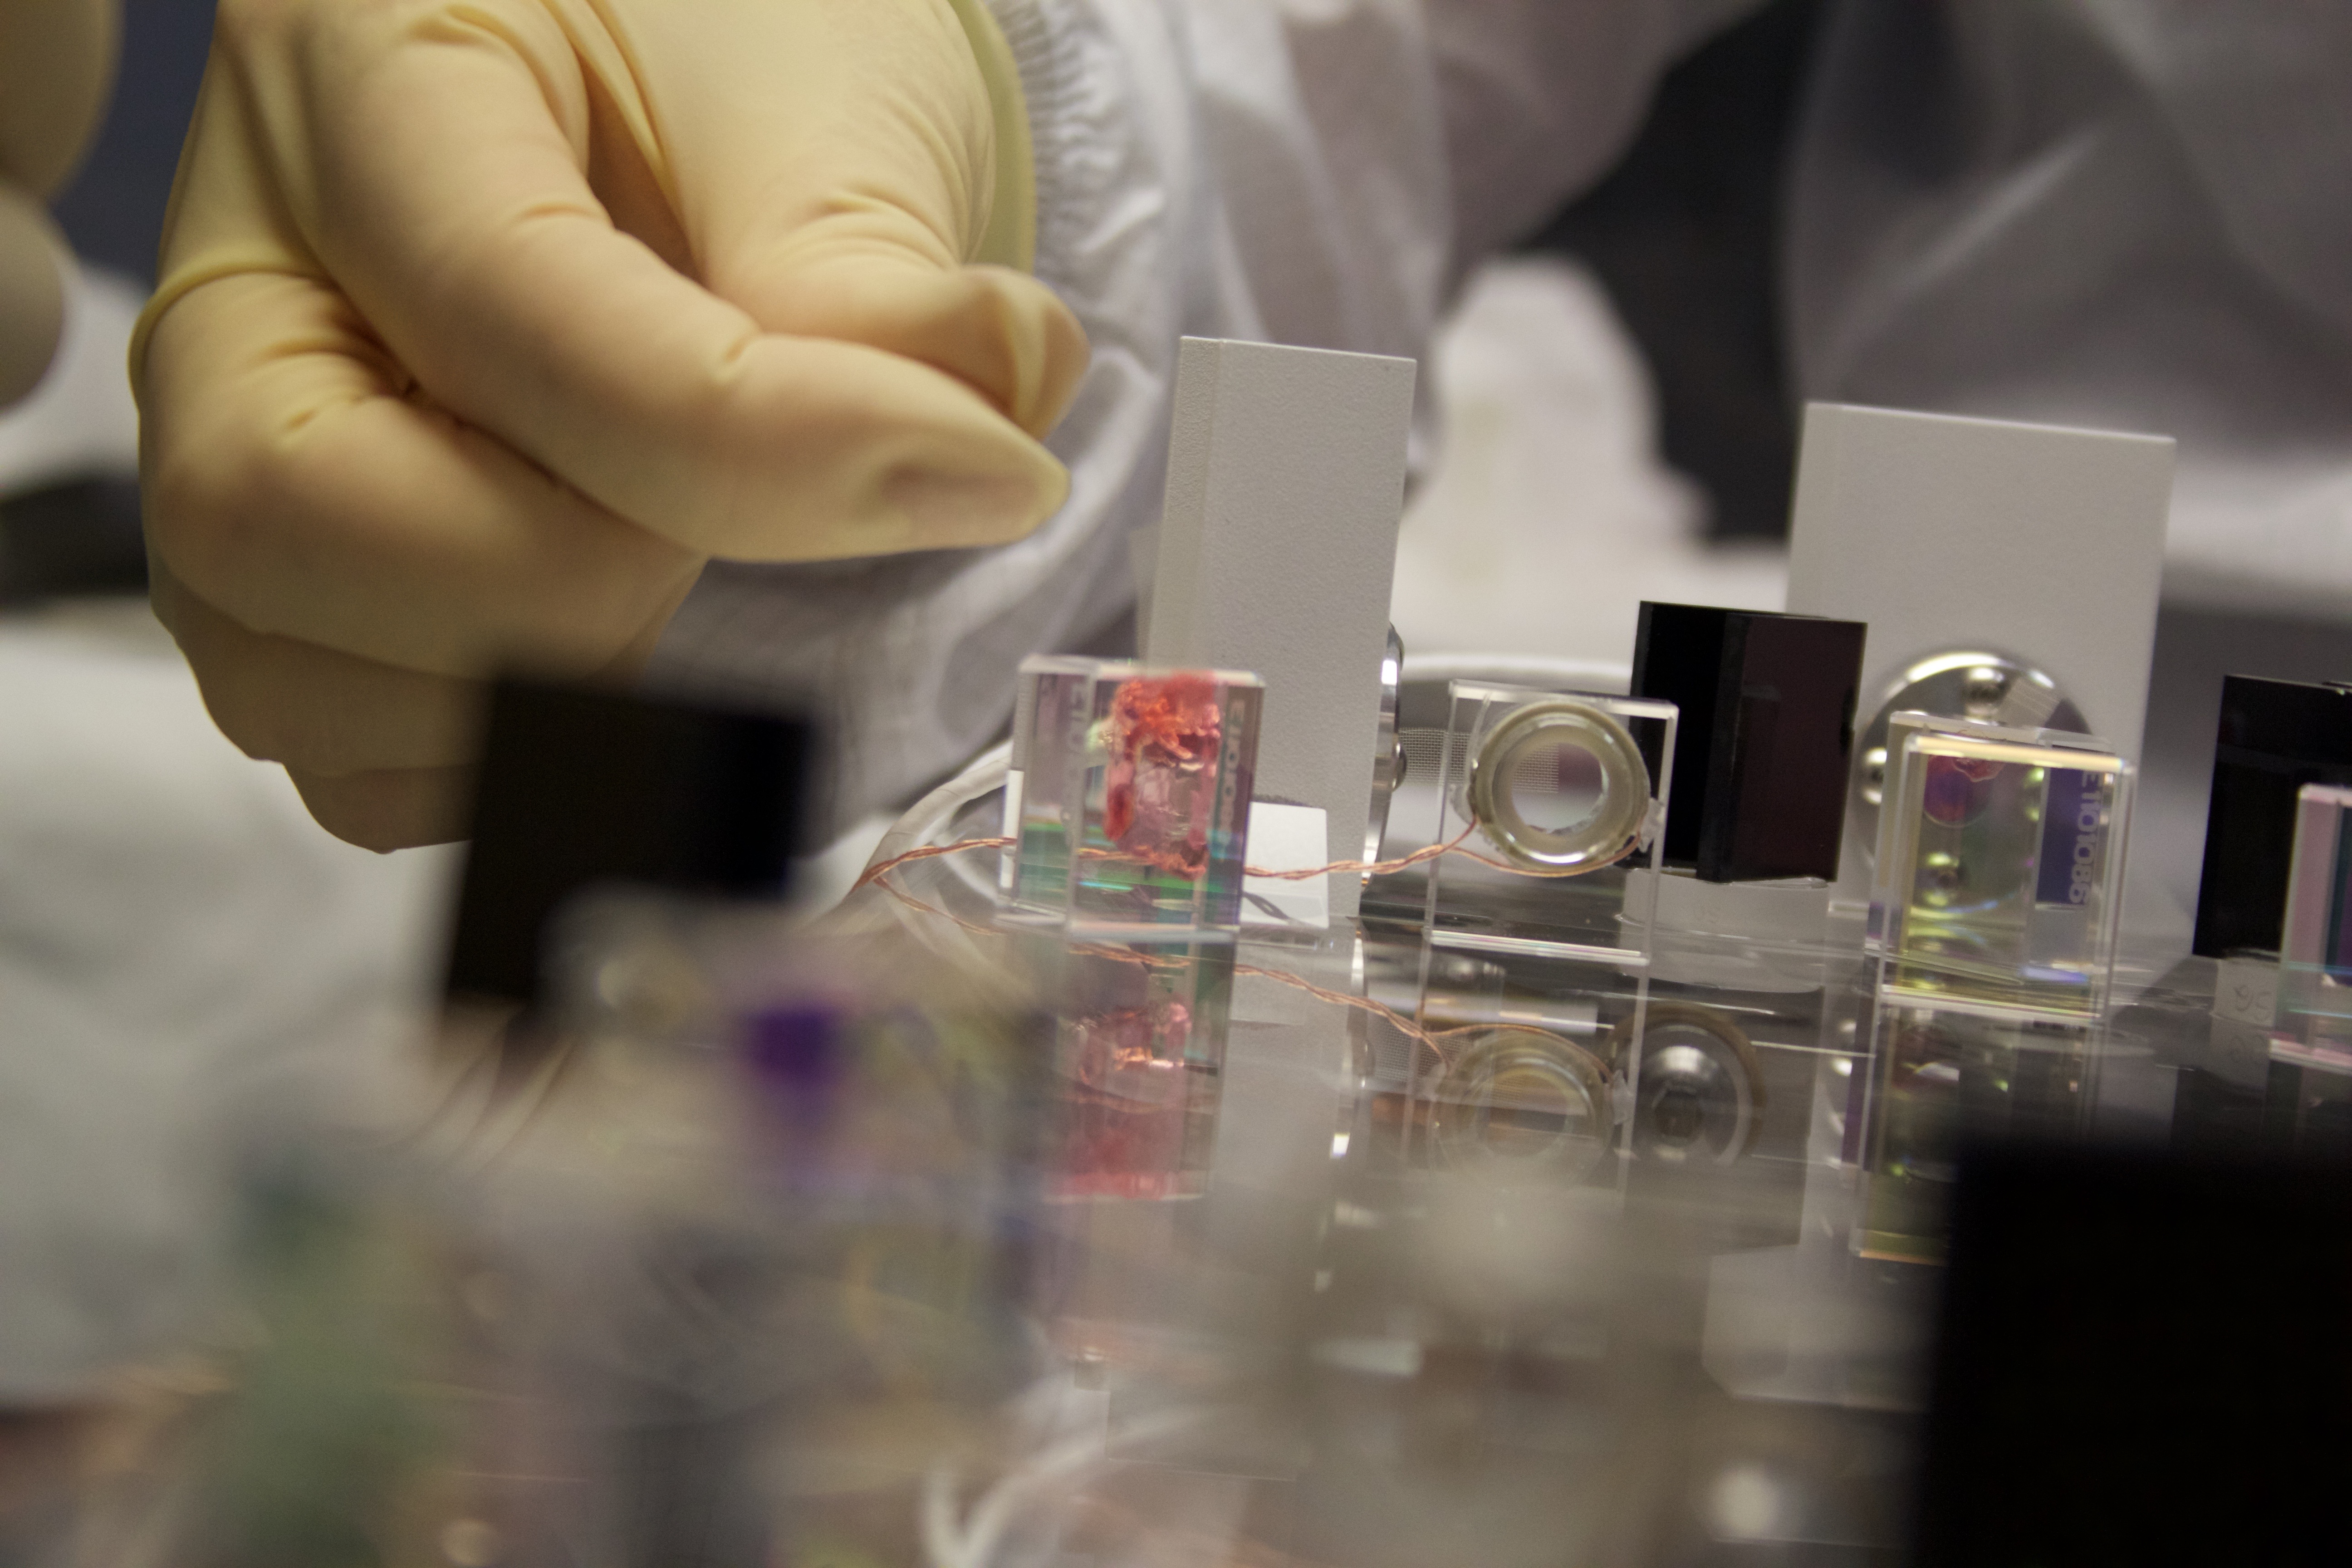
- The first contact films were removed at the chamber side. Some residuals were seen on non-cavity mirror optics. They were removed by another trial of the FC.
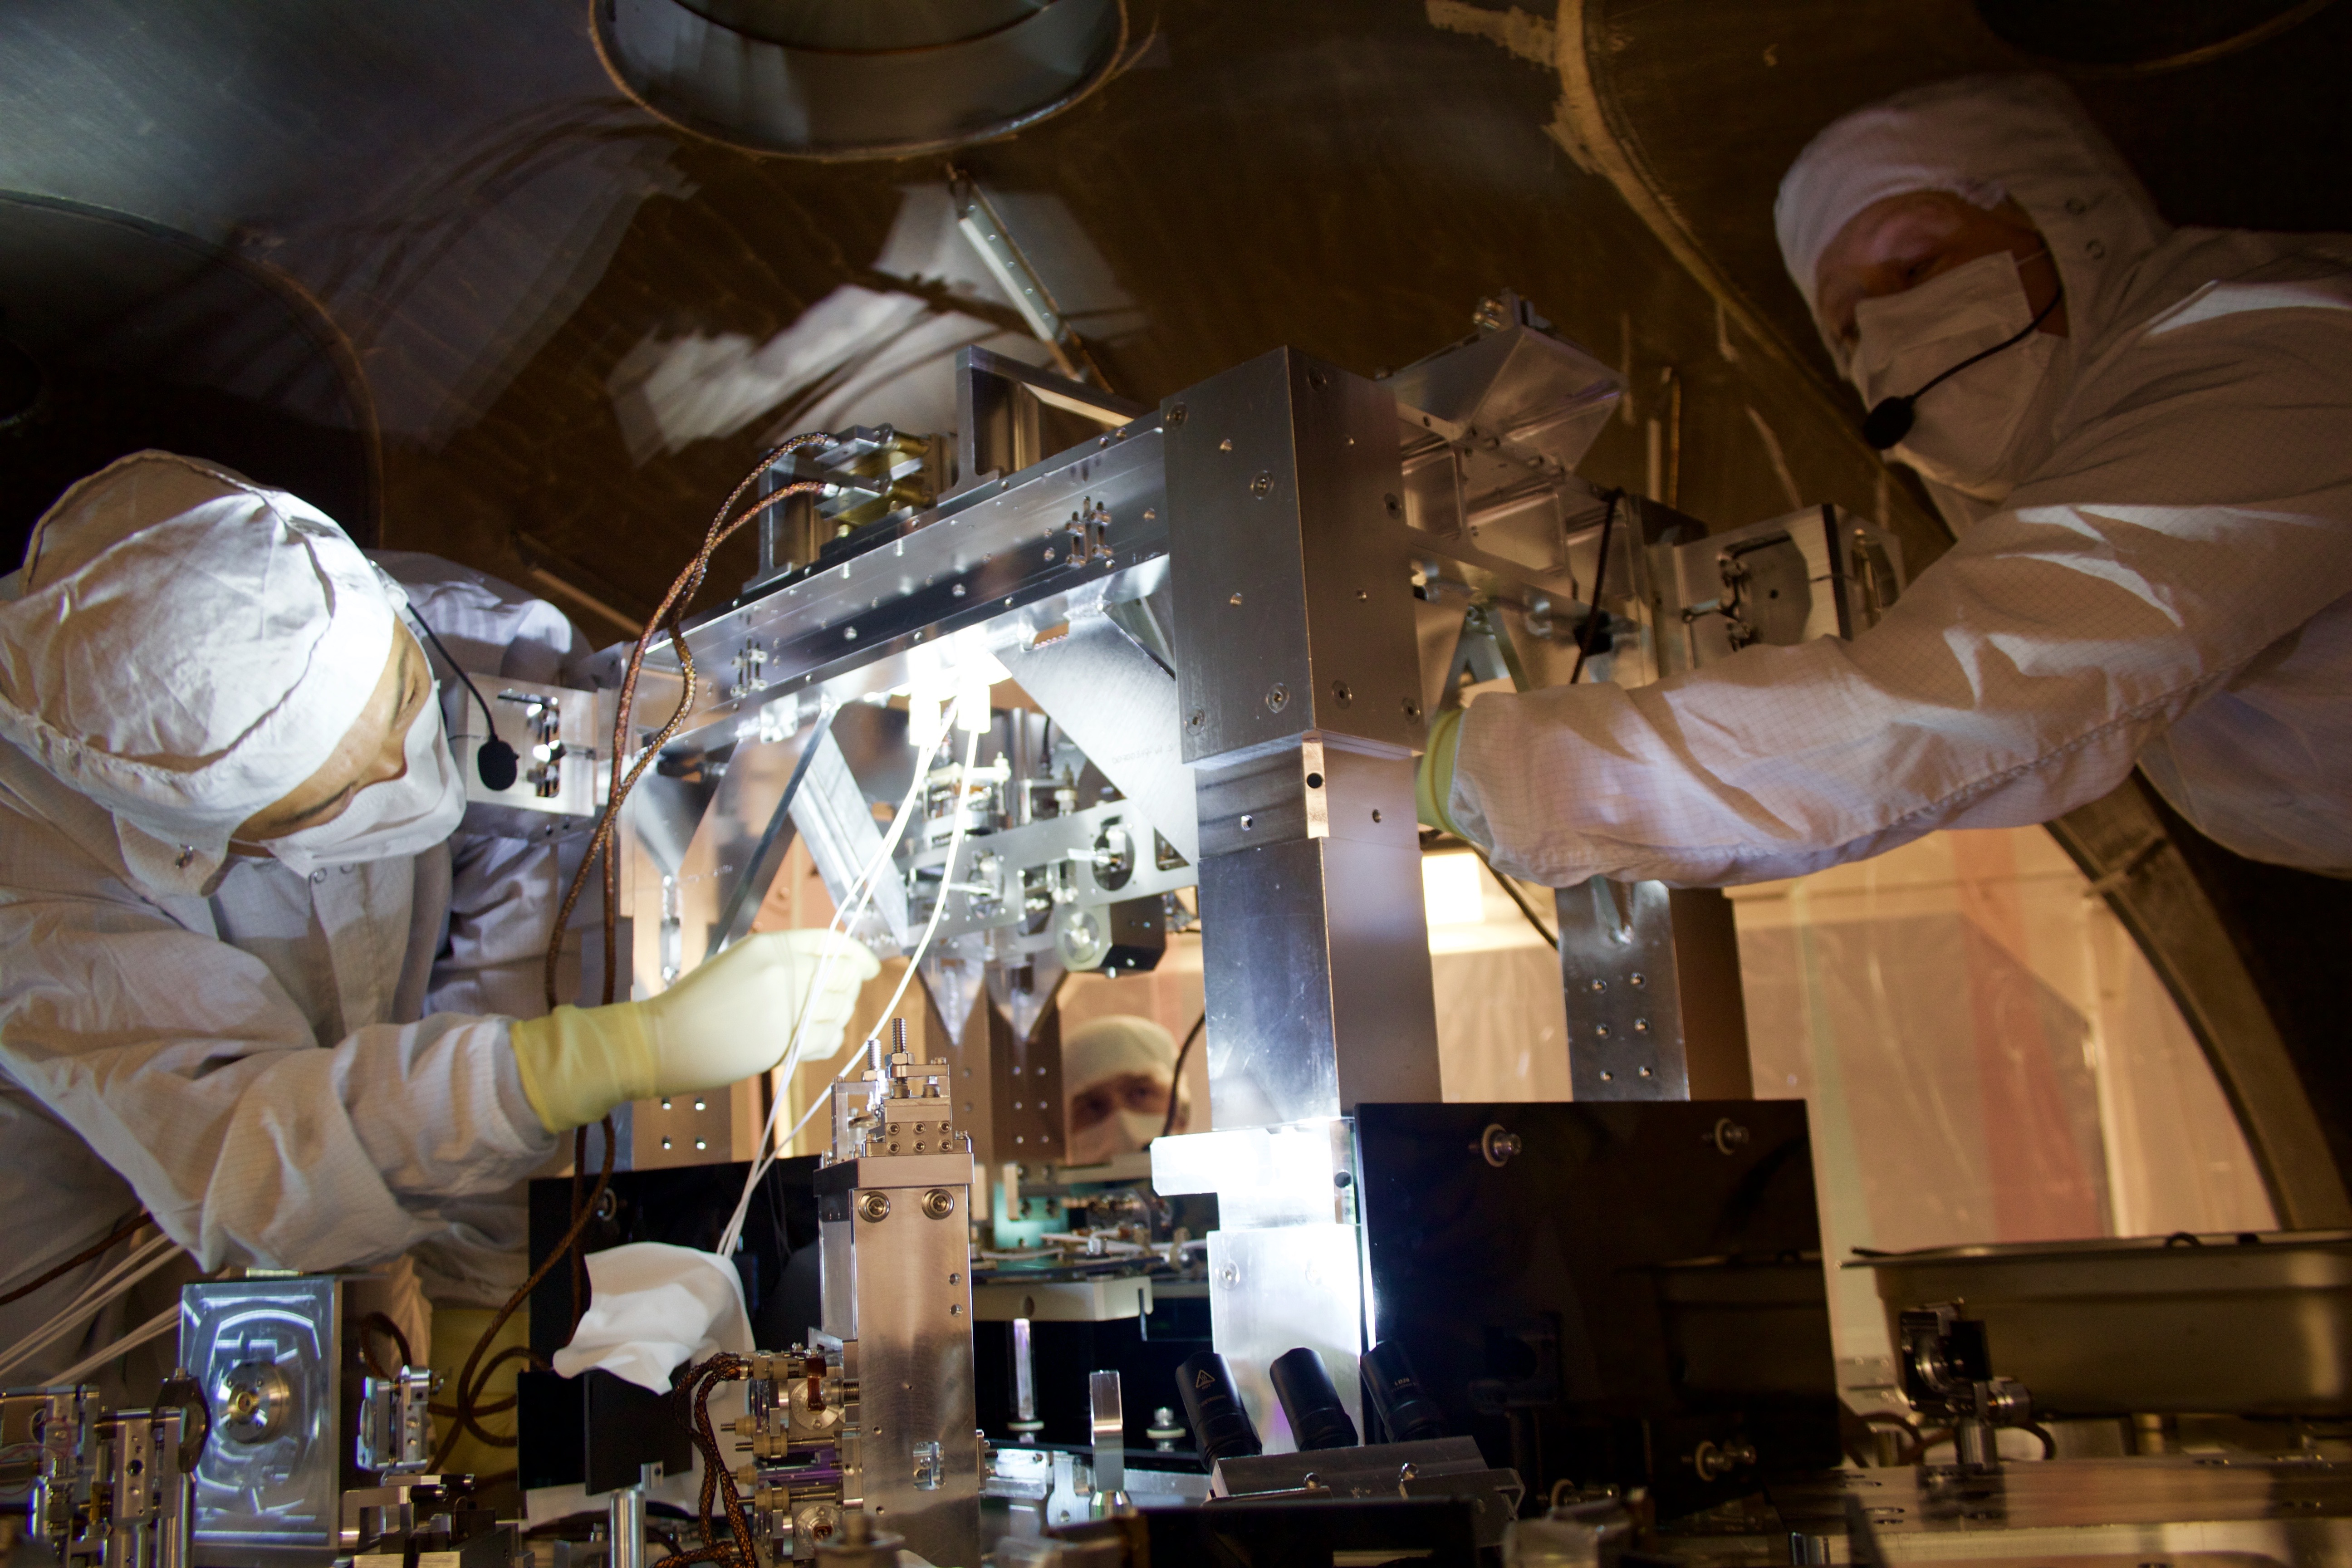
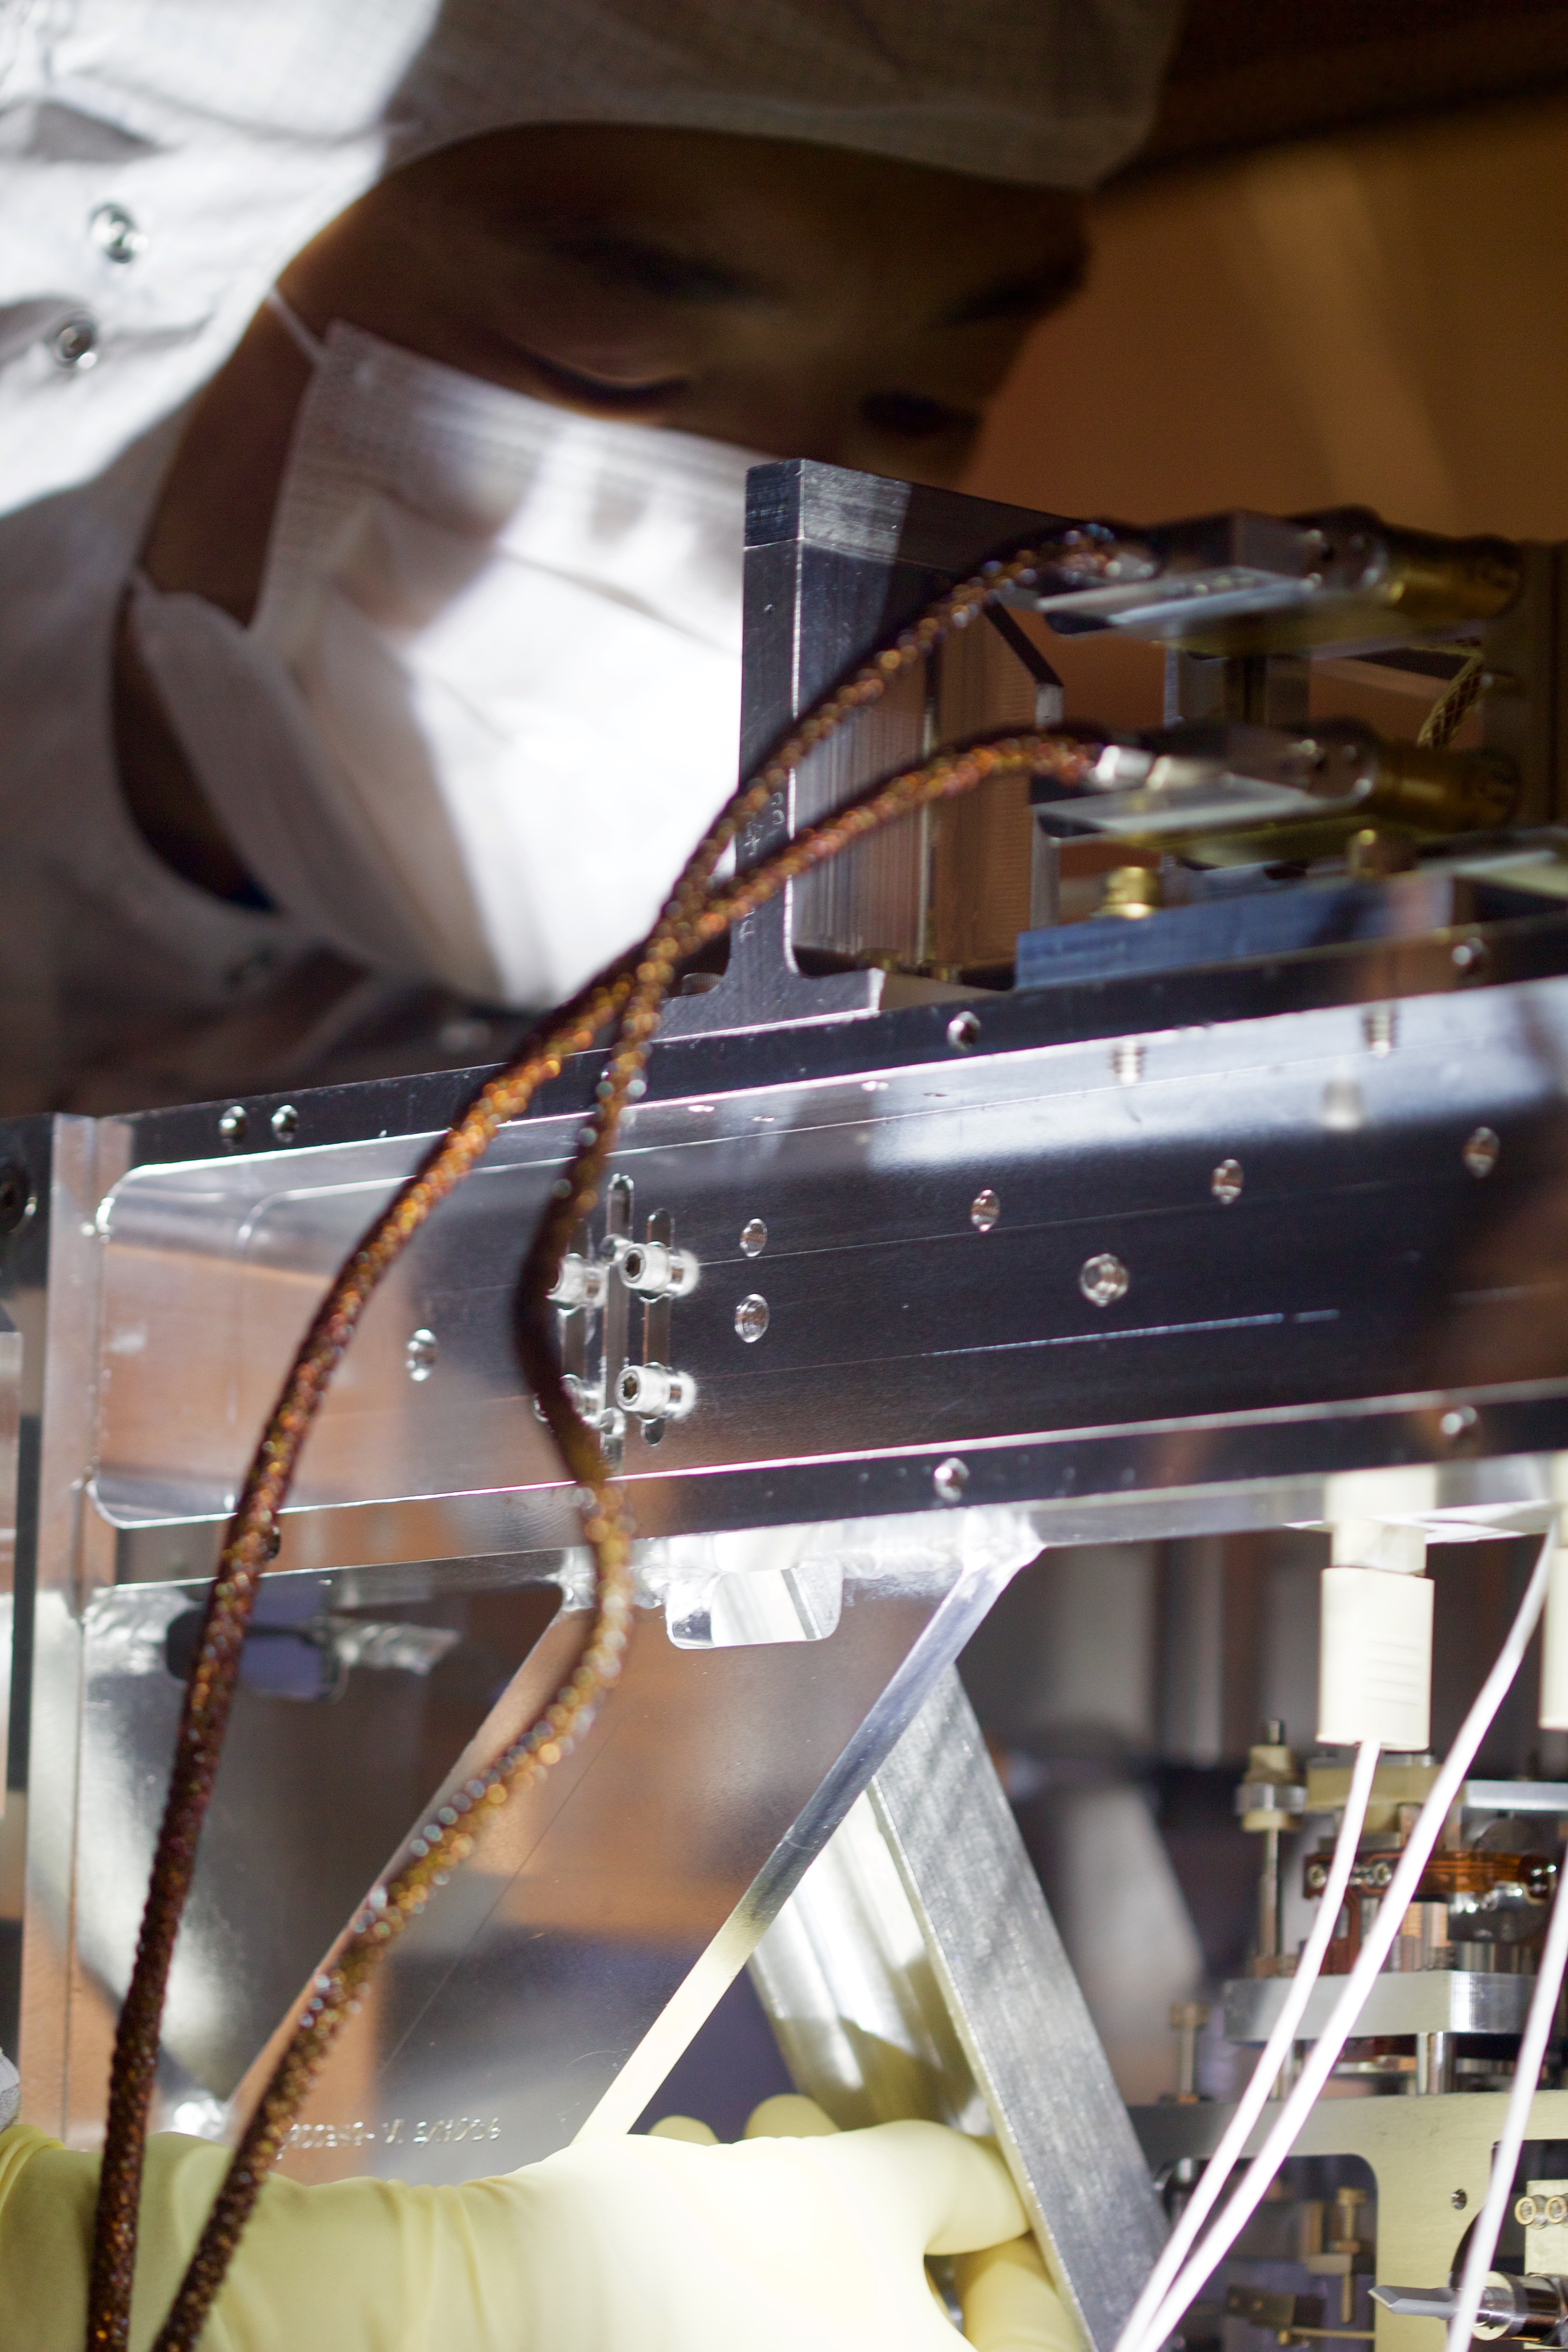
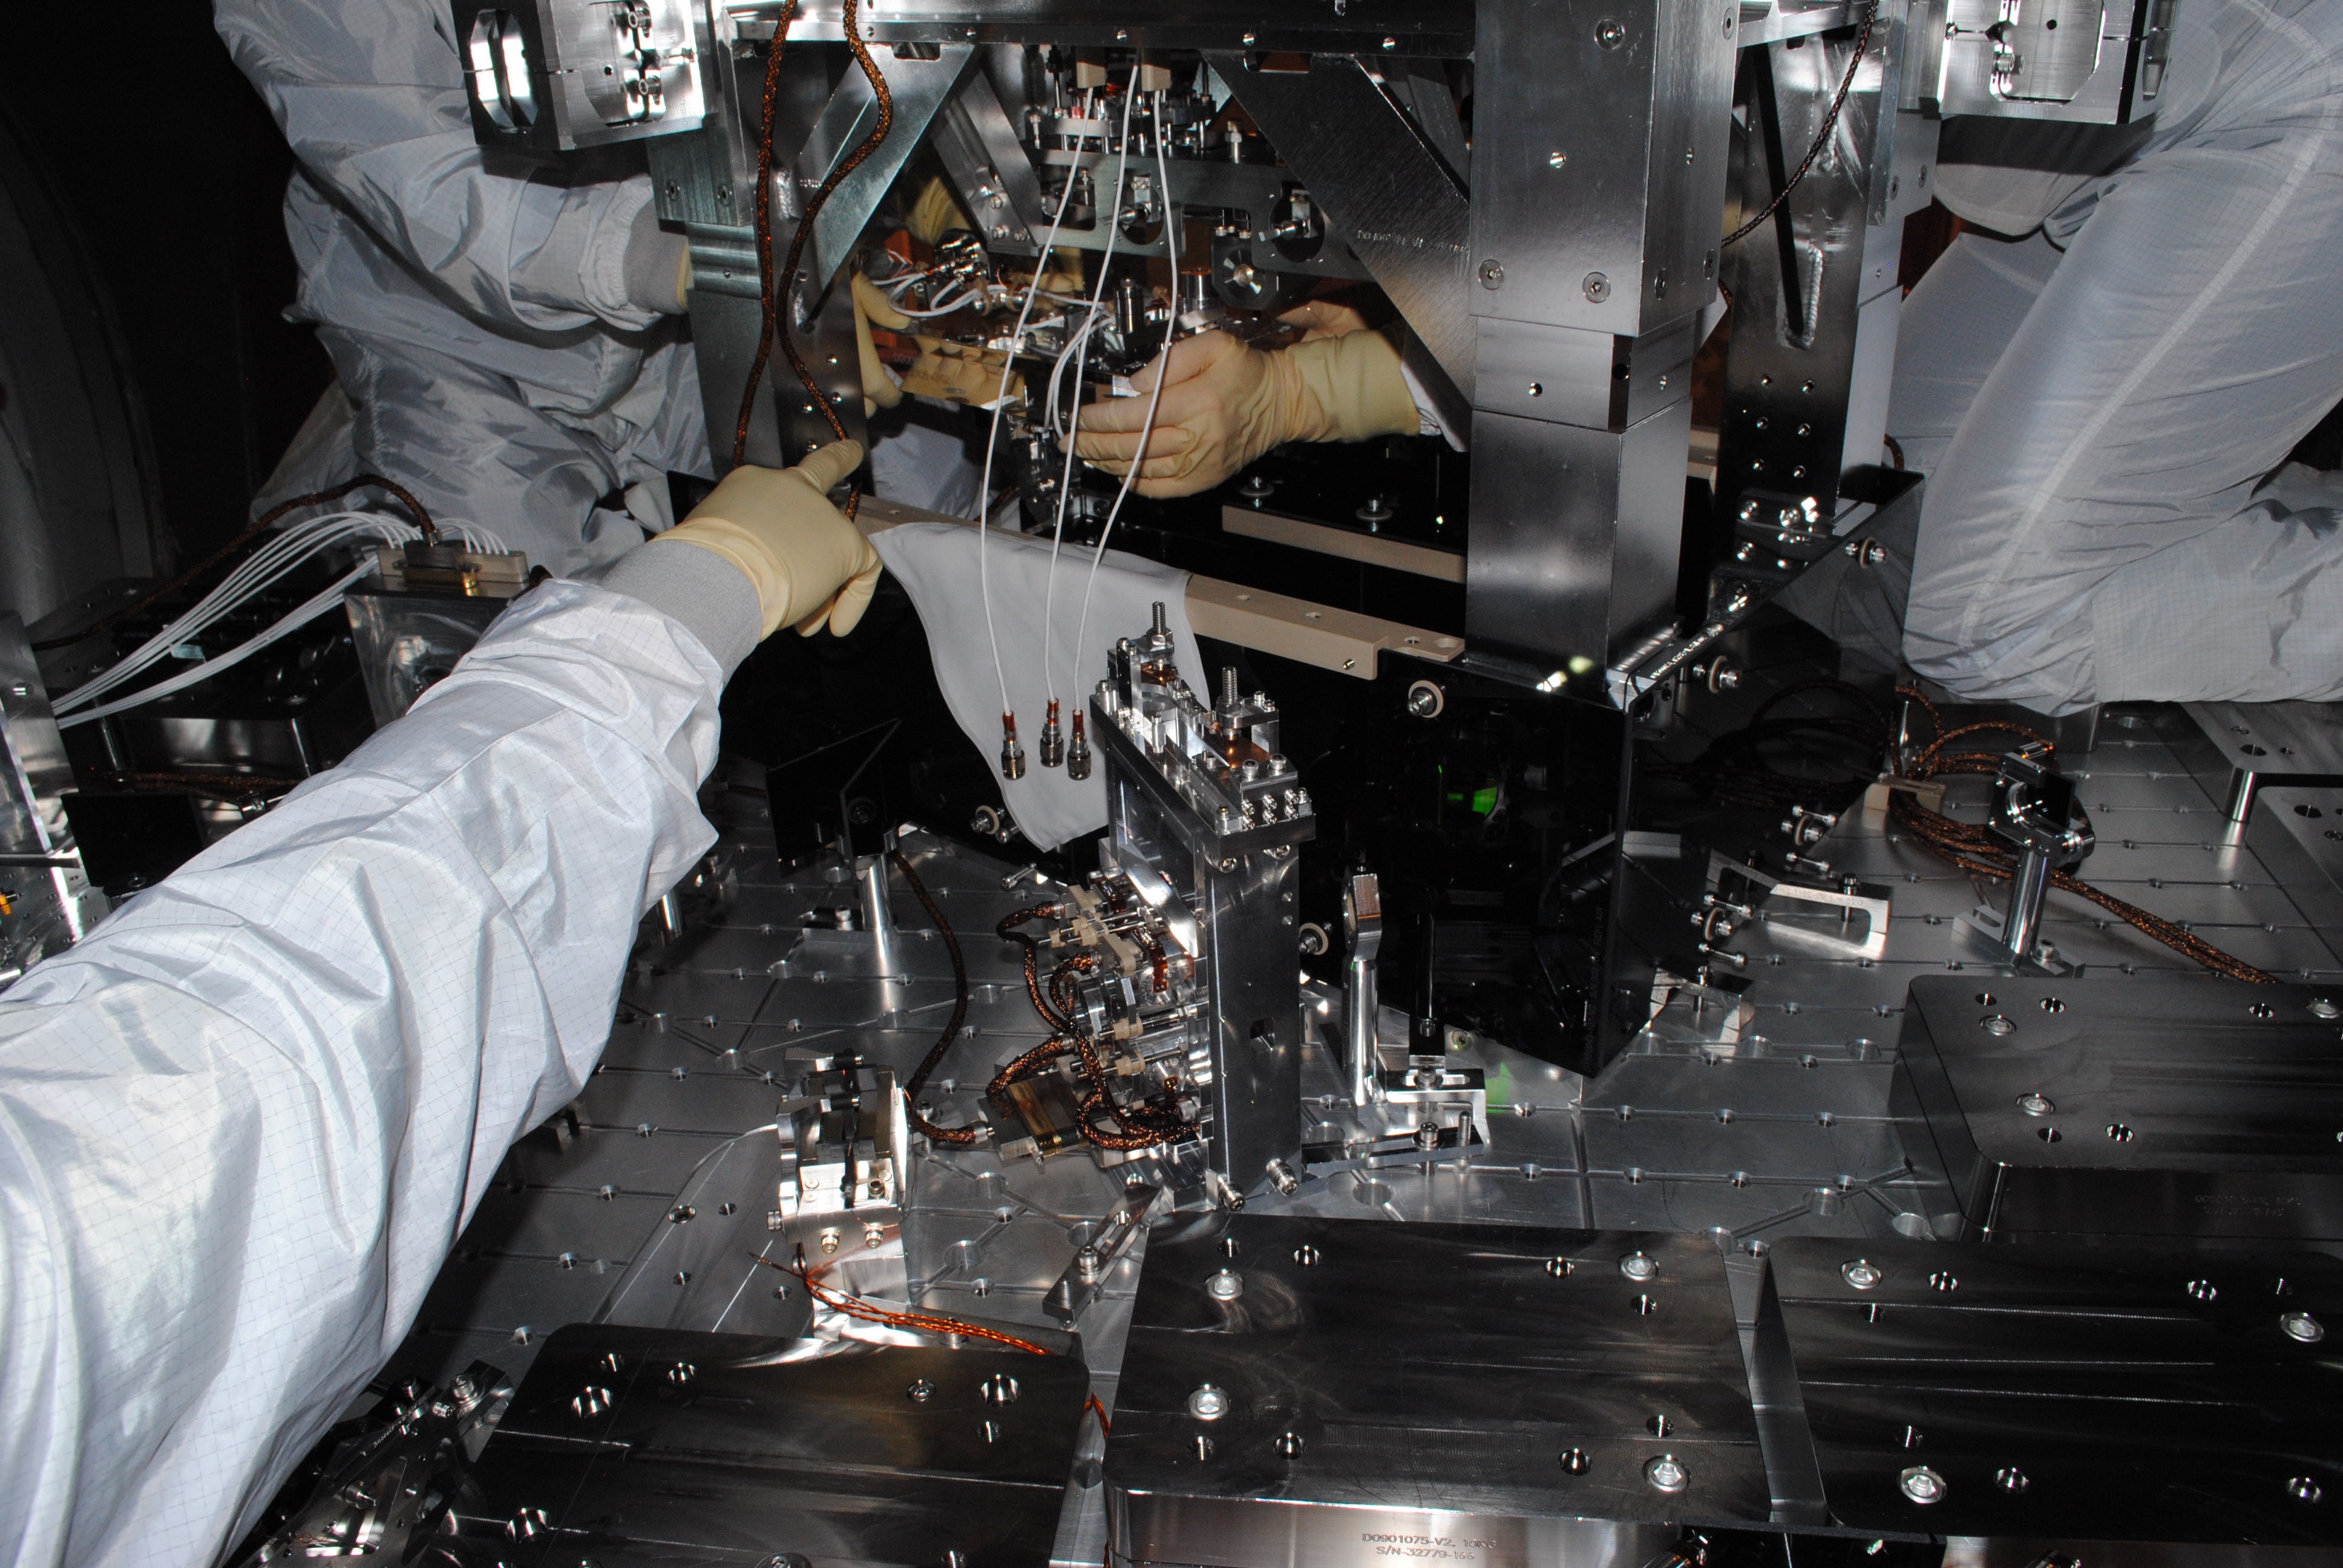
- Then the new OMC was installed on the OMC Suspension.
- The cabling of the OMC was restored.
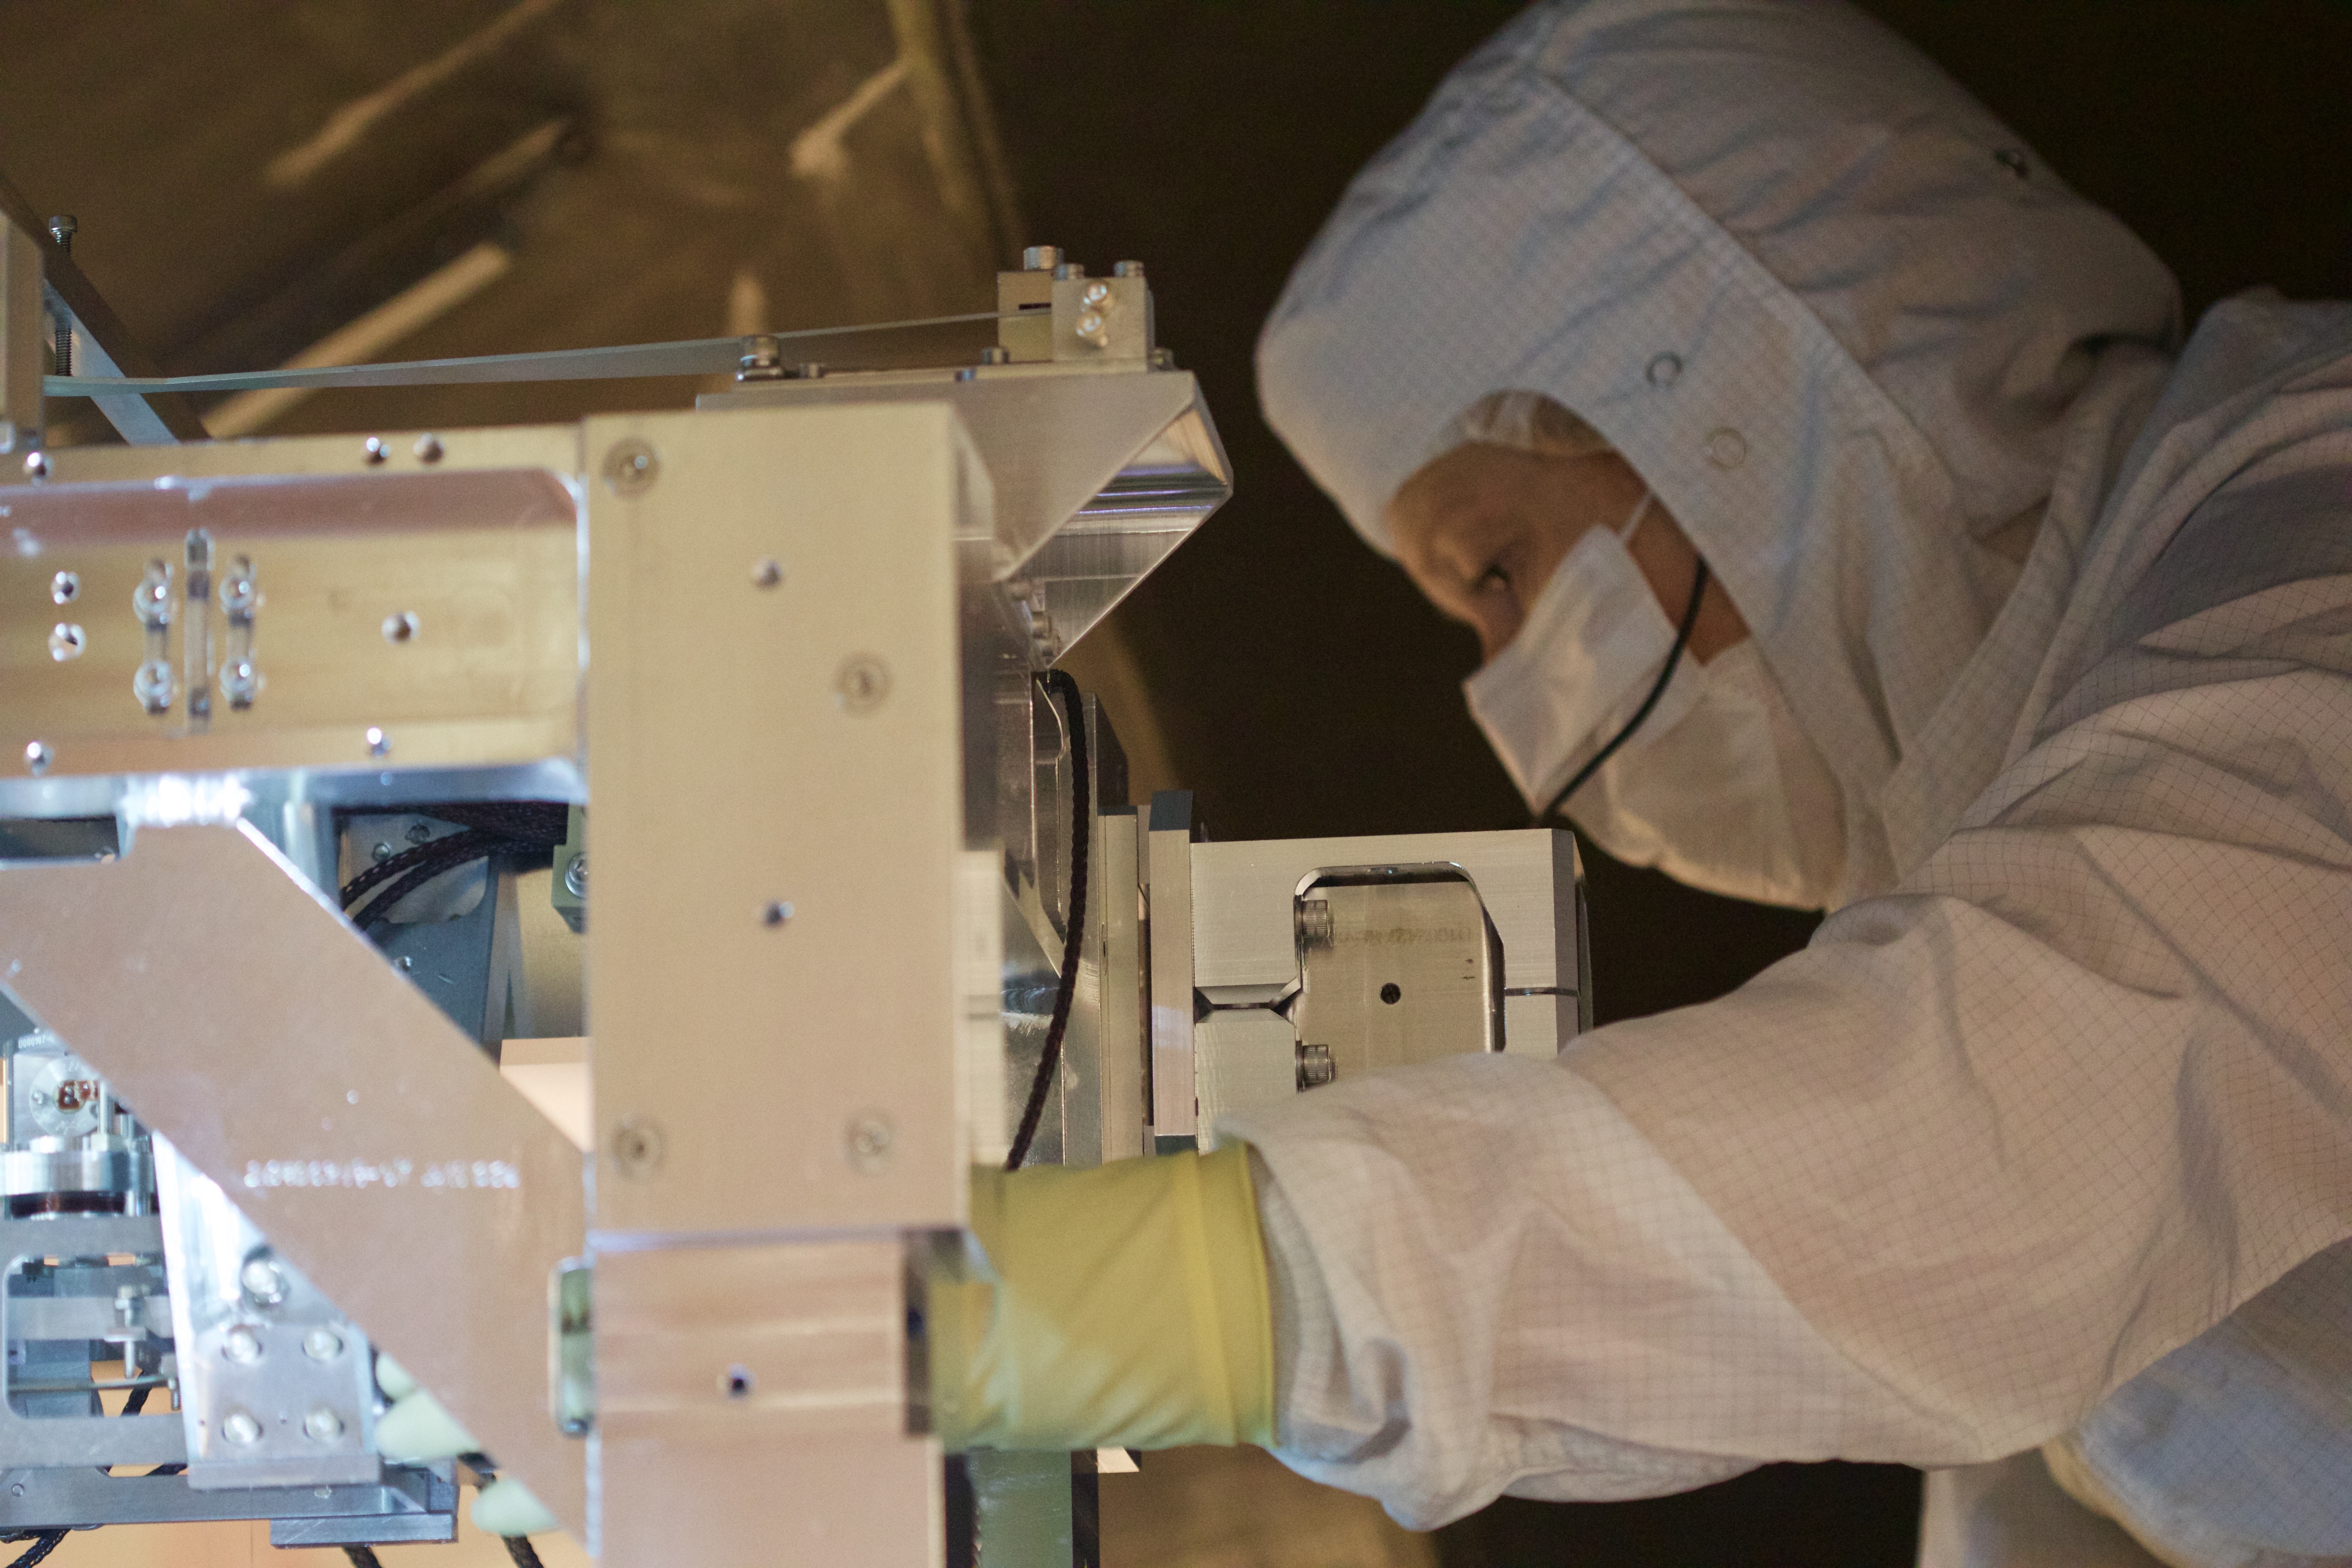
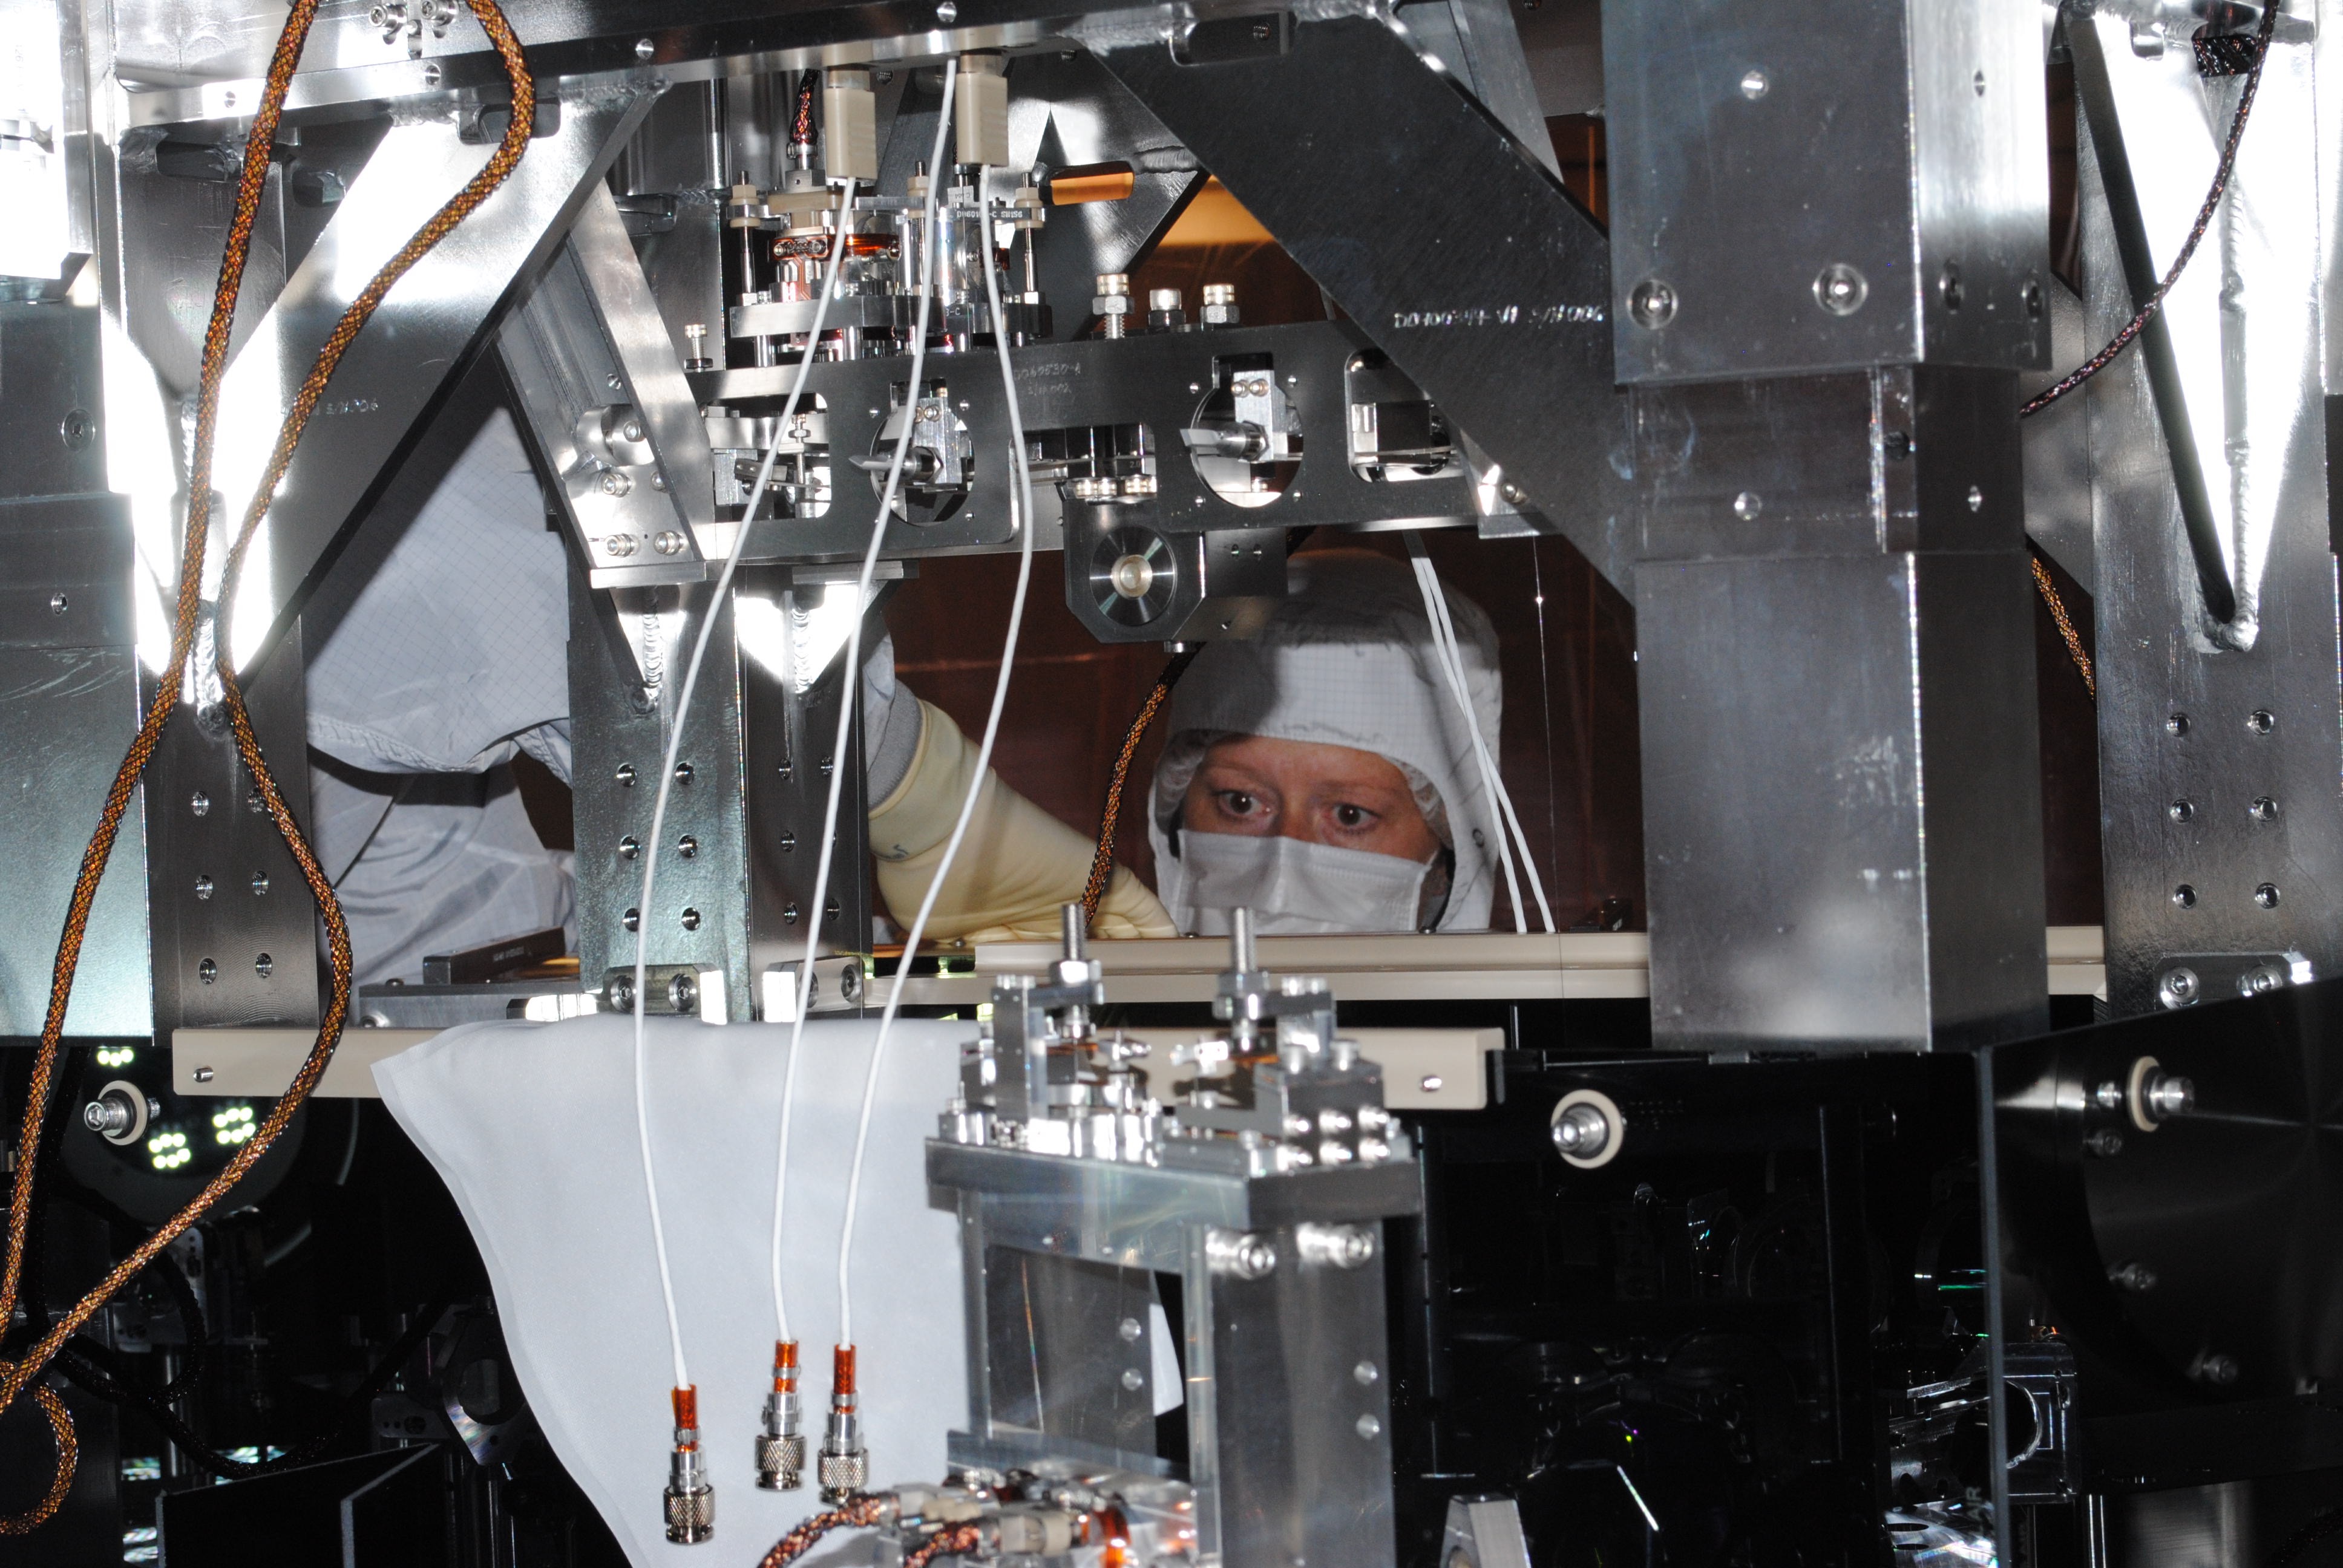
- The locks of the suspension masses and the blades were released. Now the OMC Breadboad is freely suspended.
- The balance of the OMC breadboard was reviewed. One of the corner is about 1mm too high. As we already adjusted the total weight, this should be done by moving the ballast mass on the breadboard.