14:00 Peter into PSL enclosure
14:30 Bubba/Chris breaking down N Bay portable LASER enclosure
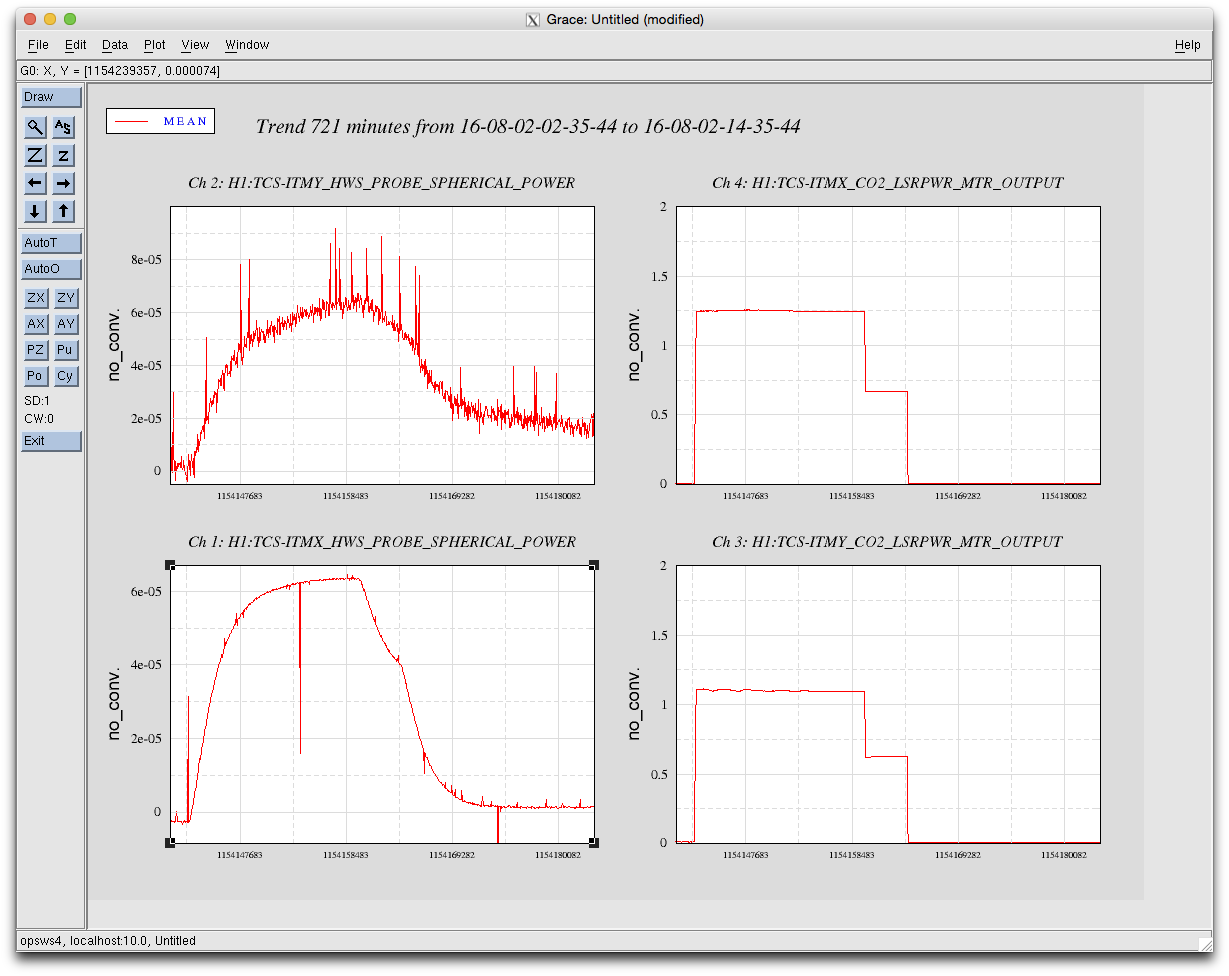
14:40 Vern turned off TCS x/y LASERS from software ad interlock
14:54 Jeff B into LVEA or vent prep
15:04 Kyle out to close GV 5 & 7 WP#6030
15:09 Dale and Dave S with tour into LVEA
15:12 Vern out
15:14 TJ into LVEA to assist Jeff
15:19 TJ out for now
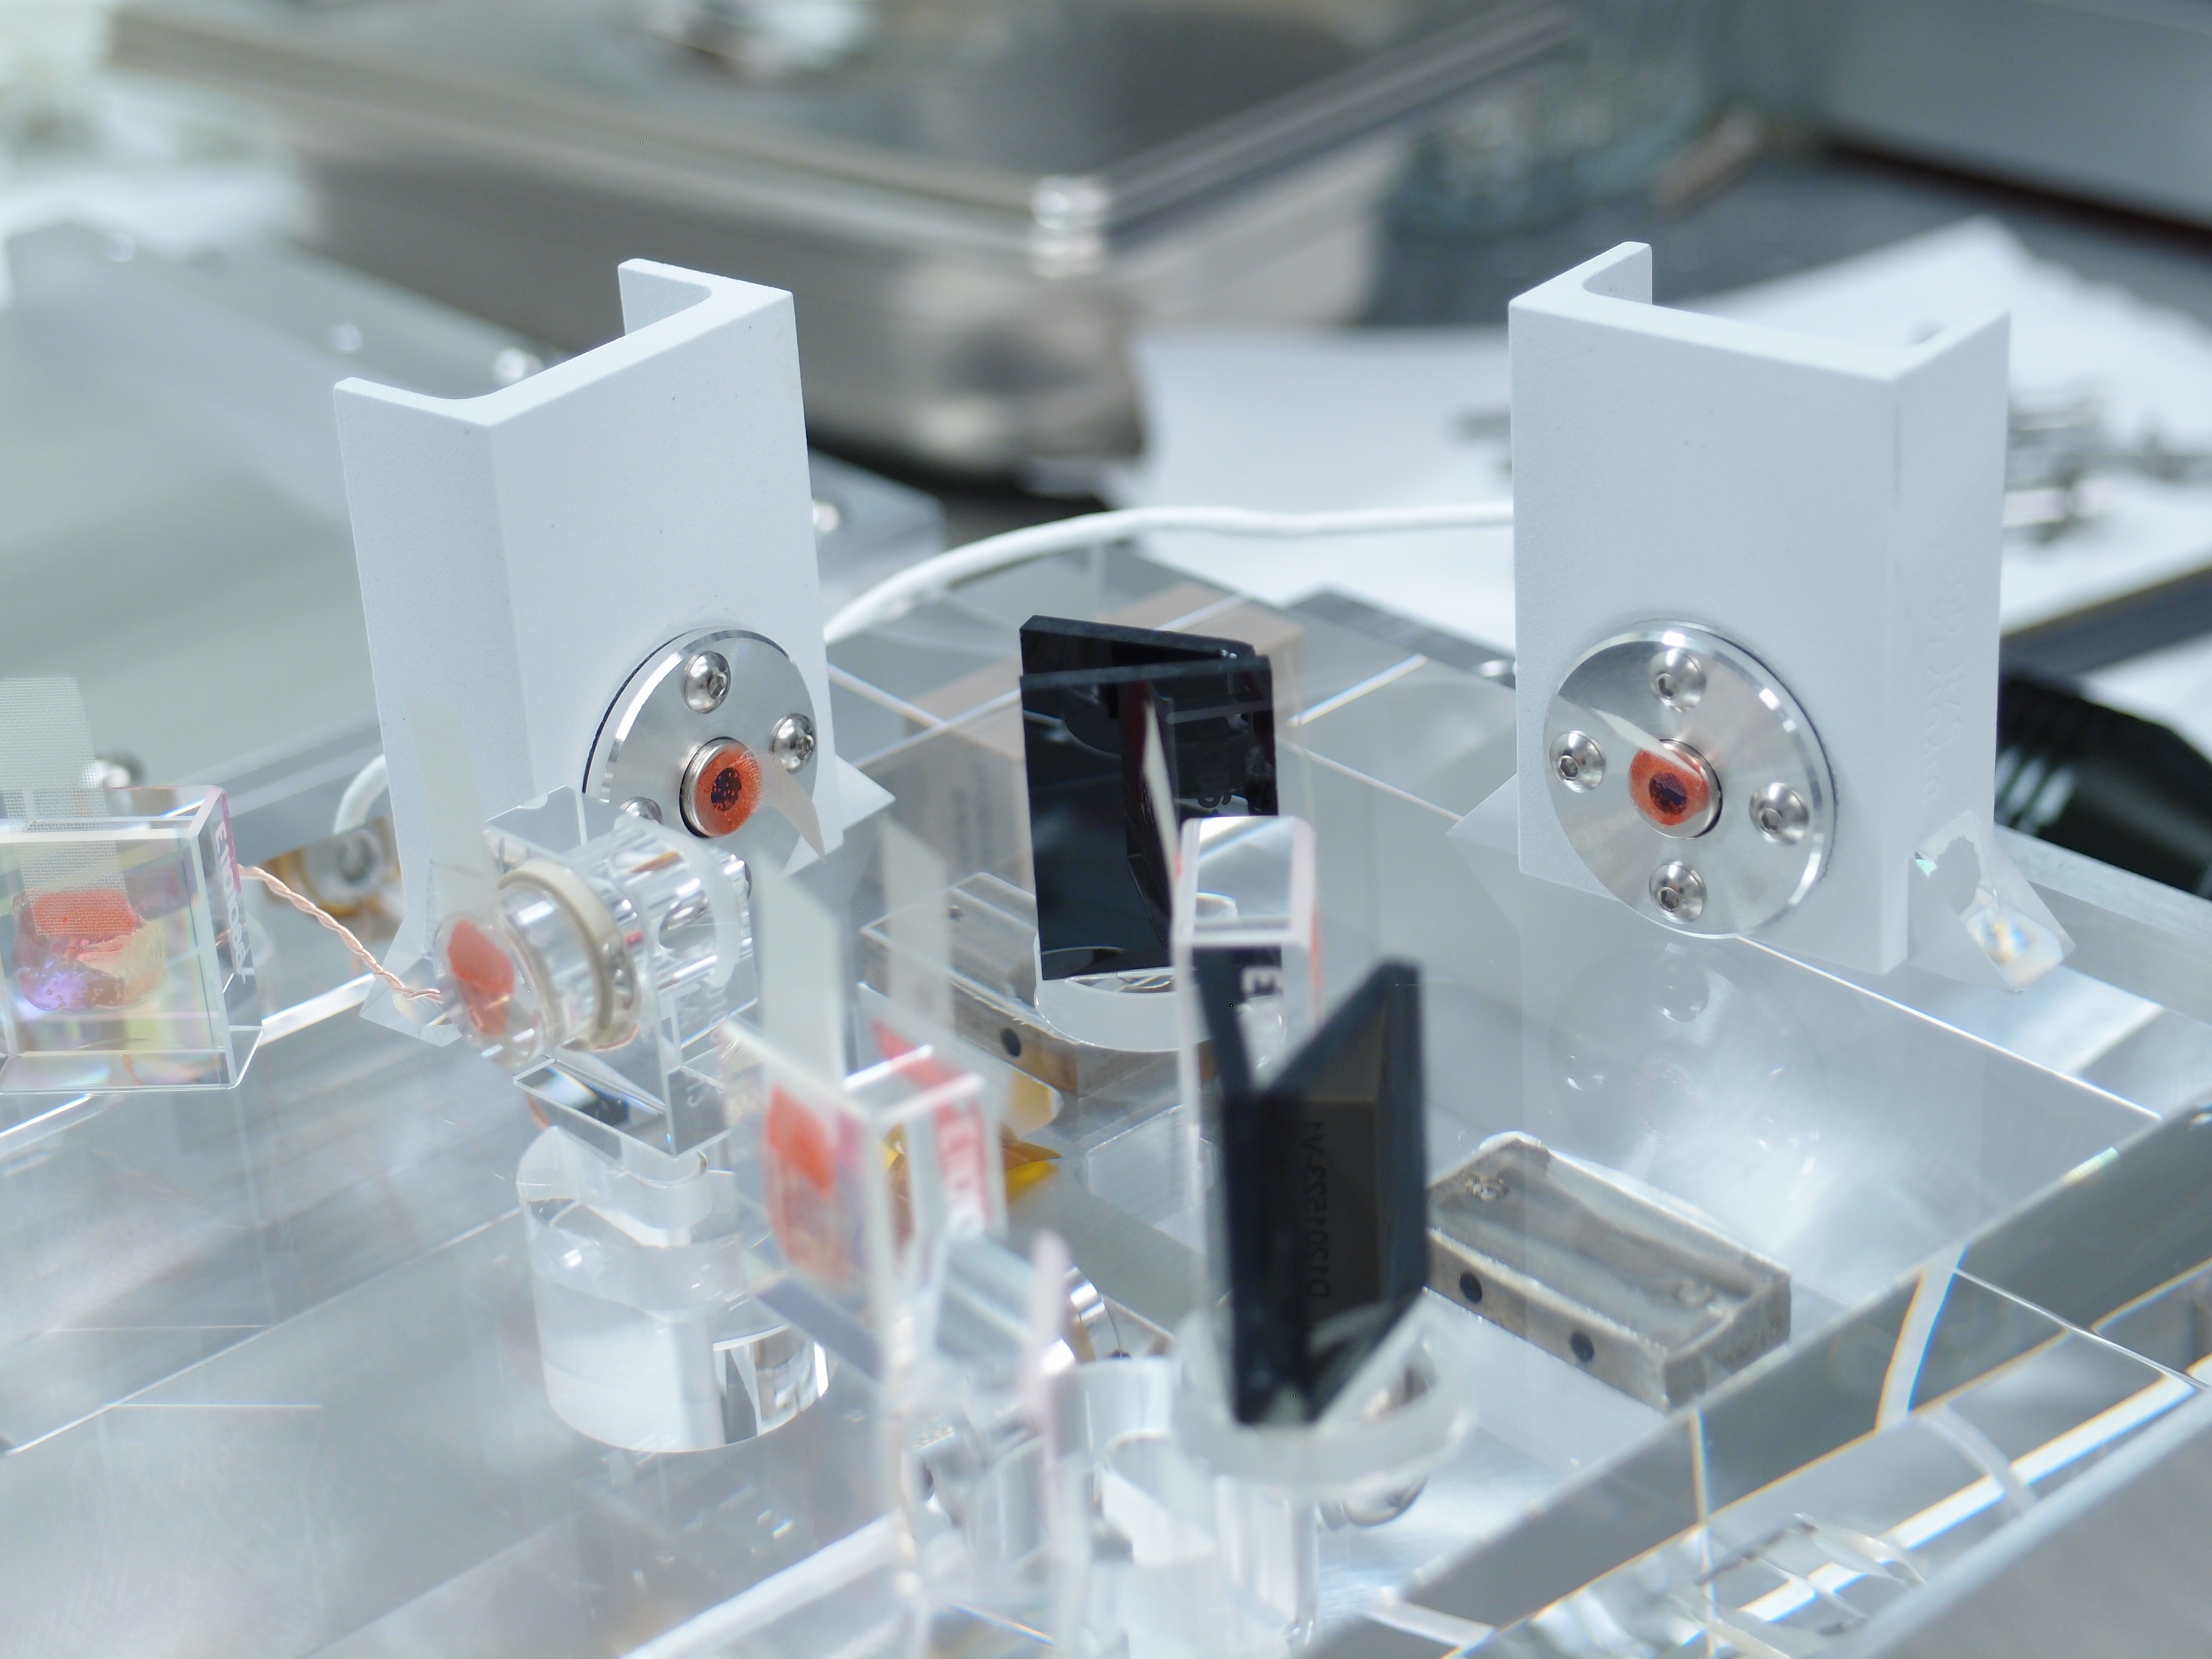
15:23 Fil and co. out to LVEA. ITM HV supplies being turned off WP# 6034
15:29 Jeff out
15:30 Joe D taking pest control through LVEA. They will also be visiting each door on both arms reporting back to CR by 12:00
15:32 water delivery
15:37 Cintas on site for mats
15:42 Robert in with his tour. WP# 6036
15:45 Jason into PSL enclosure
16:05 Jeff back out to HAM6
16:17 Krishna, Jim ad Mike out to EY - BRS
16:35 Joe back from LVEA with pest guys
16:46 Vern taking tour from Beijin into LVEA (will file late permit)
16:58 2nd LN2 delivery on site
16:59 portable toilet crew on site
17:04 Dave/Jim entering EY - WP# 6035
17:16 Beijing tour out of LVEA
17:25 Betsy out to HAM6
17:32 Jim,, Krishna and Mike back from EY
17:34 Castle Catering on site
17:37 Krishna and Mike into Biergarten
17:45 Mitchell out to LVEA- HAM6 assist
17:58 Richard out to end stations to replace hotspots
18:12 PSL team out
18:18 Dave and Jim back from EY
18:24 Hugh out to HAM6
18:29 Richard back
18:36 Dave and Jim back to EY for one more test
18:46 Dave and Jim at EY - goin to take seismic down again
18:57 Keita out to floor to talk to people at HAM6
19:02 Krishna and Michael out of LVEA
19:07 Keita back from LVEA
19:11 Jeff and Rick S taking a tour of the LVEA WP# 6044
19:15 Travis back
19:20 Richard out to the floor
12:42 Pest control guys are done
19:40 DAQ restart
19:47 Jason and Nutsi out to execute WP# 6043
19:48 Travis to EY to turn off illuminator
19:57 Betsy et al in to begin in chamber work on HAM6
20:02 Travis back
20:13 Koji out to HAM6
20:34 Travis into LVEA
20:53 Gerardo and Mark headed out to EY
20:54 Fil headed to Biergarten pulling cables to CER for BRS install - over HAM4
21:21 Nutsinee and Jason out
21:51 Landry out of LVEA tour with outreach candidate
21:52 Gerardo back
21:54 Dave and Jim will be taking down EX FEs
22:09 Dave, Daniel and Jim at EX to re program timing fanouts
22:27 Richard out to LVEA to talk to Fil
22:42 Richard Fil and Alfredo out of the LVEA
22:46 Jenne out to floor to move seismometers that may be in he way of HAM6 doors
22:53 Nutsinee and Jim back from installing anemometer outside at EX
23:02 Jim back down to EX to take pictures and watch things
23:06 Dave and Jim back from EX