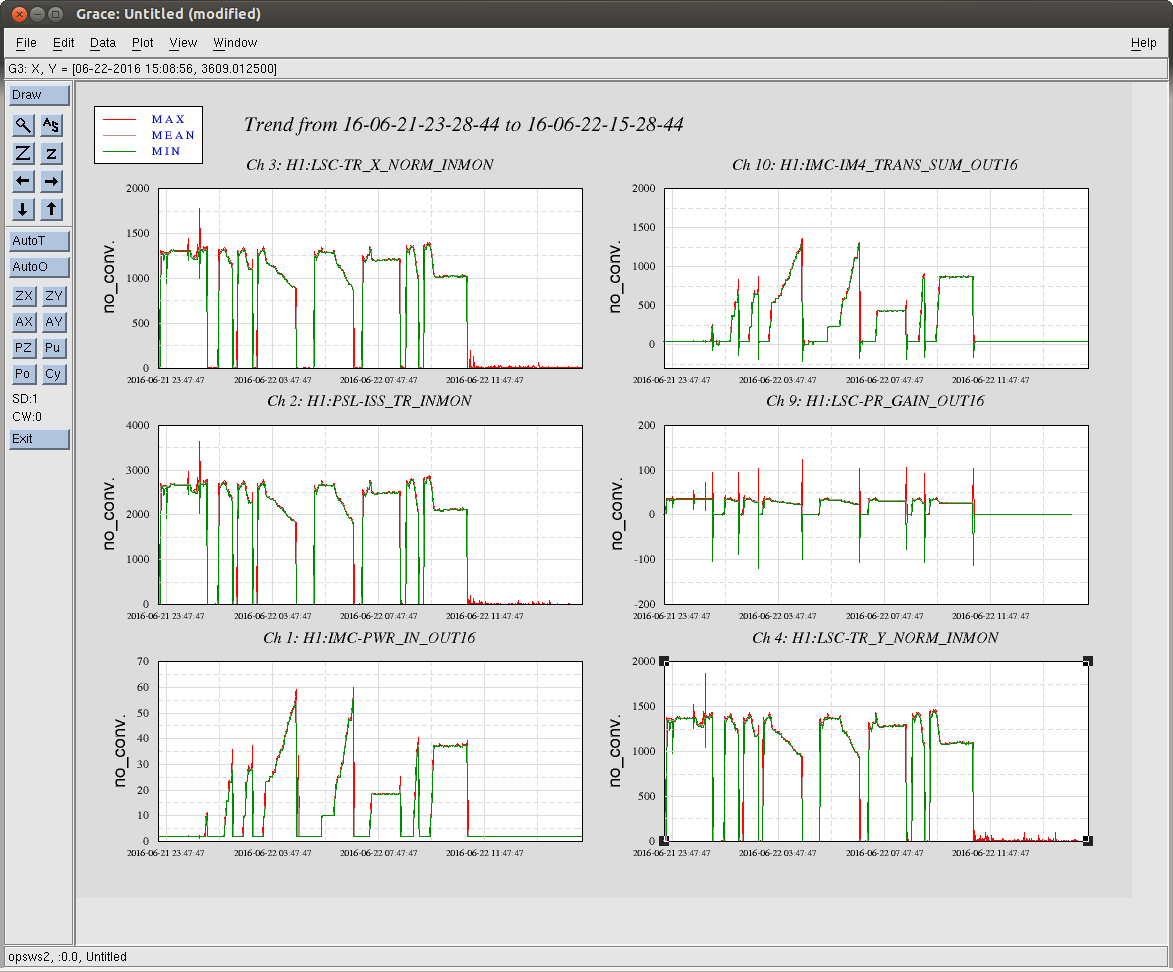
Untimately we need to engate the 2nd and the 3rd ISS loop at the same time. Toward this goal, I first tried to engage the 2nd loop but without the 3rd loop, and measure the 3rd loop open loop transfer function while the 3rd loop was open, but the IFO didn't cooperate at 20W today.
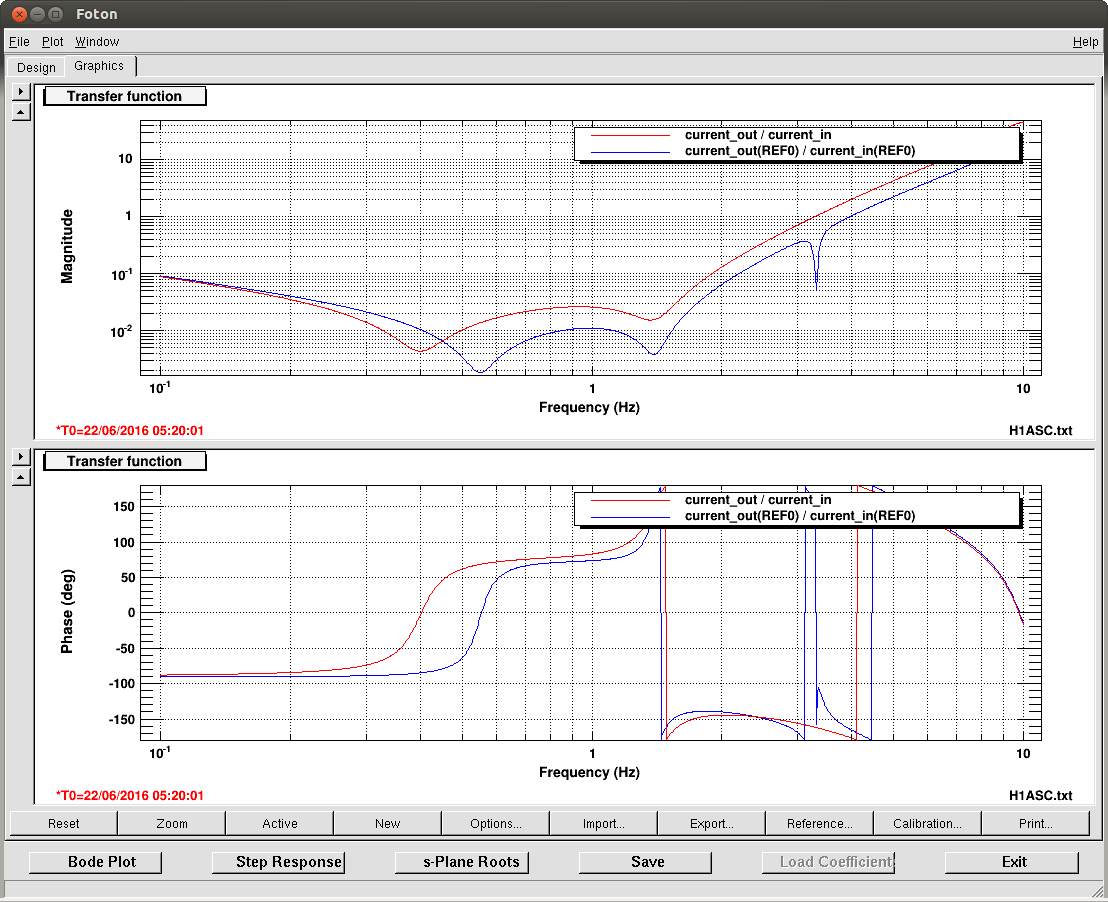
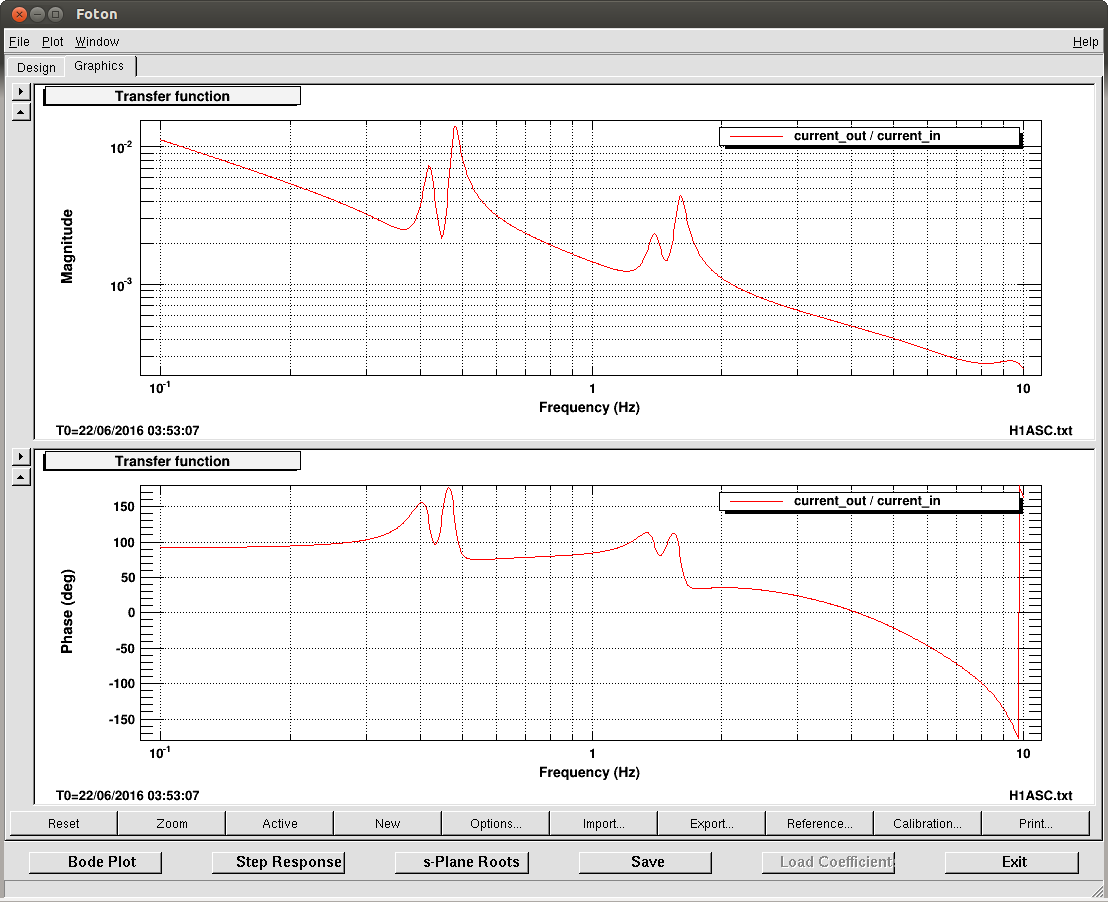
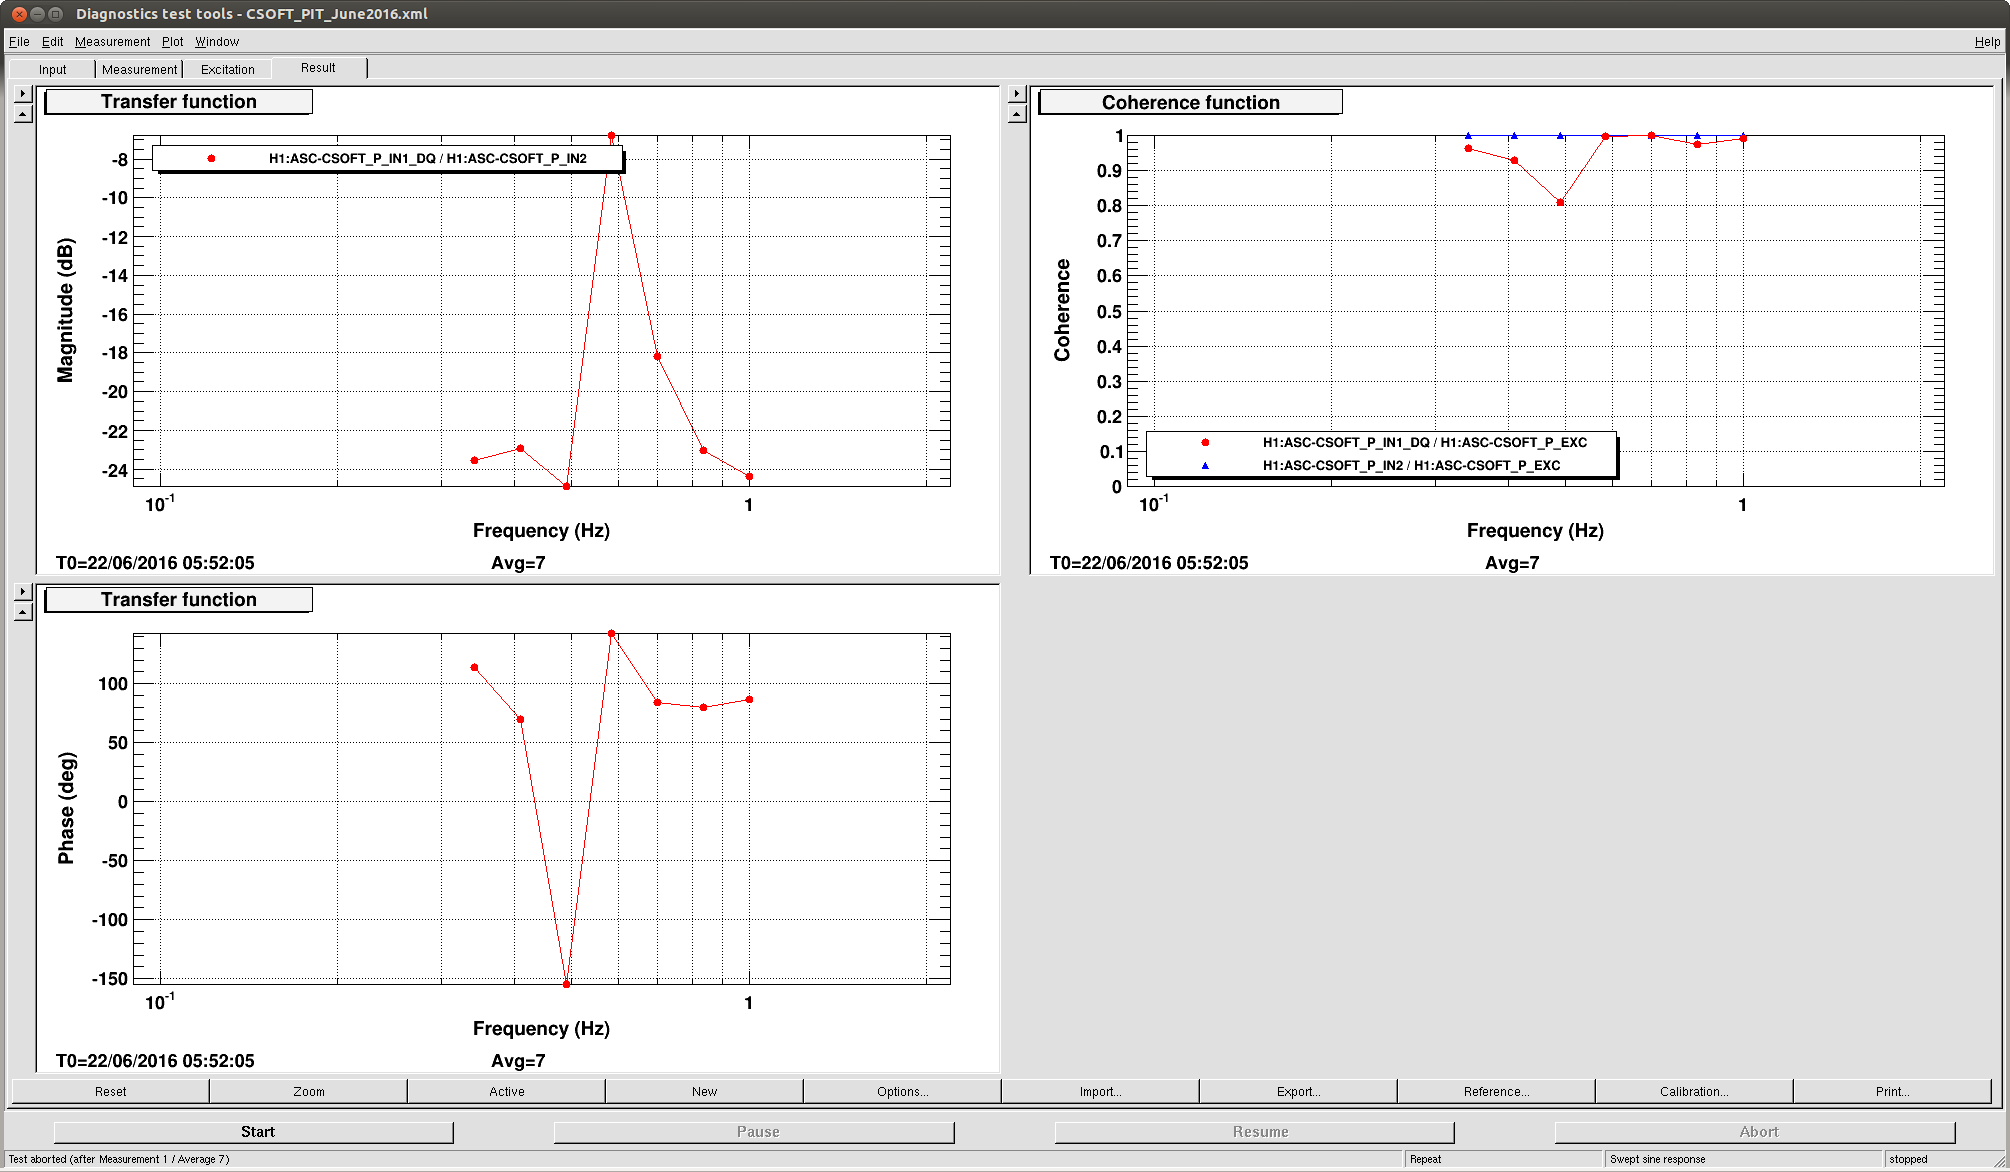
I instead measured the 1st loop and the second loop sensing by injecting into the 1st loop error point via the second loop board while the input side of the 2nd and the 3rd loop were both open. I measured between 6Hz and 0.4Hz, and it was mostly flat as it should be. At 2W, the ratio of the second loop sensing to that of the 1st loop sensing was:
Sens2(2W)/Sens1 = -0.4.
At P Watts, this will become -0.2*P.
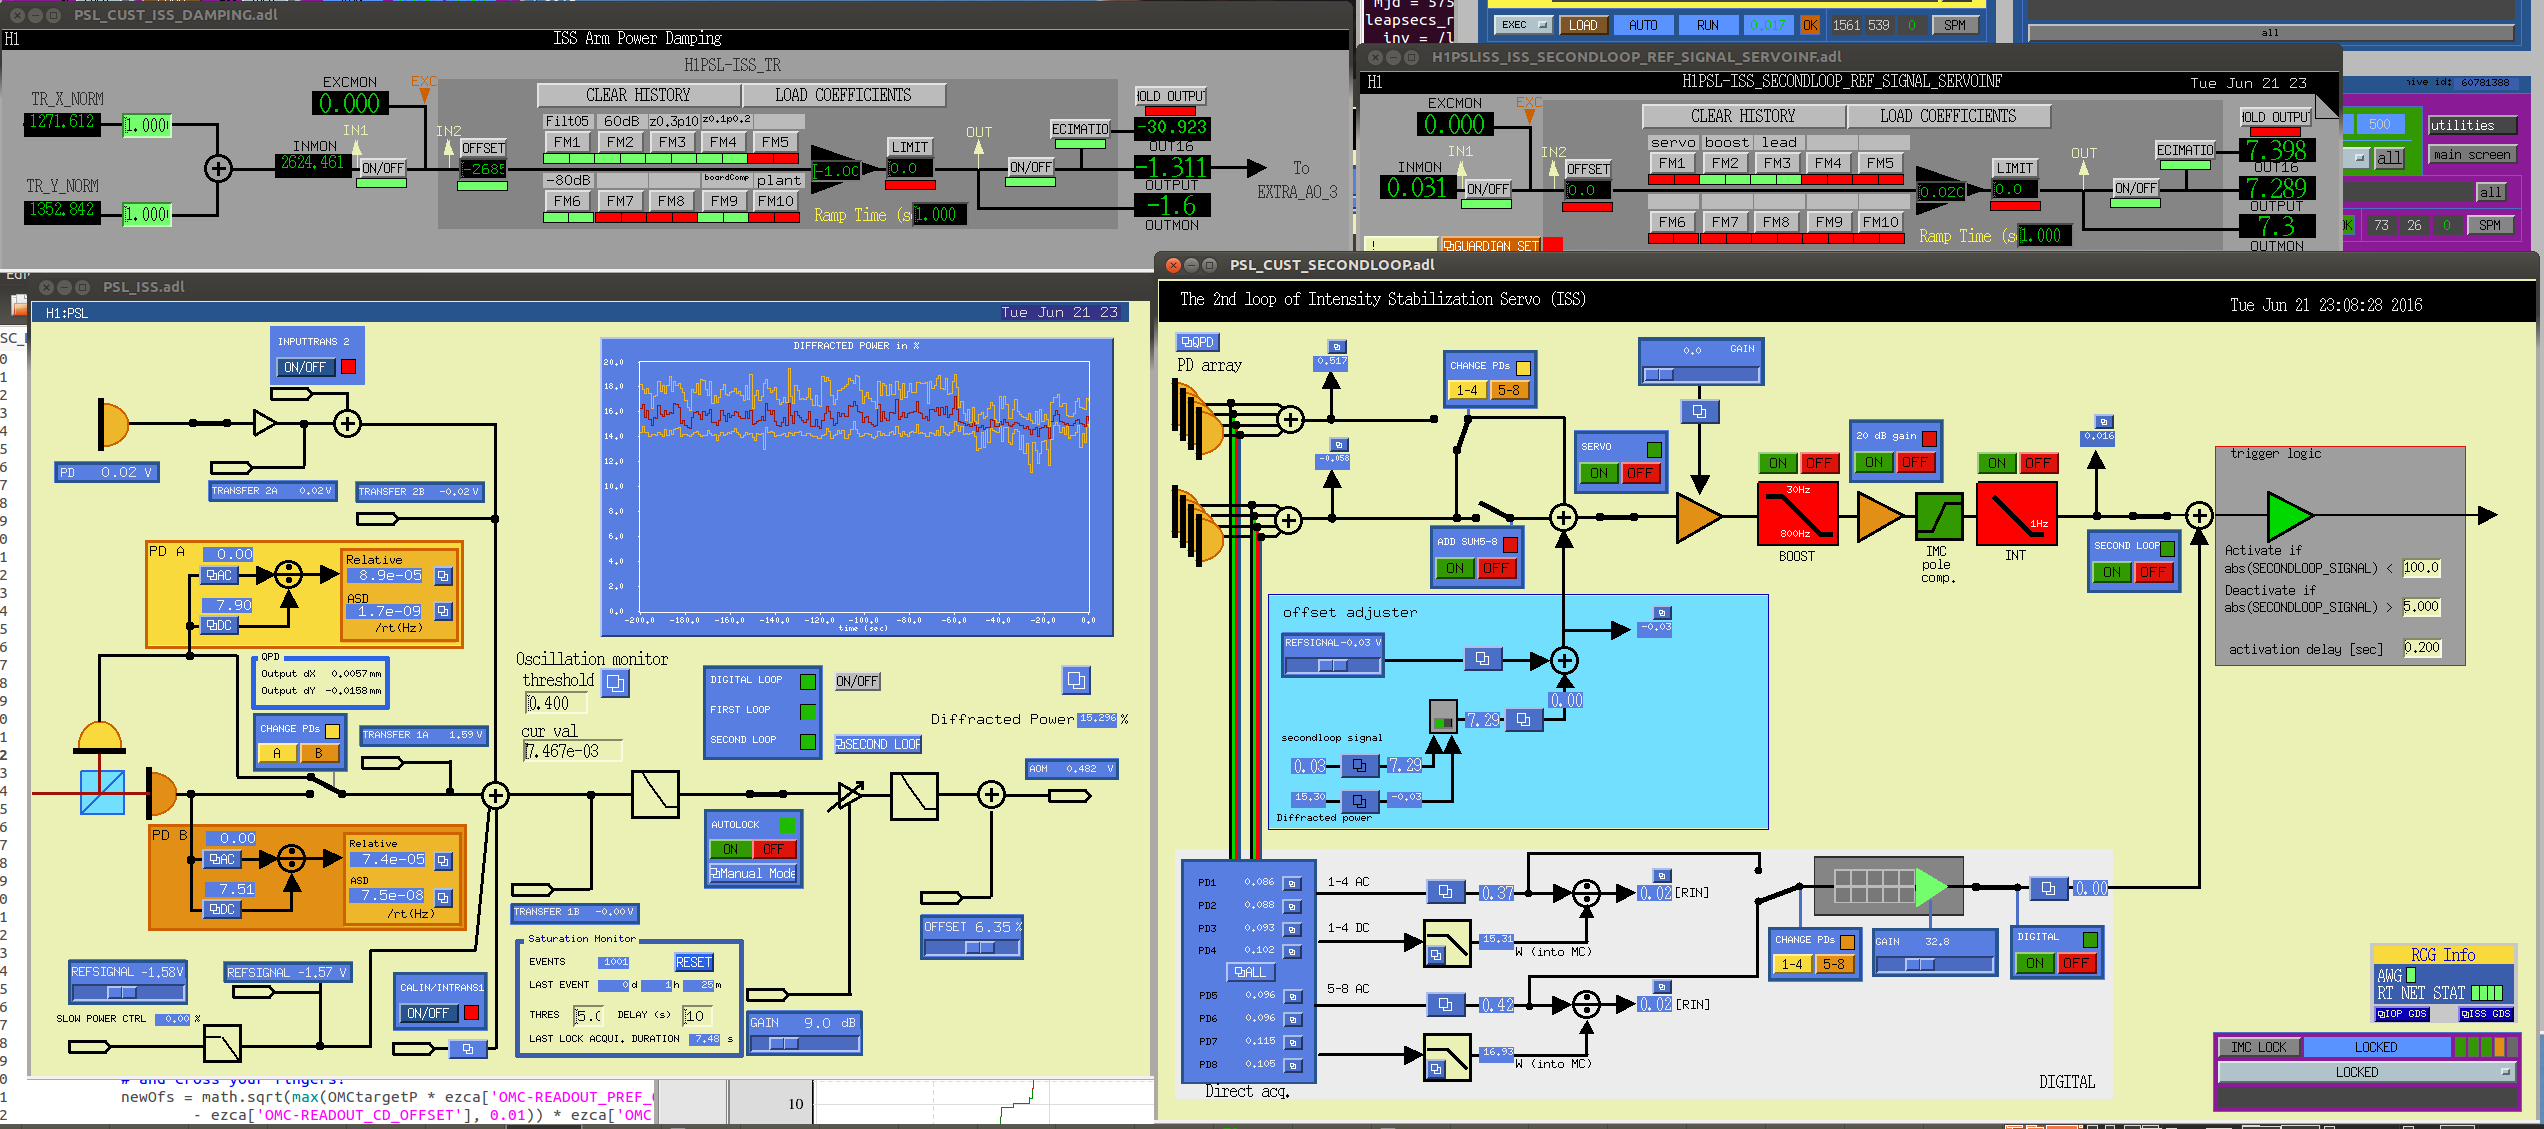
Let's say that the 2nd loop works at 25 Watts with the same setting as in O1. And we already know that the 3rd loop (without 2nd loop) works with the 3rd loop filter gain of -1. A good starting point would be to engage the 2nd loop at 25 Watts without the 3rd loop, disable FM9 (boardComp) of the 3rd loop filter, set the gain to -1*(-0.2*25) = 5 and engage the 3rd loop.
The 3rd loop digital gain needs to be changed as the power goes up because the sensing for the second loop is not normalized by power. The analog gain control slider is downstream of the 3rd loop summation point and cannot be used as a poor man's power scaling for the sensing.


Strictly speaking, Sens2/Sens1 is not flat at very low frequency beucase of the analog "whitening" difference. If this causes problem at the lower UGF, try adding zpk([7mHz], [71mHz], 1) in the 3rd loop digital filter.
PSL ISS PDs all have some built-in whitening. The "error point" we're talking about is downstream of the whitening, and therefore both Sens2 and Sens1 include the whitening. It's confusing to explain this in words, so just look at the simplified diagram attached. Except that each of the 2nd loop pds have its own whitening in reality (rather than whitened after added together), this is a reasonable diagram.
Anyway, the whitening for 2nd loop array is
z, p = [7e-3; 71e-3], [3.1; 3.2; 117; 2.46k]
according to D1300639, while the whitening for the 1st loop is
z, p = [72e-3; 72e-3; 2.6k], [3.4; 3.4; 130; 2.3k]
or something like that (see D1001998).
(This also means that the TF from injection point to the intensity noise is inversely proportional to the whitening.)
I forgot to take into account the board DC gain of 350 when injecting into the 1st loop.
This means that, with 25W, the gain should be 5*350=1750 instead of 5.