Michael, Krishna
In this post, I'll try to summarize the work accomplished on the BRS-Y (2) and BRS-X (1) over the last few weeks.
1) BRS-Y:
The instrument including the box in the VEA and the Beckhoff computer/modules were installed (26242, 26265, 26276) . The tilt transfer function was measured and we then adjusted the center of mass to minmize 'd'. We then remeasured the transfer function to confirm that d was indeed small. This isn't particularly necessary for the goal of tilt-subtraction but does allow us to study the tilt from surface waves during an earthquake.
Tilt-subtraction for the ground seismometer has been shown to be very effective under 20-30 mph winds at both EY and EX in the 10 mHz to 1 Hz band. We have shown some modest improvements to ISI motion using sensor correction in the 'along-the-beam' direction in the 0.1-1 Hz band (as seen be ST1 T240) without any increase to the total rms motion (as measured by the CPS). Both of these are local sensors and it would be interesting to test these configurations with the interferometer. There are also likely other ways to use the BRS signals which may prove more beneficial.
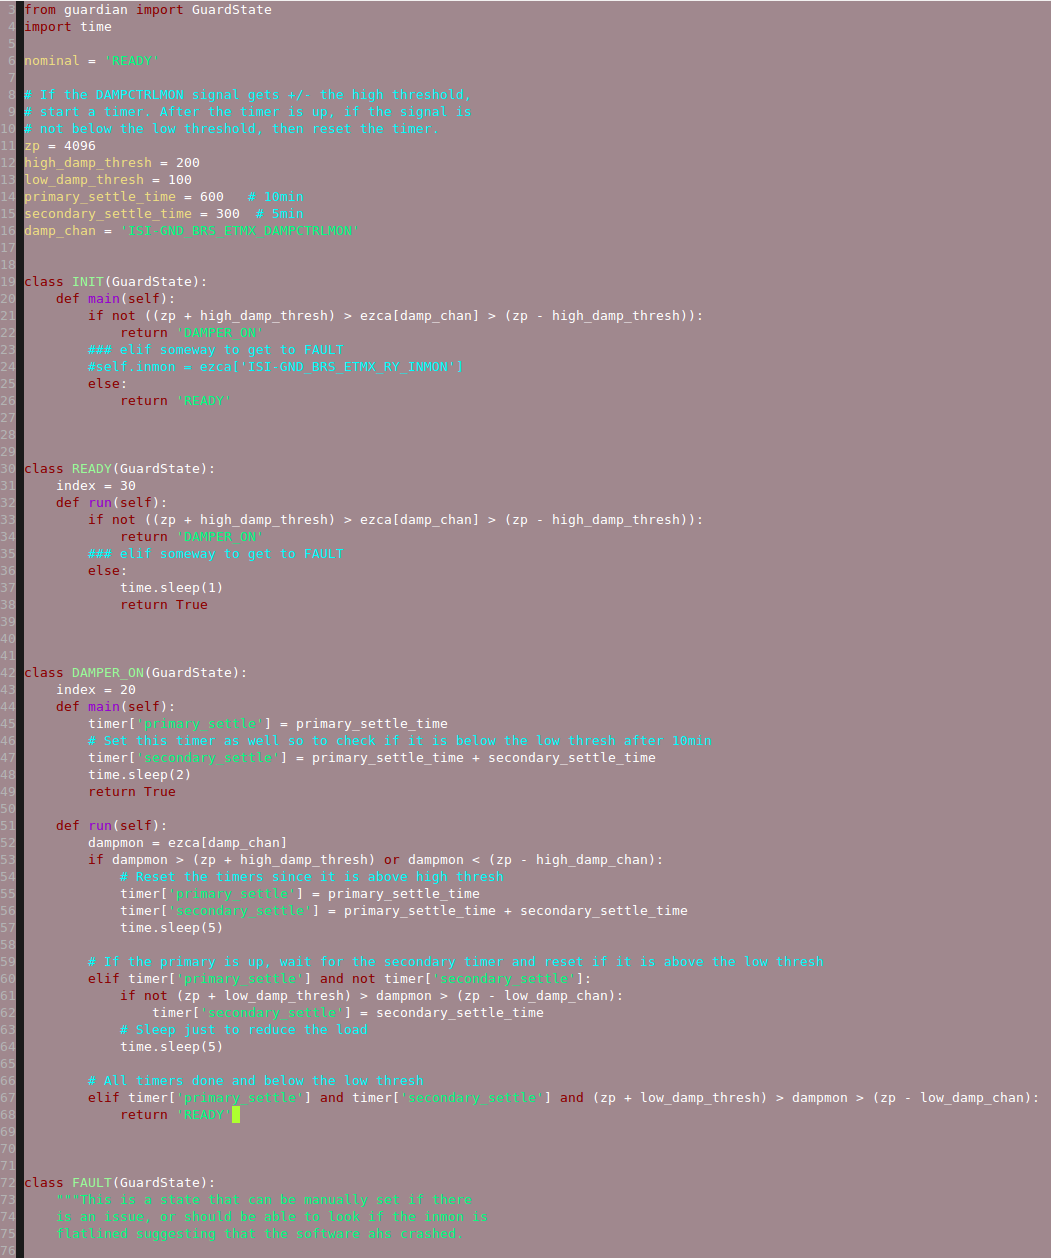
The C# and the Beckhoff PLC code for BRS-Y have been uploaded to svn under slowcontrols. This system is more robust than the one at EX and allows for greater CDS integration and control. Several of the BRS parameters (such as damping on/off, damping thresholds) can be controlled through EPICS commands. For example, typing " caput H1:ISI-GND_BRS_ETMY_USER 0" disables damping and " caput H1:ISI-GND_BRS_ETMY_USER 1" enables it.
We just discovered today that one of the two capacitive actuators was shorted internally and cannot be used. The damping is thus asymmetric and less strong. There are also other minor issues with it but it still meets its main goal of keeping the amplitude small.
The vcauum system is working well. The ion pump current is ~25 microamps, corresponding to a pressure of ~1.5 X 10^(-7) torr. The corresponding current for BRS-X is 14 microamps after ~two years.
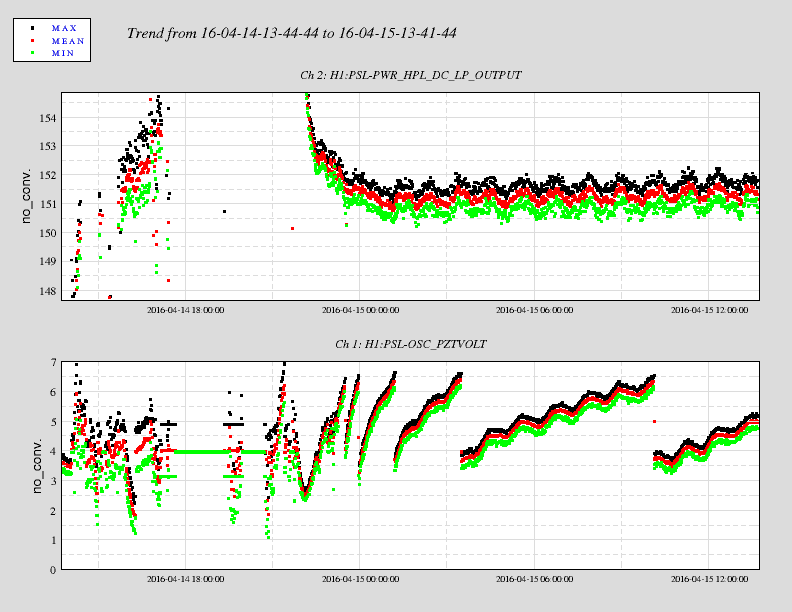
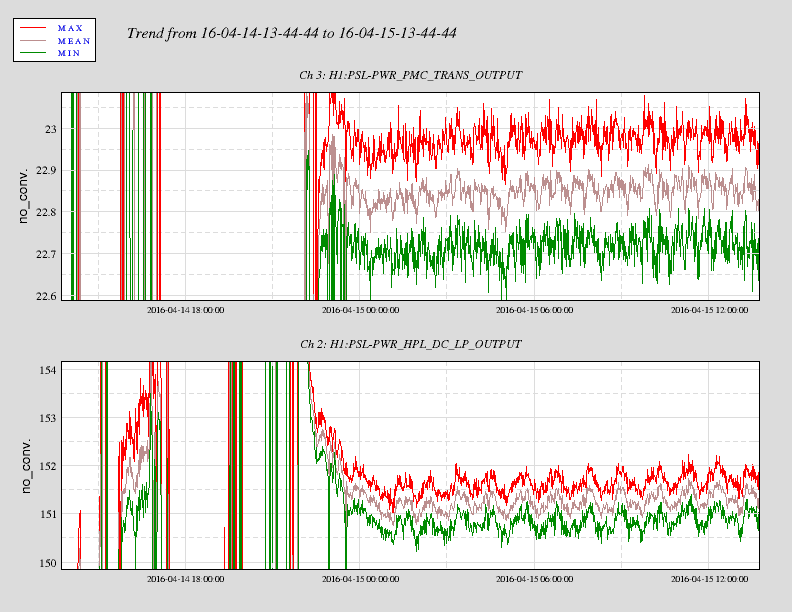
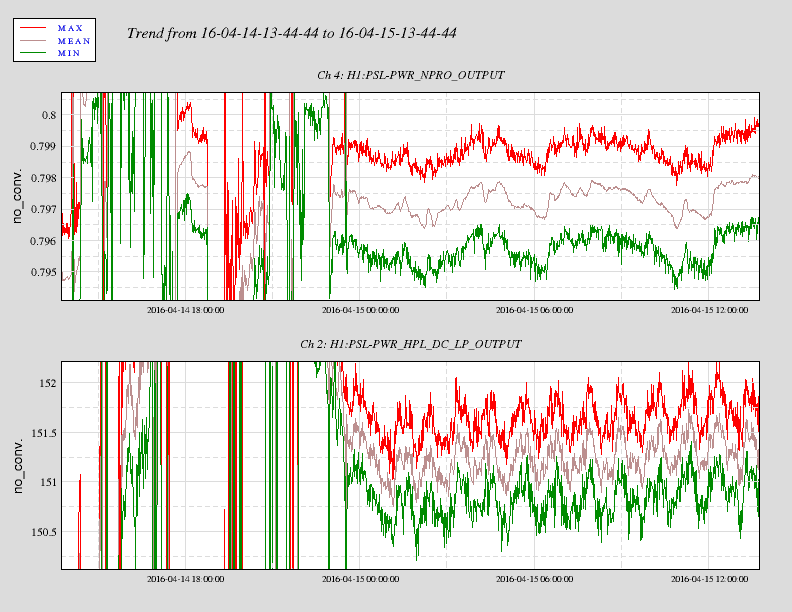
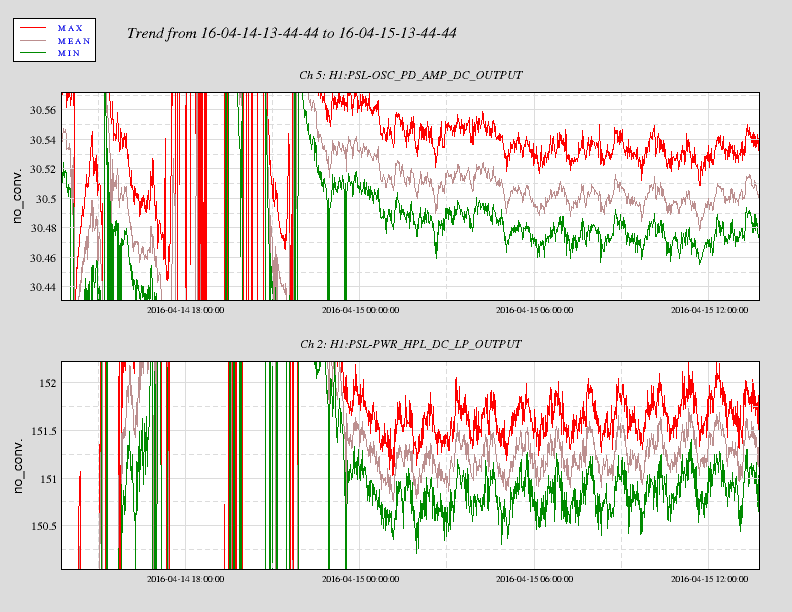
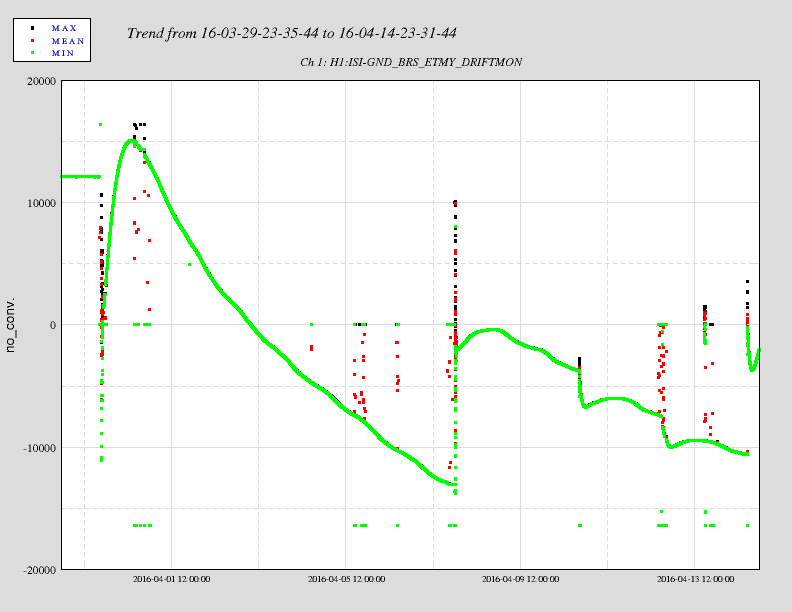
The DC position of the beam-balance has been slowly settling with a very long time constant (~10 days). The attached plot shows the DRIFTMON channel over the last 16 days. The two main spikes followed by DC shifts were caused by us changing the DC position using a small moveable rod on the beam-balance. Based on the trend we expect it to drift down and then approach an equlirbrium value within the range of the autocollimator (+/-16k counts on the Y-axis).
2) BRS-X:
BRS-X was restarted from hibernation and works well for the most part.
The startup procedure for the code has been simplified. There are now two shortcuts on the BRS-X laptop's desktop screen - the one labelled "Damping ON" runs the software with damping enabled (DC subtraction is automated) and the other one runs with damping diabled and 2.5 V for the DAMP_CTRL channel, which can be used to reset the damper, if needed. A recurring problem with it is the damper turn-table vibrations causing the beam-balance to ring up. A new Beckhoff computer/modules and a GigE camera have been/will be ordered for it and we will develop a new smoother turn-table which will address these problems.