jeffrey.bartlett@LIGO.ORG - posted 08:57, Monday 09 May 2016 (27067)
08:30 Meeting Minutes
Work plans for next couple of days:
SEI: Jim - running TFs at End Stations
Cheryl – Running TFs on IM during evening shift
SUS: Jeff K. - Working on SUS model changes
ELE: Running cables for access system in the LVEA
Cleaning up cables at both End Stations
VAC: Running E-Net cables for new gauges in LVEA and both End Stations
Continuing to bake out RGA in Vertex
FAC: Beam tube sealing continues
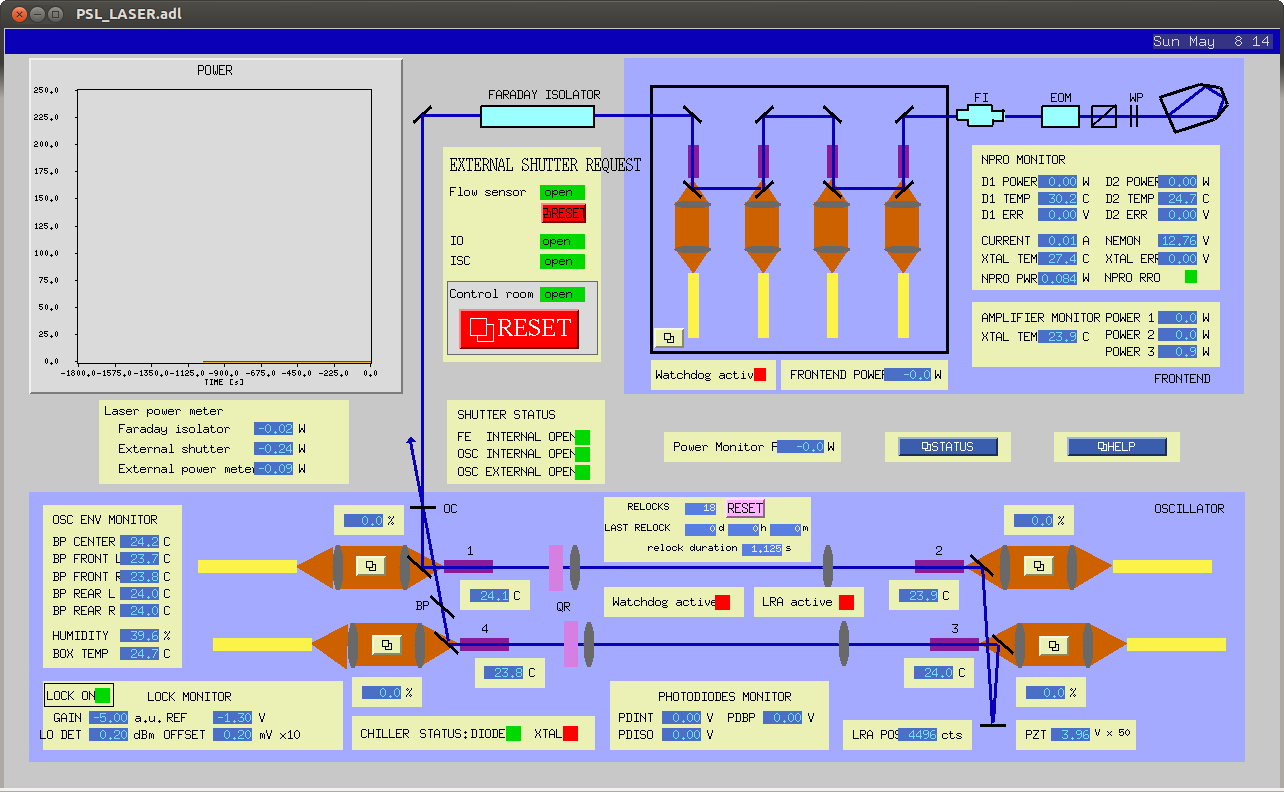
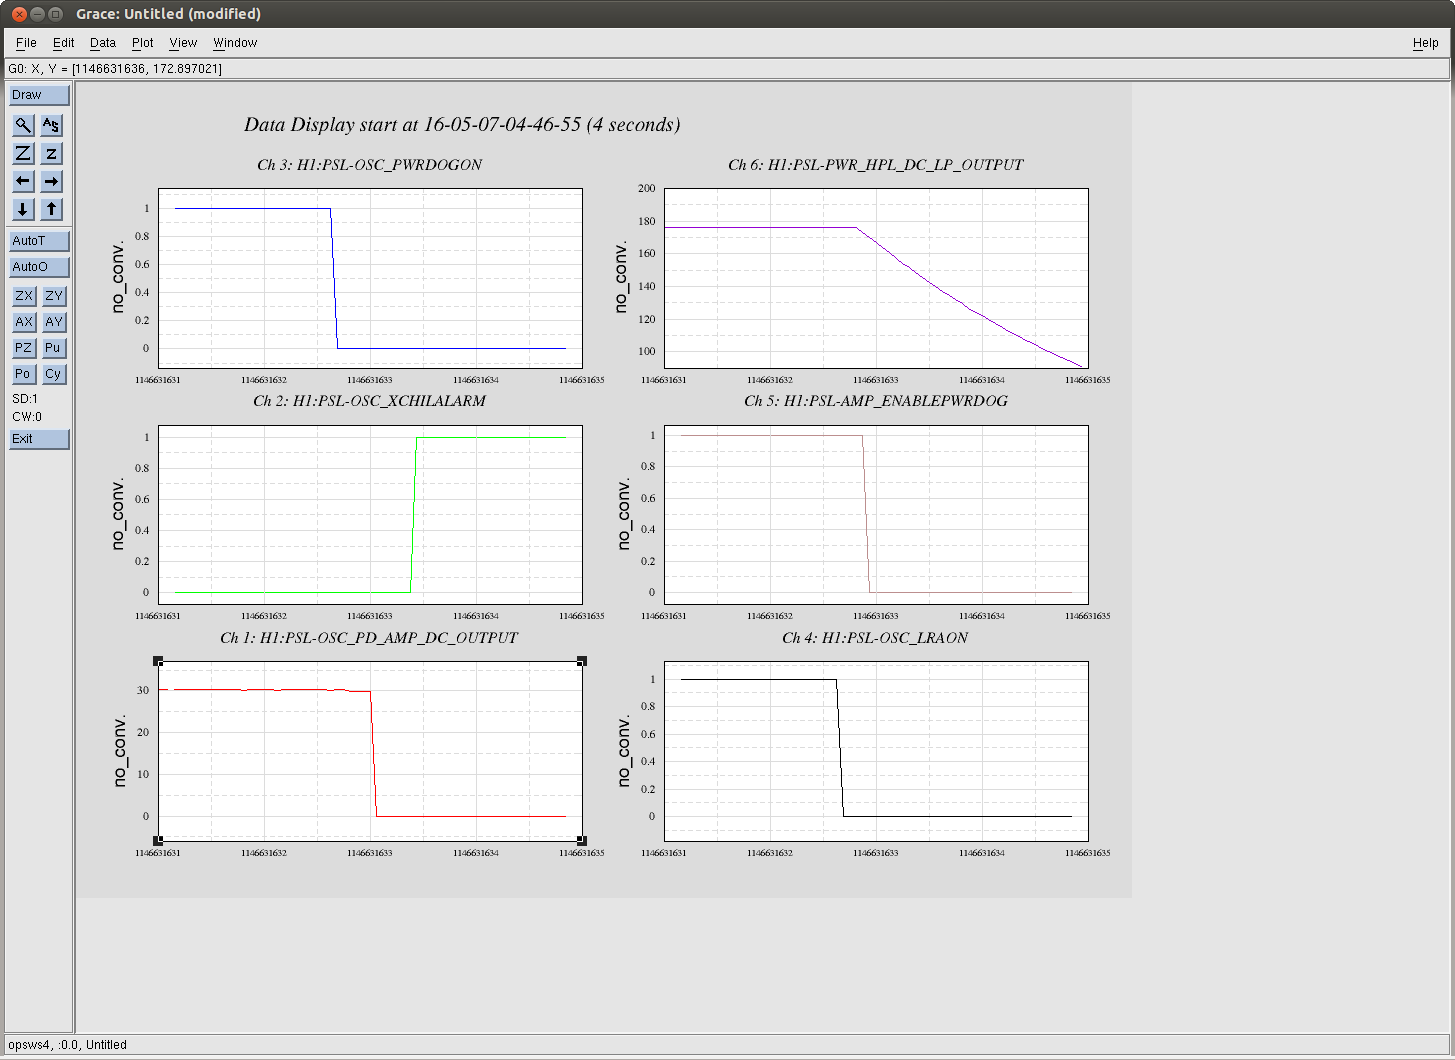
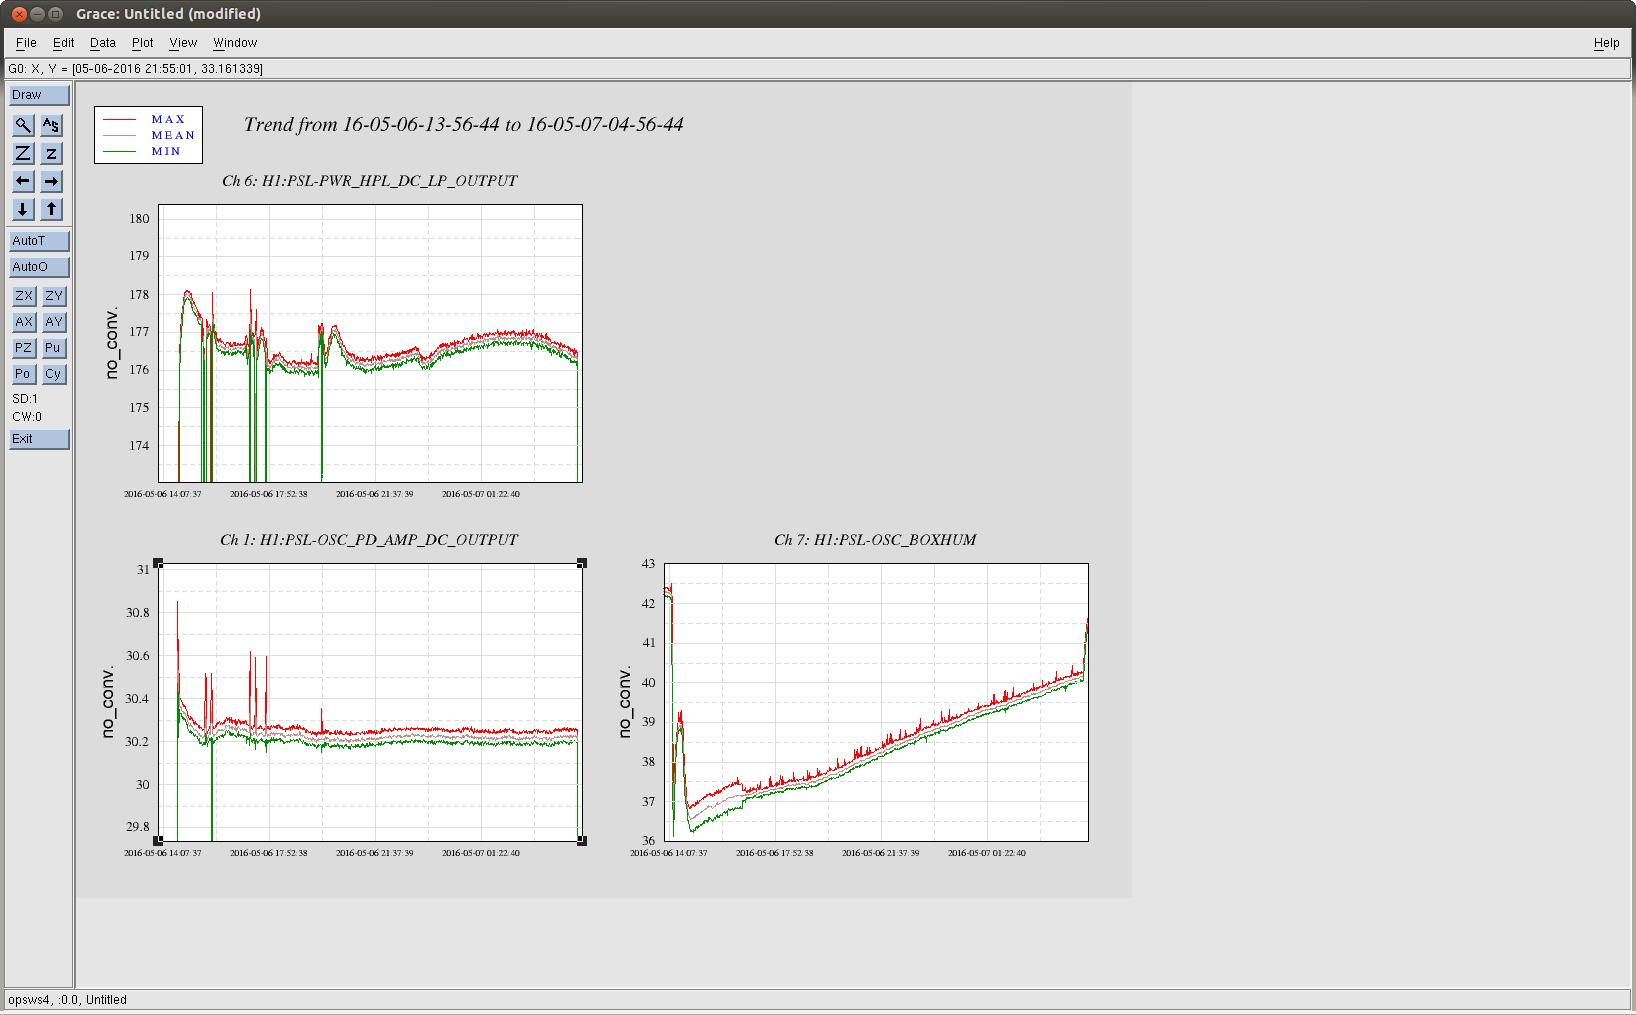
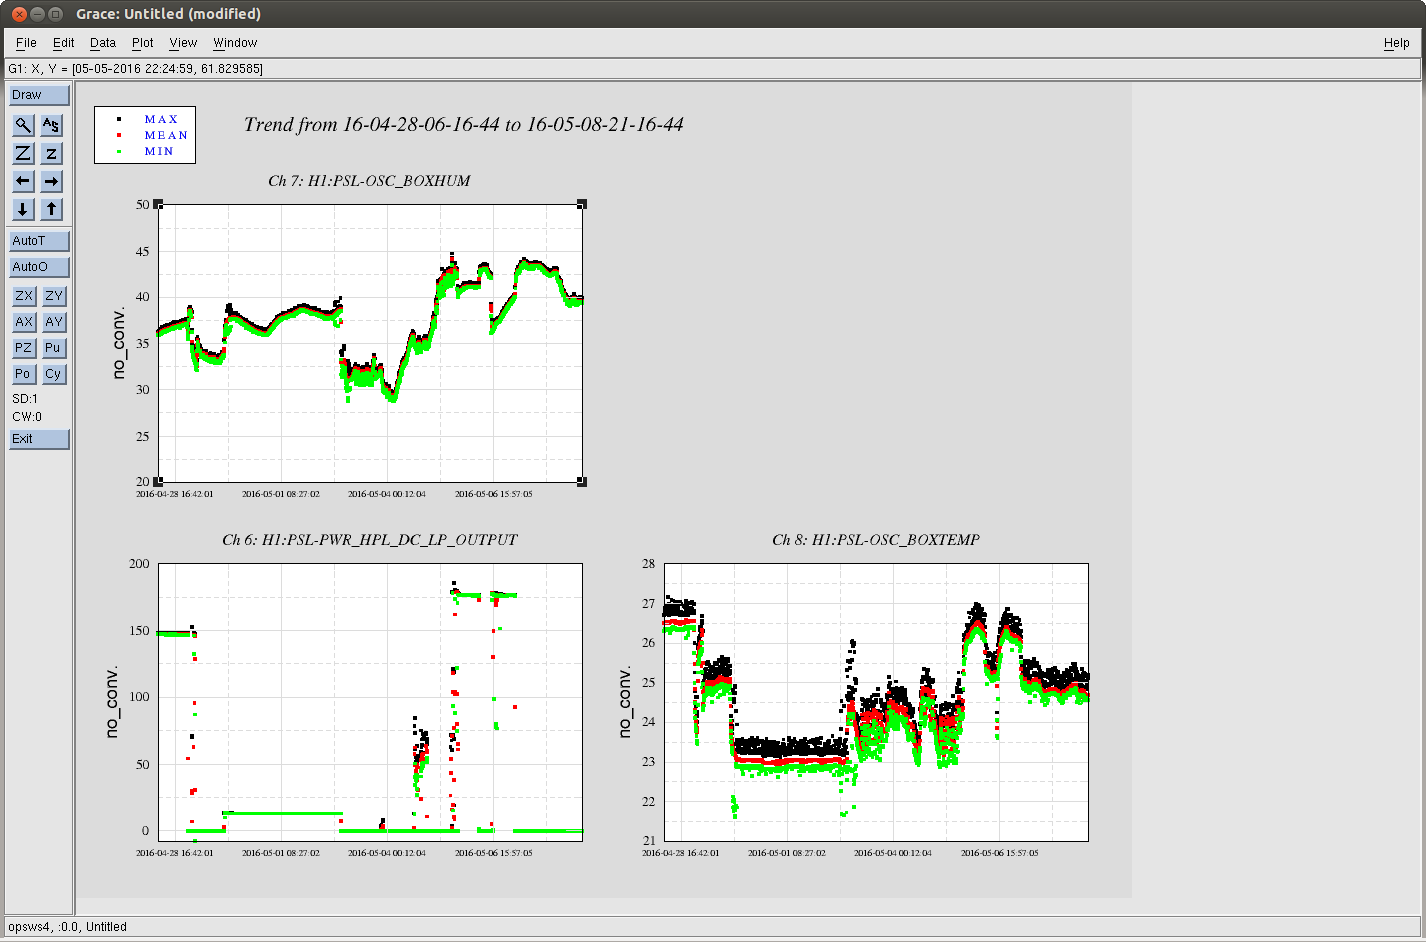
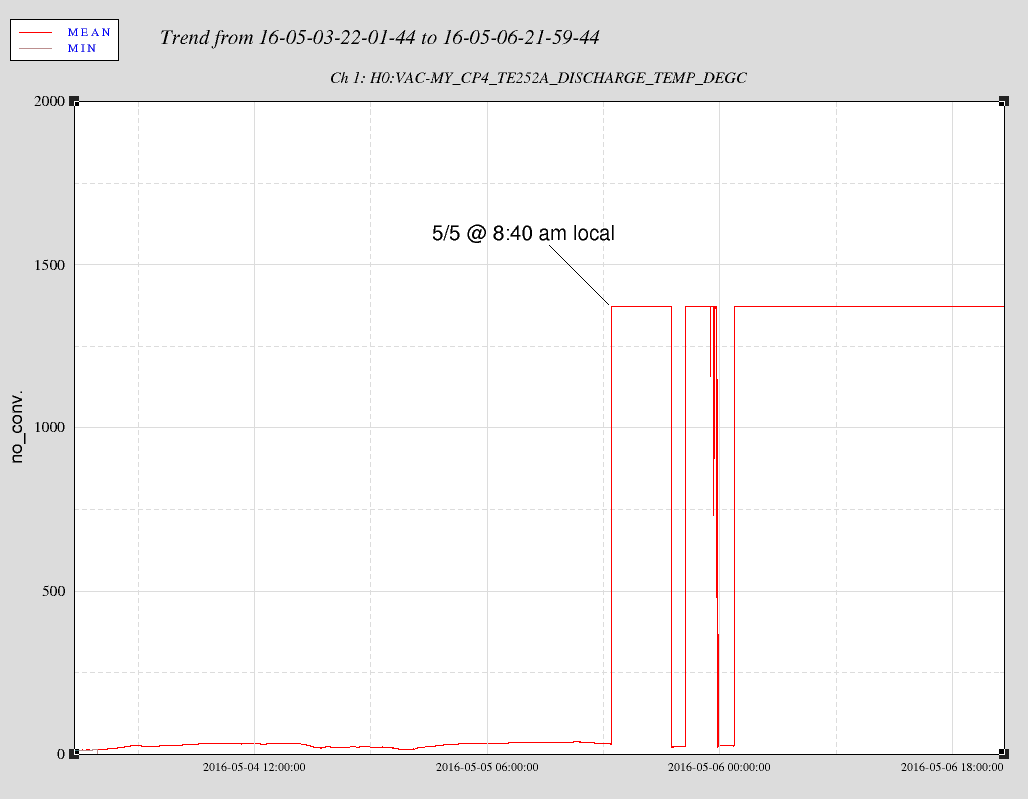
PSL: PD on this weekend's laser WD trip
Continued work on ISS and PMC
Outreach: Dale – Bringing tour through ~ 13:00 to 13:30