B. Weaver, H. Radkins, V. Sandberg
LHO WHAM6 Vent Plan for 2016 April 04 - 08
DCC Document: E1600092, “HAM6 - ISI Damper Install”
https://dcc.ligo.org/LIGO-E1600092
APPROVED work to be done in order of importance:
Install HAM ISI Dampers assemblies (Jim W., Nutsinee K.).
Retune Tuned Mass Dampers (TMDs).
DCC Vent Documents referenced in this plan:
-
E1600084, “Installation and Testing Procedure for HAM ISI Dampers”
a) D1500469 Drawing documents for ham blade dampers
b) D1600085 Drawing documents for GS13 dampers
c) D1500200 Drawing documents for flexure dampers
d) D0900703 Drawing documents for Tuned Mass Dampers (TMDs)
e) E1100963 Retuning the TMDs
f) T1500580 HAM ISI Damping Study - Mittleman
g) G1500880 Damping Tests on Flexture Demo - Lantz
-
E1100742 Payload layout update for HAM6
-
D0901822 HAM6 Top Level Chamber Assembly
-
E1201035 aLIGO Chamber Entry & Exit Procedures
-
M1100039 Hanford Checklist - HAM Door Removal
-
M1300464 Procedure for preparing aLIGO IFO for pumpdown
SCHEDULE
MON April 4, 2016 (possibly prior if time allowed)
1) Transition to LASER SAFE
2) Turn cleanrooms on around HAM6
3) Mark and move ISCT6 out of the way to facilitate door removal
4) Clean area, door flange, and cleanrooms
5) Stage supplies and equipment
a) Contamination control kit
b) B&K hammer setup and computer
c) Various ISI damper assemblies
d) ISI tool kit, TMD table setup
e) ISI parts as per E1600084
f) Septum viewport cover D1200448
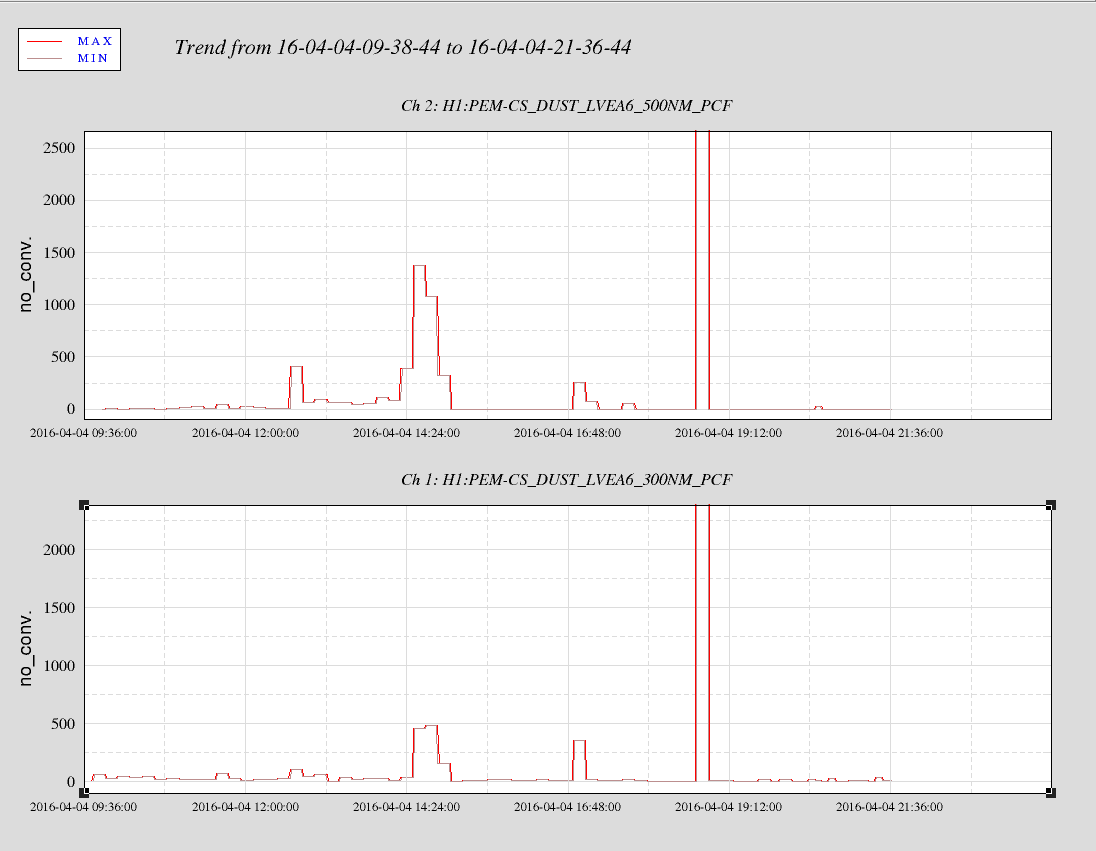
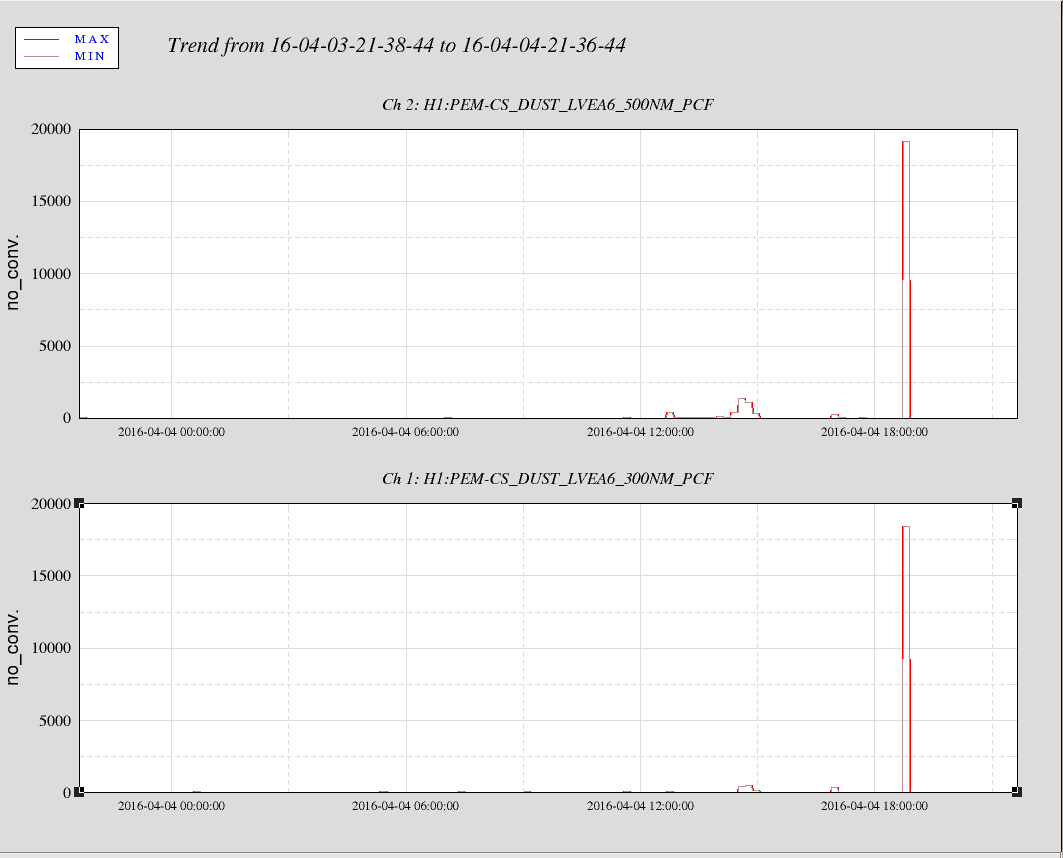
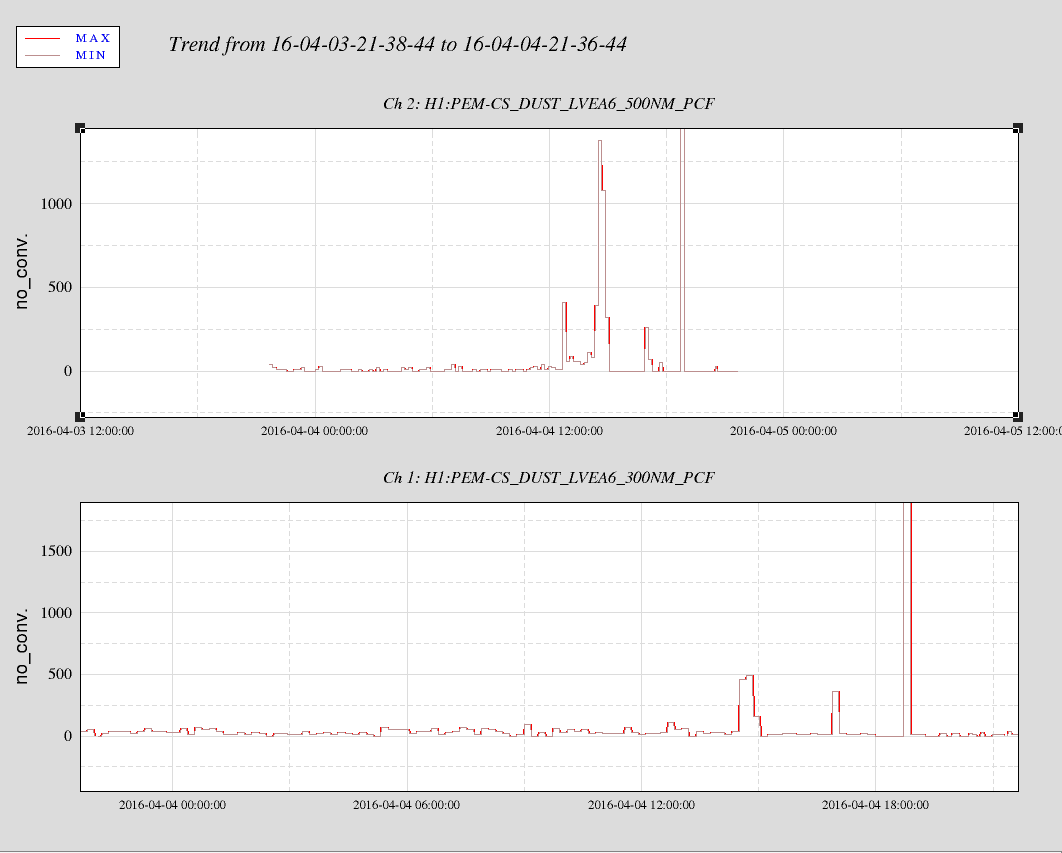
6) Confirm dust monitor is working
7) Lock HEPI
8) Confirm purge air is on at HAM6
9) Vent HAM6
TUES April 5th, 2015
10) Remove ALL 3 CHAMBER DOORS – Review and follow M1100039 “ Hanford checklist – HAM Door Removal”
11) Entry chamber checklist items: Pick up floor CC wafers. Take particle counter measurements and record:
12) SEI Lock ISI
13) Entry chamber checklist items: Pick up table top CC wafers.
14)Install Septum Window Cover
15) Evaluate, mark and Move Beam Diverter ONLY IF ABSOLUTELY NEEDED for ISI work. IF CABLES of Beam Diverter get removed, a test of the Beam Diverter function will need to be made before closeout.
16) Start ISI damper install work.
a) ISI Wall units need to be moved for this work.
Note, DO NOT REMOVE ANY TABLE TOP OPTICS. Confer with Keita before hand if this is needed.
b) Remove Tuned Mass Dampers (TMDs)
c) Install new spring damper assemblies
d) Measure new spring modes using the B&K System
e) Retune TMDs with new info
f) Reinstall TMDs
WED April 6th, 2016
17) Continue ISI damper install work.
18) Take particle measurements and record:
THUR April 7th, 2016
19) Finish ISI damper install work
20) Check Beam Diverter functionality
21) Quick check of ISI Balance and clean TF
22) Remove Septum Window Cover
23) Chamber closeout – perform applicable exit checklist tasks E1201035.
24) Take particle count measurements and record:
25) Replace 1 HAM6 door if possible
FRI, April 8th, 2016
26) Replace remaining HAM6 Doors
27) Begin pump down
28) Reset ISCT6