chandra.romel@LIGO.ORG - posted 16:00, Friday 11 March 2016 (26025)
CP3 over-fill
Kyle, Chandra

Manually over-filled CP3 today, at 15:40 PST, in 5 min. 30 sec.
Next fill is due Sunday, 3/13/2016.
Kyle, Chandra Manually over-filled CP3 today, at 15:40 PST, in 5 min. 30 sec. Next fill is due Sunday, 3/13/2016.
To put Kyle's mind at rest, I ran a test on the cell phone texter system which simulated a CP8 alarm. To run the test I elevated the LOW alarm level from 80% to 99%. With CP8 at 92%, this raised a bogus alarm which we all received on our cell phones.
After an hour I concluded the test and put the LOW level back to 80%. While we are closely monitoring CP8, I have removed CP3 from this system as this is always in alarm.
The crew has been able to clean 680 meters of Y-Arm beam tube including vacuuming and capping the support tubes in that same distance since Feb. 5th, some of which time was spent at LLO. The most recent stopping point is at HSW-1-041.
Test results are posted here.
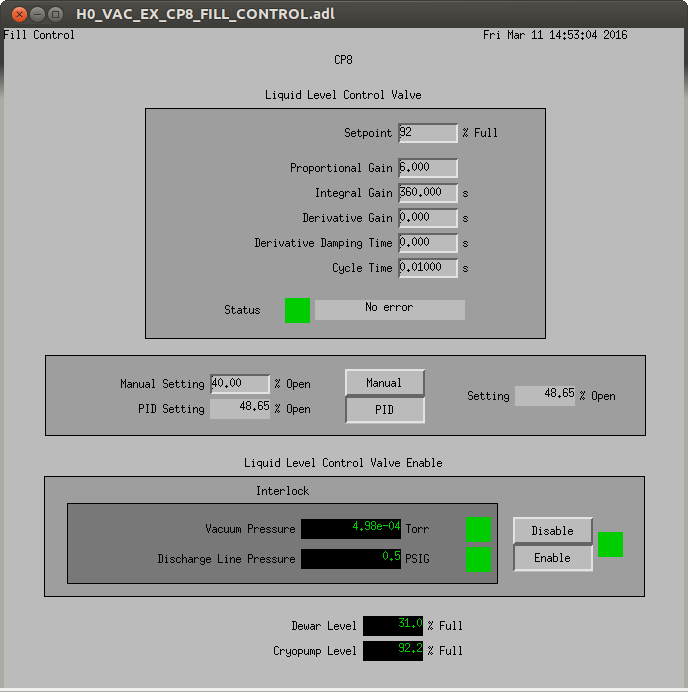
As part of the VE control system upgrade at EX we had to redo the PI controller to maintain the level of the tank. Though settings are not optimal they will certainly work with some small overshoot. Settings are Gain 6. Integral 360, Derivative 0. ideally I would like to eliminate the overshoot but this system is so slow I want to let it run like this for a couple of days. Will be good to see what happens Tuesday when the LN2 get delivered.
Screenshot of settings attached.
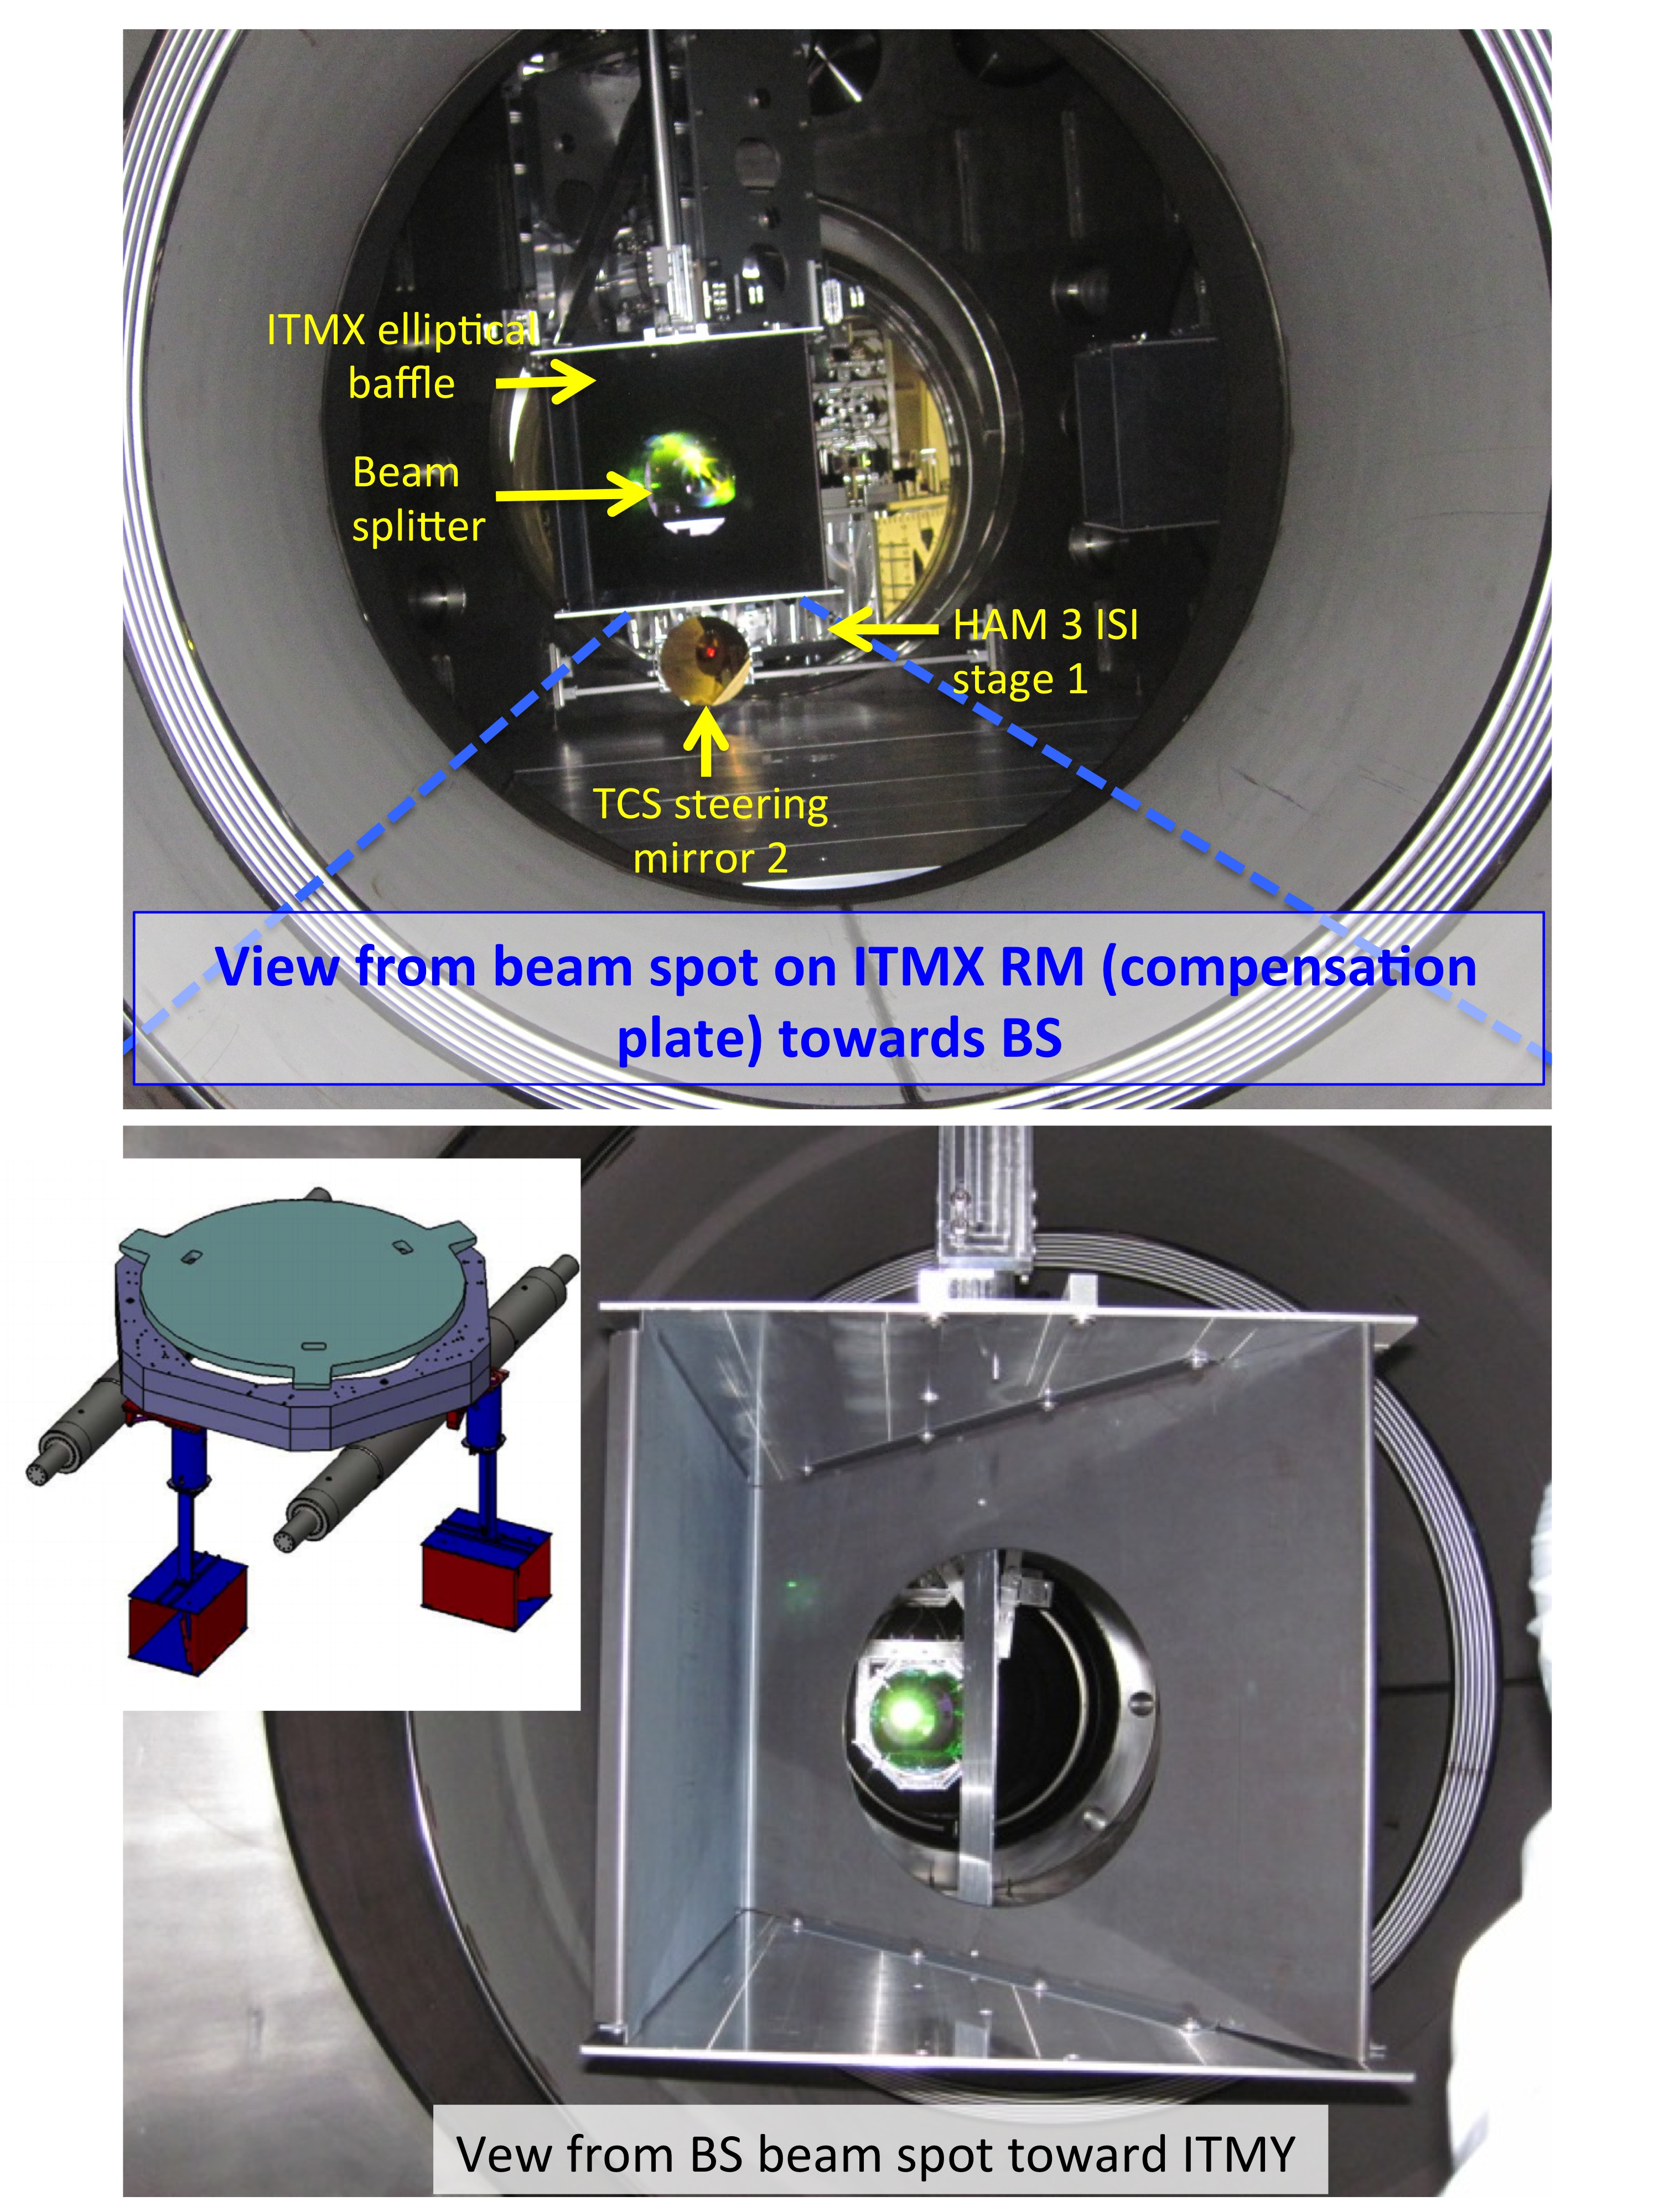
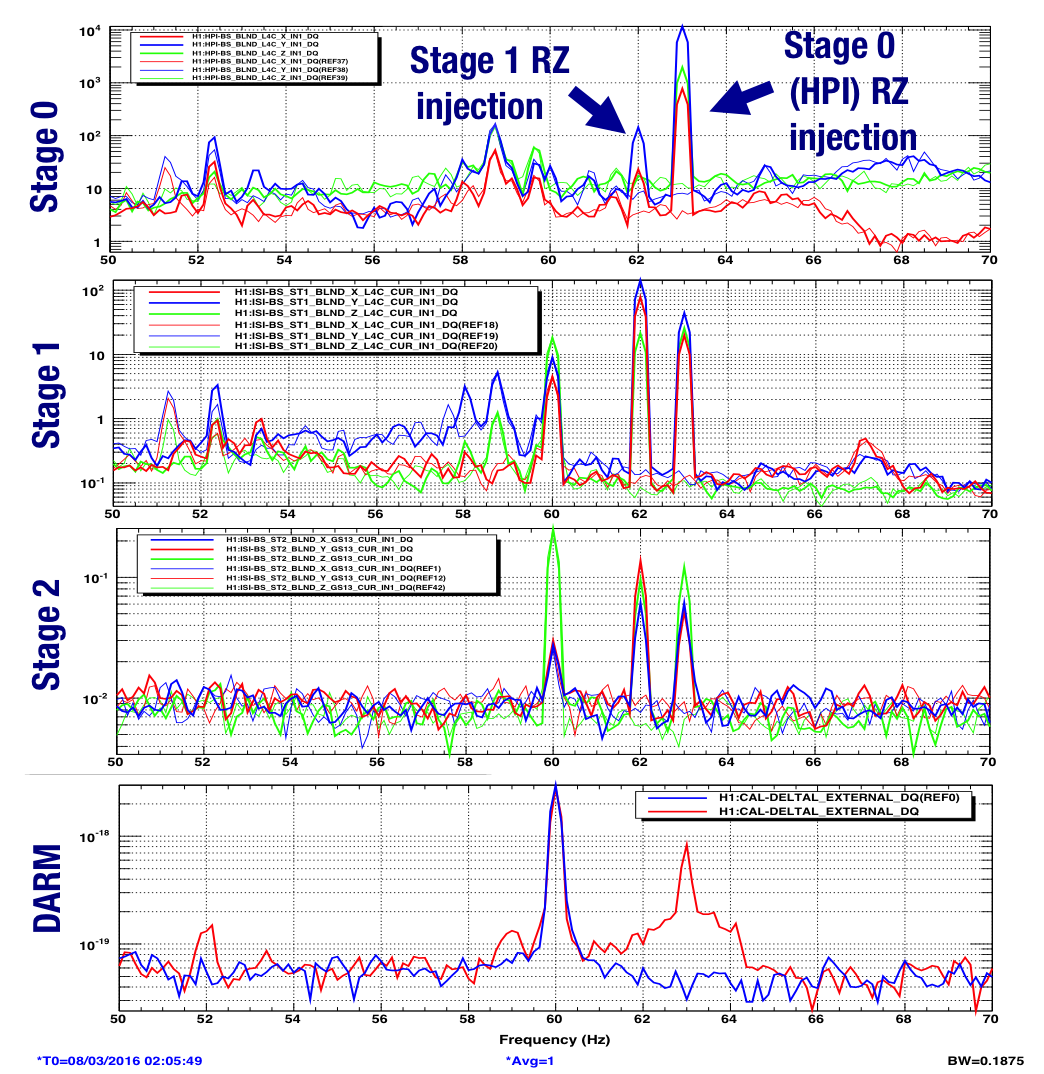
When we shook every chamber with external shakers, the BS chamber produced the most upconversion. The peaks produced by line injections have large side bands, suggestive of scattering (https://alog.ligo-wa.caltech.edu/aLOG/index.php?callRep=25132). Figure 1 shows photographs of things that might move in the light when the BS isolation shakes. These are pictures from the point of view of the beam spot on an ITM compensation plate or a beam spot on the BS itself. The ITM eliptical baffle is an obvious candidate. The baffle is mounted on stage 0 of the BS isolation. To test that it might be scattering, I shook stage 0 and stage 1 on Monday at two slightly different frequencies. The results in Figure 2 are consistent with scattering from something on stage 0, but not stage 1 or 2. I think we should B&K test the ITM elliptical baffles at LLO to get resonances for further testing of the hypothesis that we are seeing scattering from the ITM elliptical baffles.
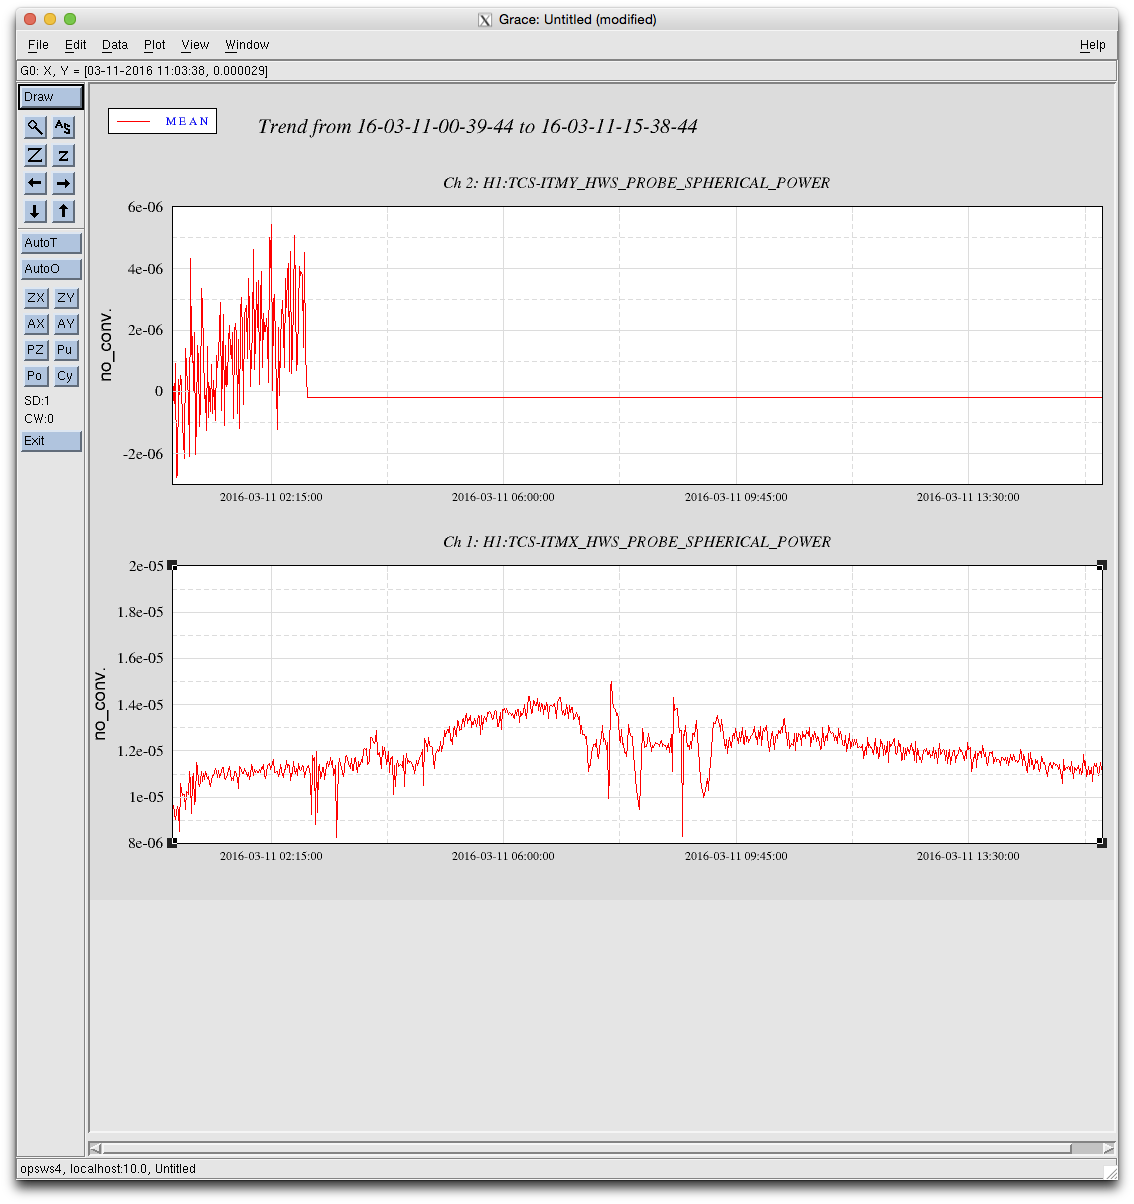
I reset the ITMY HWS magnification to 7.5x (it's set to 17.5x by default in the code).
aidan.brooks@opsws4:~$ caput H1:TCS-ITMY_HWS_MAGNIFICATION 7.5
Old : H1:TCS-ITMY_HWS_MAGNIFICATION 17.5
New : H1:TCS-ITMY_HWS_MAGNIFICATION 7.5
Alos, I had a quick look at the change in the spherical power measured by the ITMY HWS after the IFO lost lock this morning.
This is a very rough calculation - and assumes that the HWS-Y beam is correctly aligned (we need to combine our evidence to really confirm this).
Nevertheless, I've set the ITMY absorption to 4E-7 in the simulation.
aidan.brooks@opsws4:~$ caput H1:TCS-SIM_ITMY_SURF_ABSORPTION 4E-7
Old : H1:TCS-SIM_ITMY_SURF_ABSORPTION 4e-09
New : H1:TCS-SIM_ITMY_SURF_ABSORPTION 4e-07
For comparison, ITMX absorption estimated to be 5.7E-7.
I've added this number to the TCS actuator calibration page in the DCC: https://dcc.ligo.org/T1400685-x0
MAGNIFICATION for ITMY is now automatically set every time when the code is restarted. See 29549.
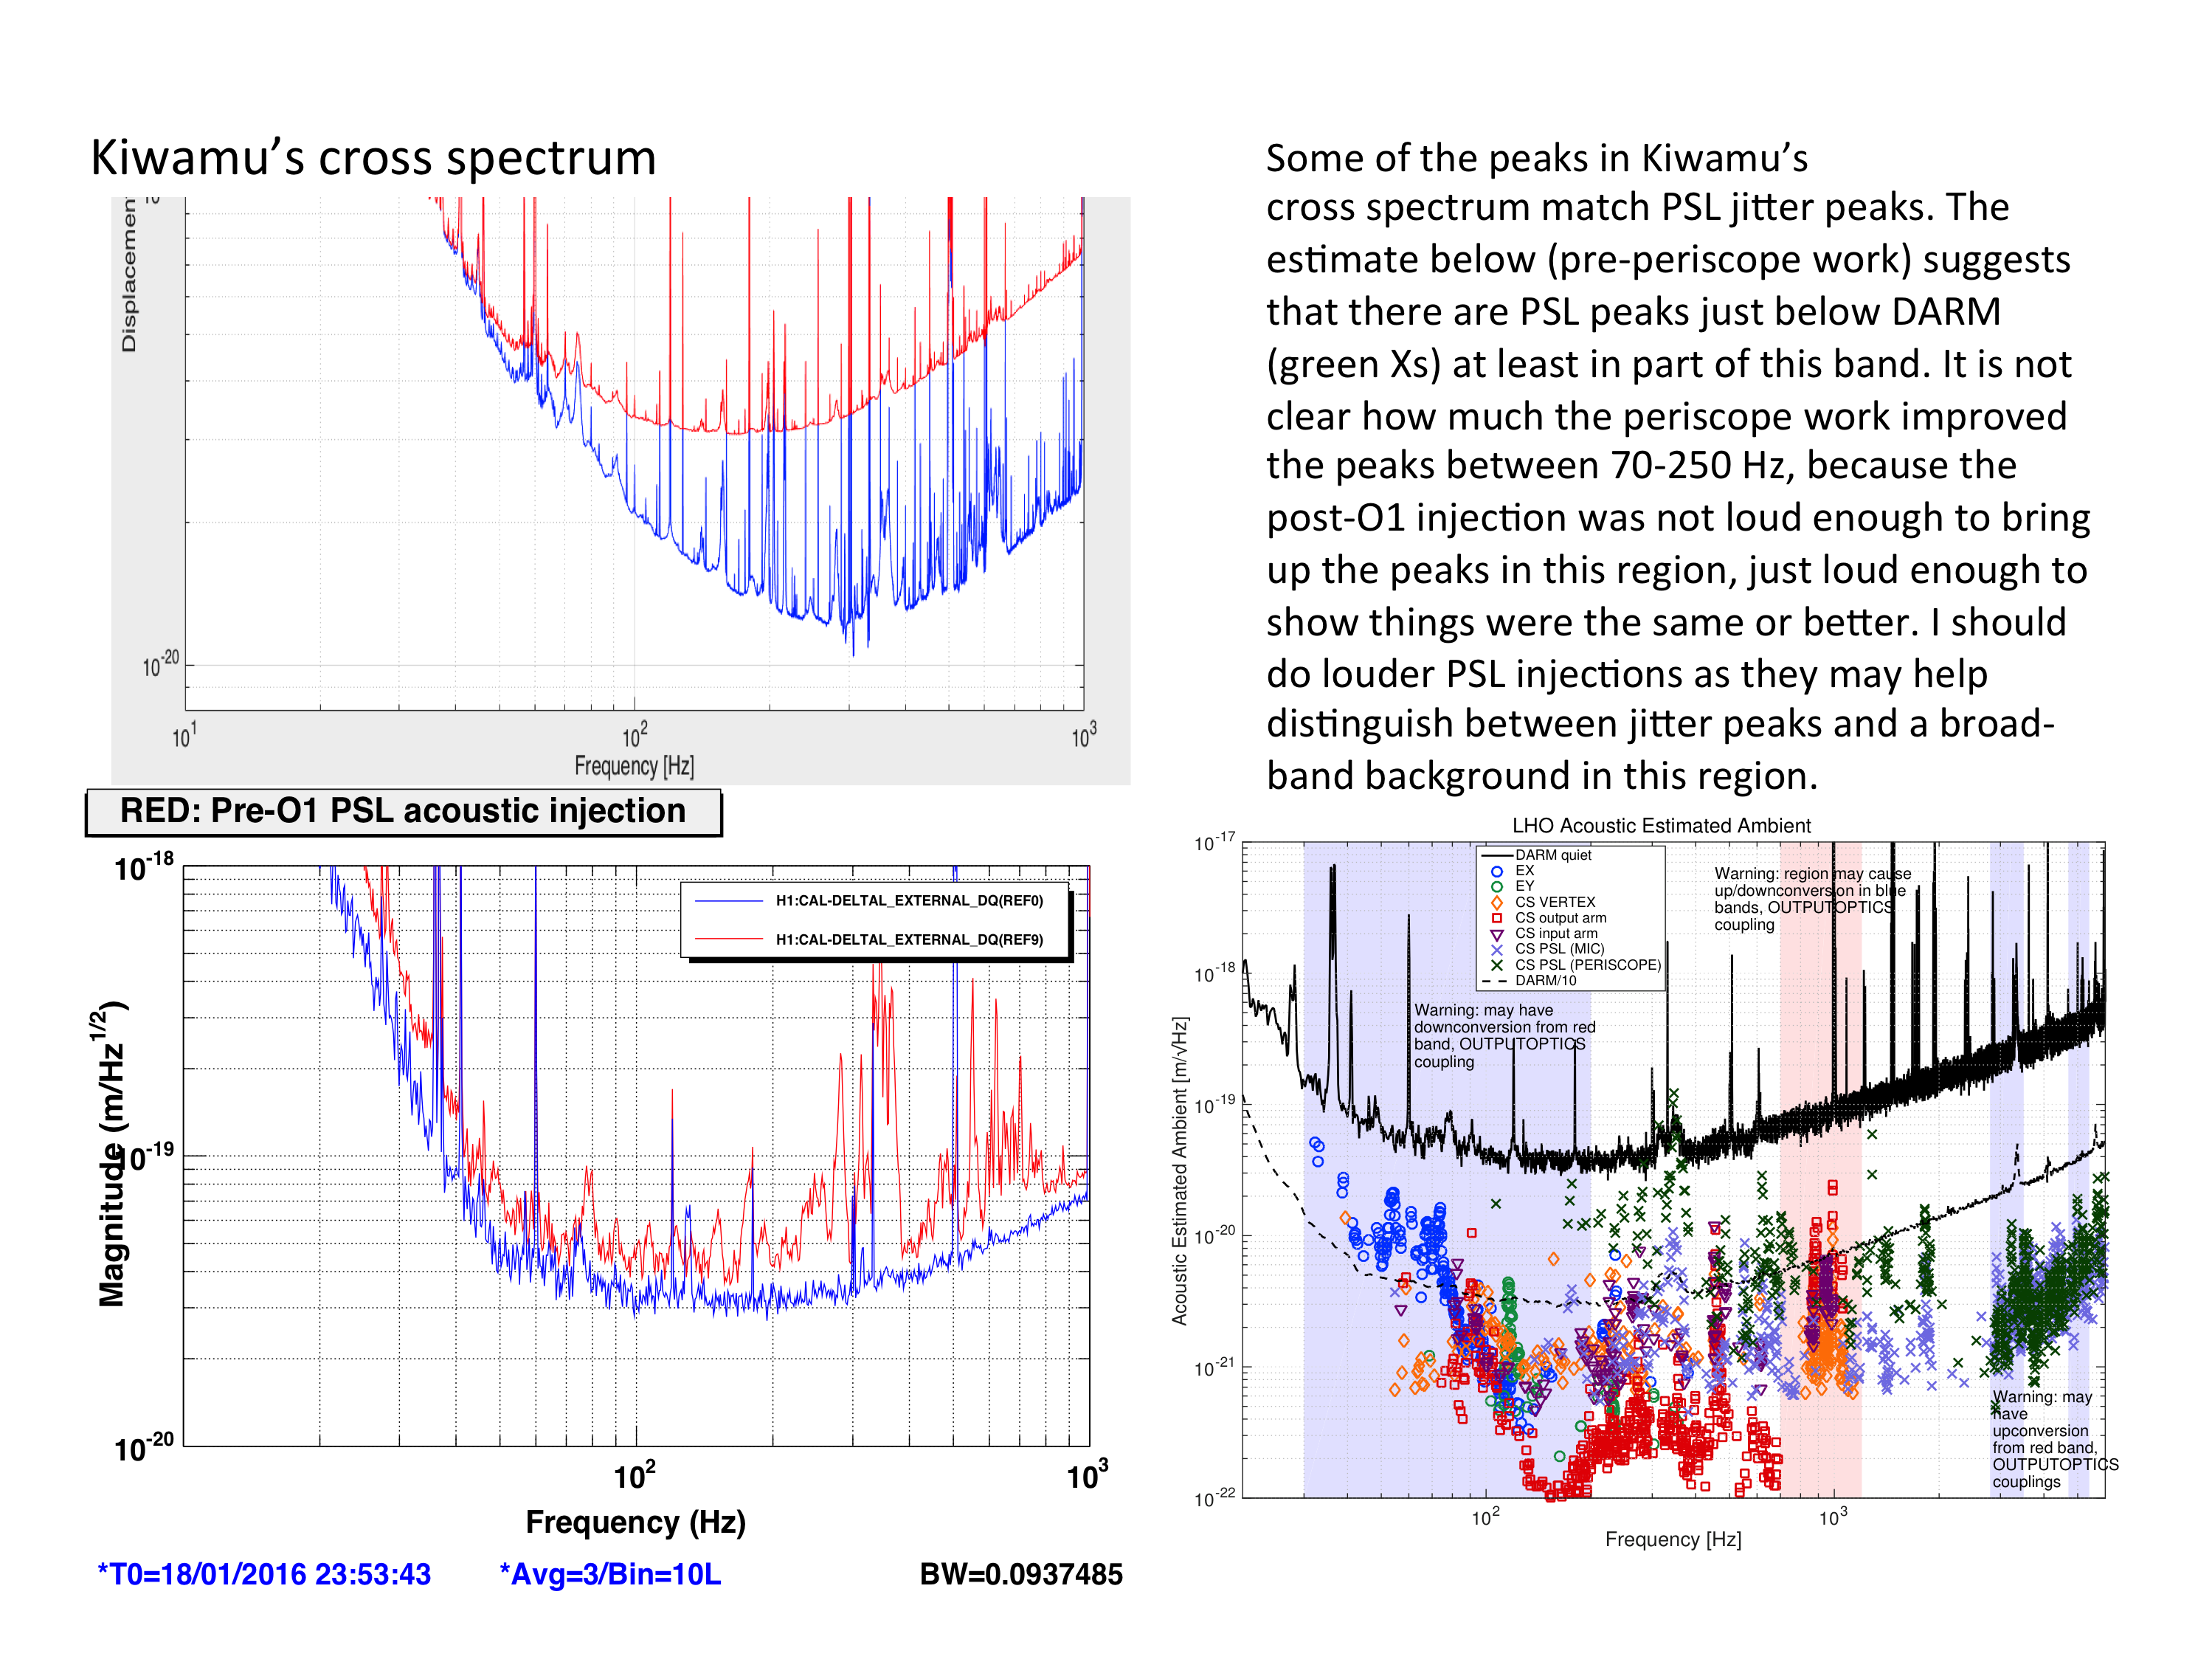
Some of the peaks in Kiwamu’s cross spectrum match PSL jitter peaks (see figure). The figure also shows that estimated ambient levels at some peaks are just factors of 2 or so below DARM. It is not clear how much the periscope work in September improved the peaks between 70-250 Hz, because the post-O1 injection was not loud enough to bring up the peaks in this region, just loud enough to show things were the same or better. I should do louder PSL injections as they may help distinguish between jitter peaks and a broad-band background in this region.
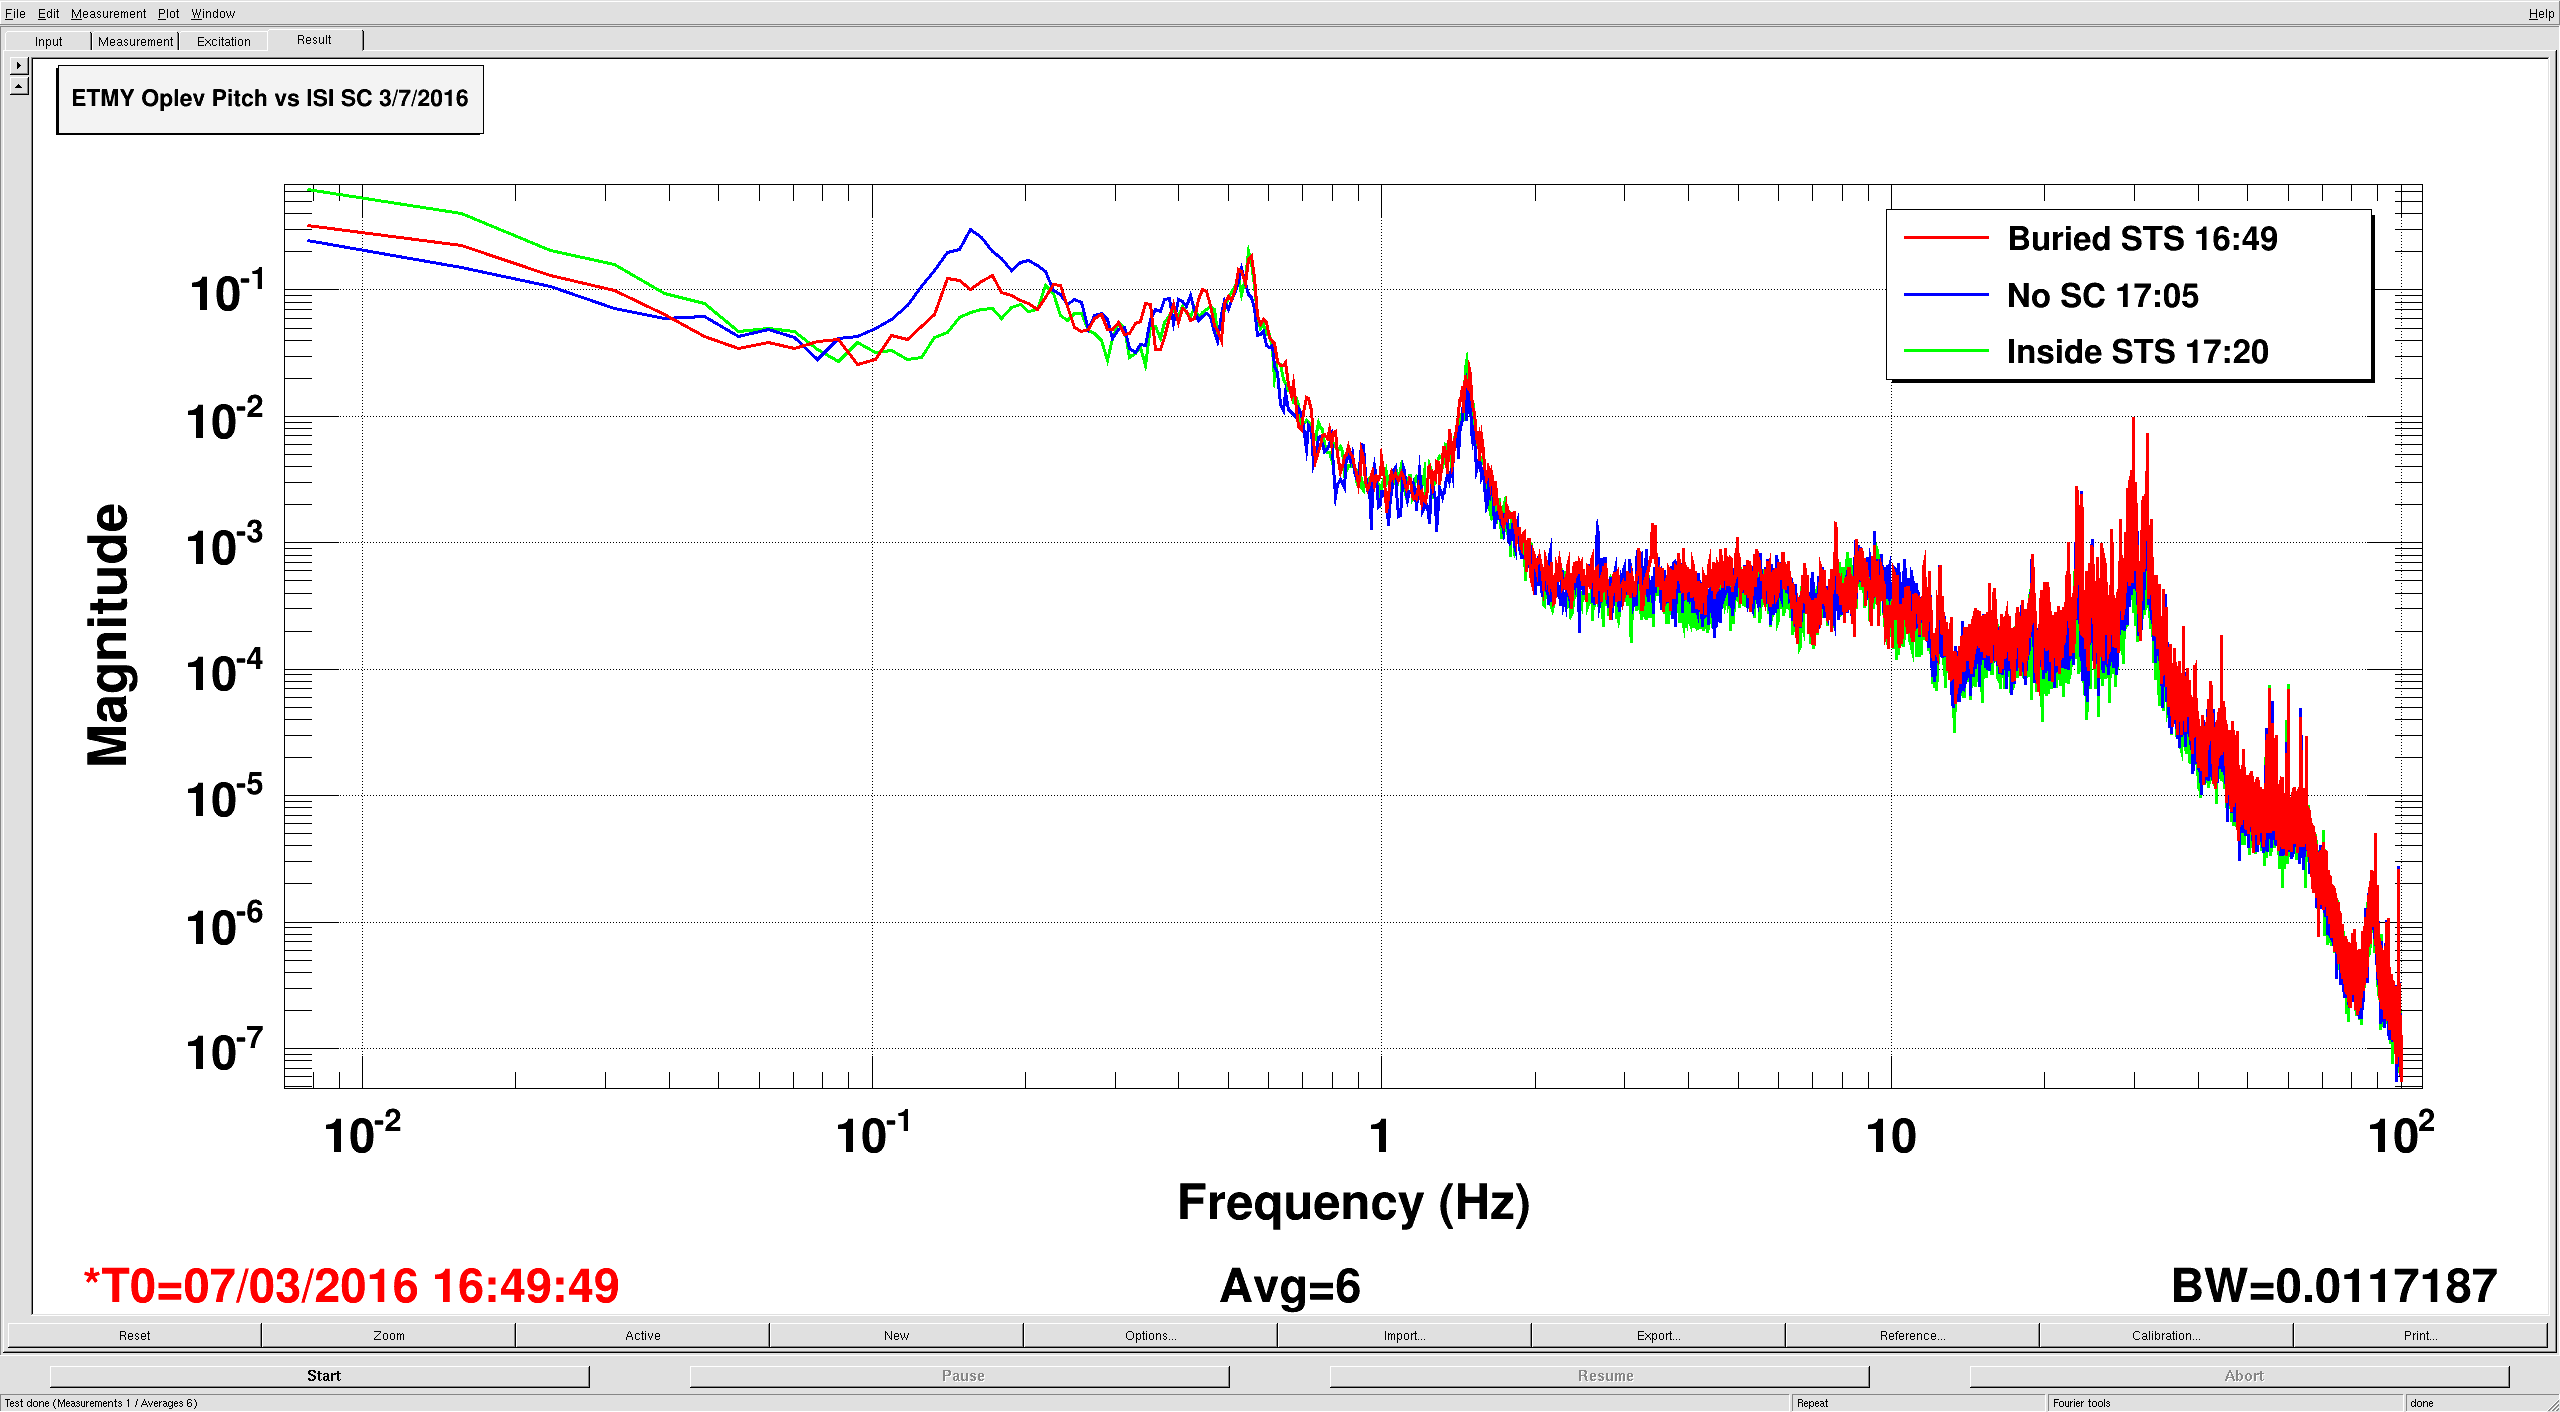
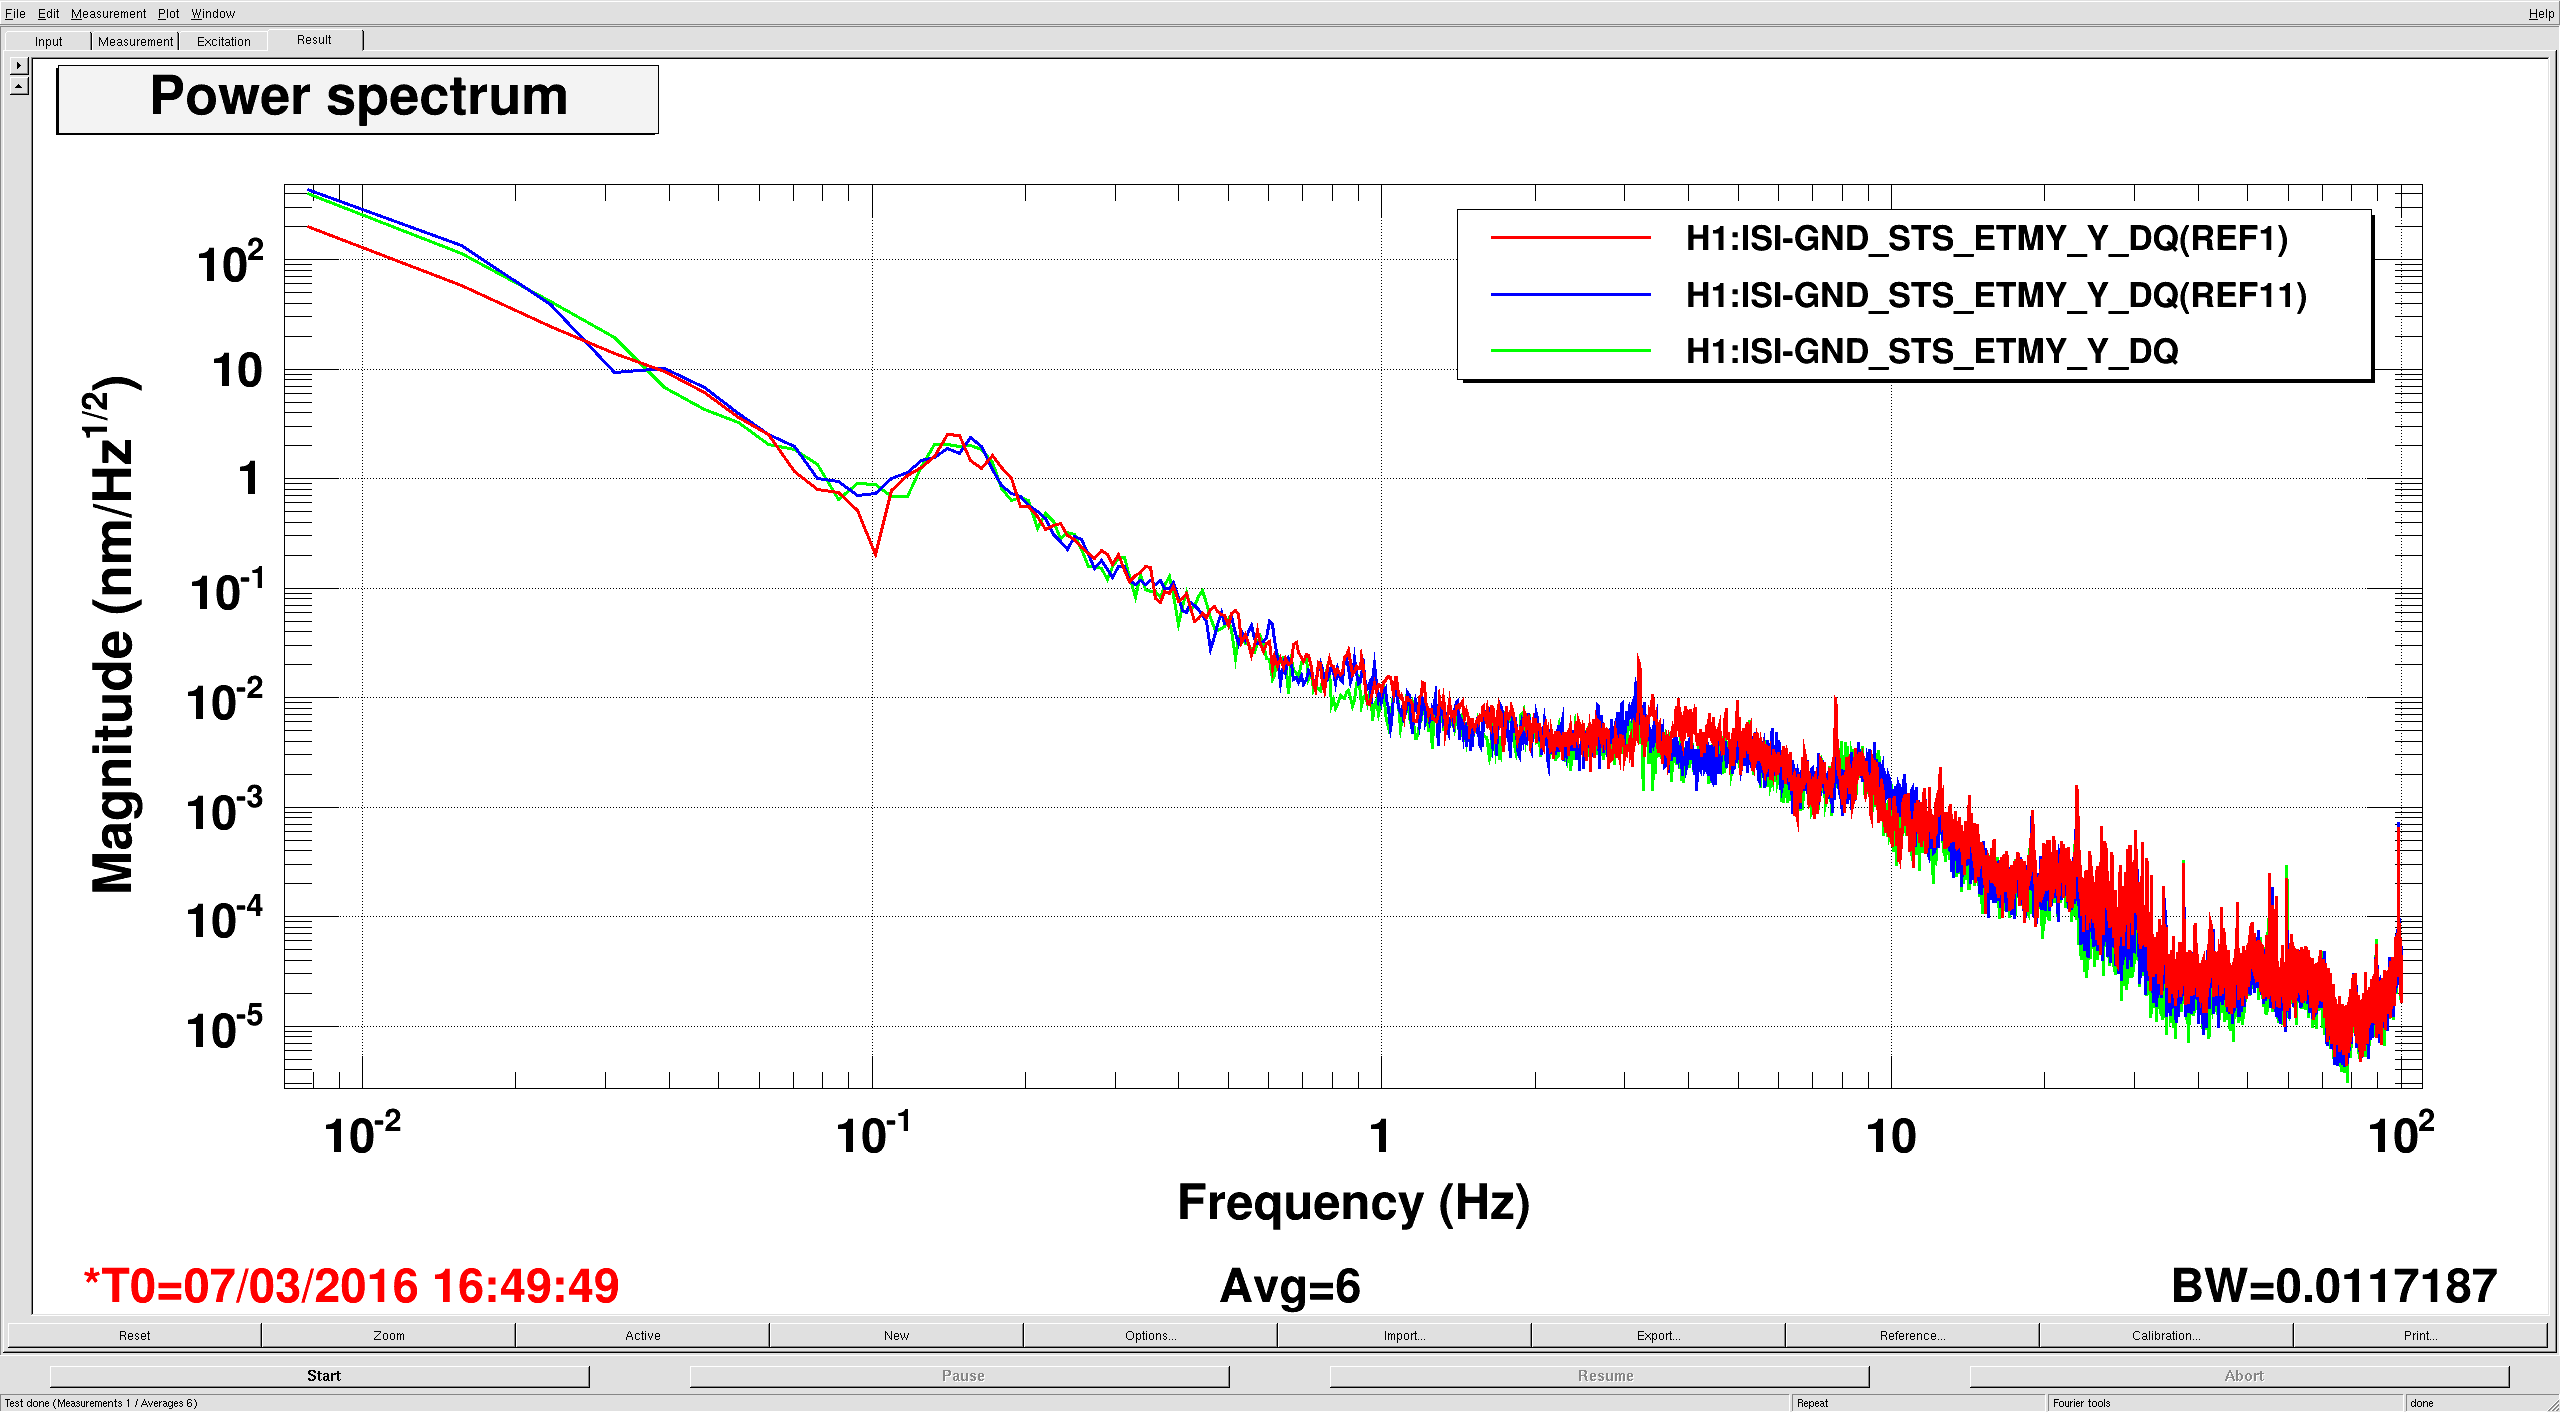
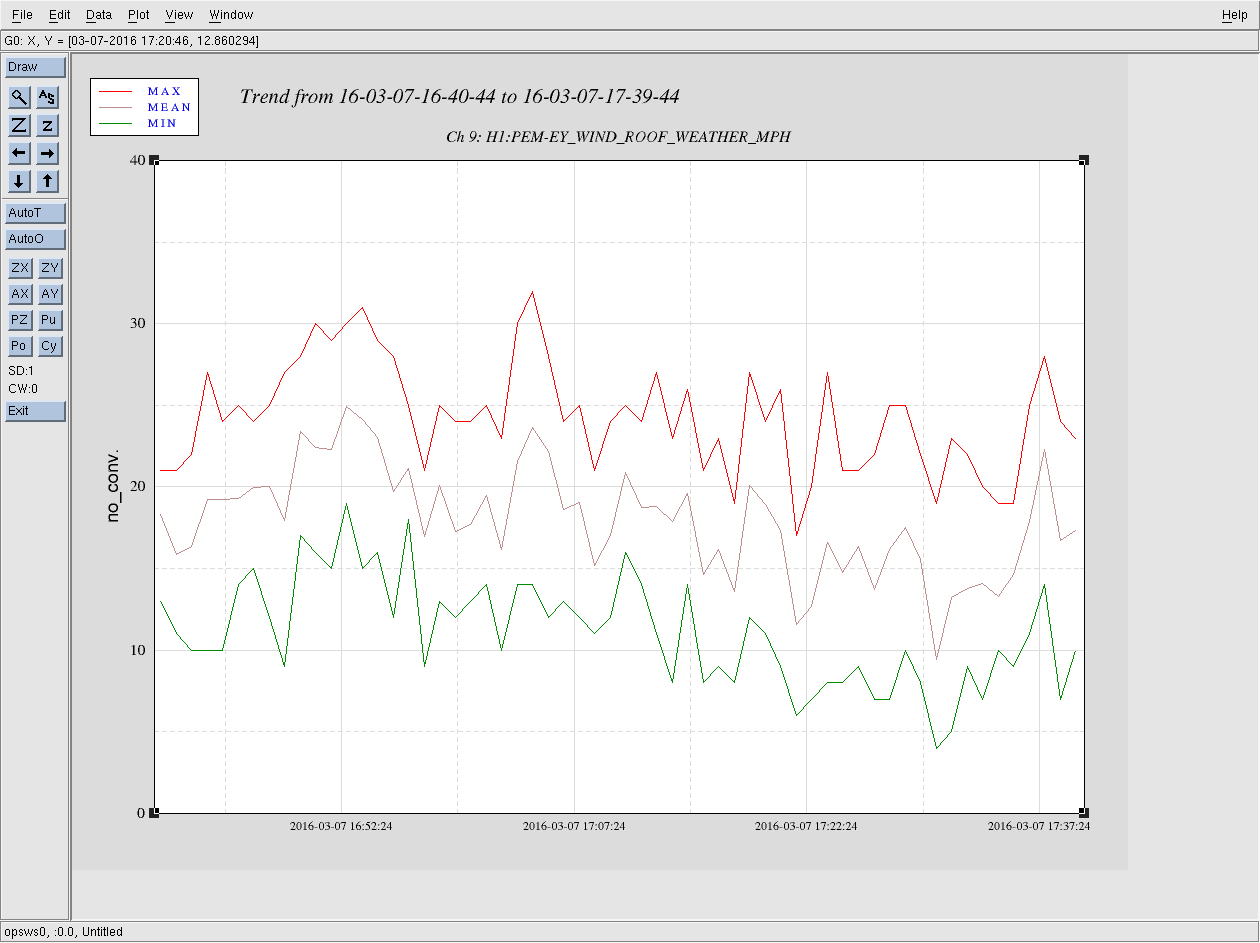
On Monday morning, the winds were too high to make much progress locking, so Sheila and I took some time to look at optic motion when using narrow band sensor correction. Because we couldn't get very far locking, we left the optic aligned and looked at the oplev. The 3 configurations I looked at were : sensor correction using the buried seismometer, no sensor correction and sensor correction using the building seismometer. First attached plot shows the oplev pitch for the 3 configurations, red is using the buried STS, blue is no sensor correction and green is with the building STS (this scheme holds for the other plots, too). Using sensor correction definitely improves pitch at the microseism (as expected, based on my design). Using the building STS seems to do a better job of suppressing the microseism, but injects tilt below the microseism (as expected), although I don't trust the oplevs much at low frequency as length to angle coupling gets worse. Second attached plot shows the building STS spectra for the 3 measurements, mostly pretty similar, though the low frequency motion on the green trace (while using the building STS) was the worst of the 3 measurements, maybe explaining at least some of bad low frequency motion at the oplev. The last plot is the minute trend of the wind over the time of the measurement. As usual, more investigation needed. I tried a different configuration this morning, using blend with the 2 STSes. I'll post that data in a while.
I logged in this morning to check how the ITMY-HWS ran overnight. It seemed to be running relatively normally until around 2:50UTC when it just stopped (HWSX was running fine).
I logged into H1HWSMSR and attached to the tmux session. Through some investigations and irregularities, I eventually realized that there were three tmux sessions running and two instances of the HWSX and two instances of the HWSY code running. Clearly this is not ideal.
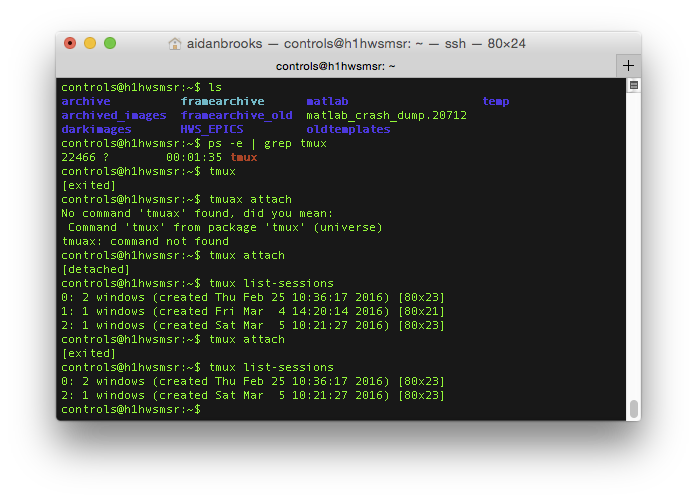
We'll have to figure out how to prevent additional tmux sessions from being started, but until then, please take care not to start extra sessions (always use the syntax tmux attach).
I don't know if multiple sessions fighting each other are the reason that the HWSY code stopped taking data, but I can't imagine it helped things.
I killed all HWS code (Run_HWS_ITMX, Run_HWS_ITMY), killed all but one tmux session and then restarted the HWS code. I also added a line to the .bashrc file to indicate the number of active tmux sessions when you log in.
The landscape crew has cleared X & Y access roads of tumbleweeds (for the moment) and will be starting to bail on the inside of the X arm this morning. The tumbleweeds typically build up on the inside of the arms against the tube enclosures and when the pile gets high enough even a small gust of wind will start to blow them over the tube and landing on the road again blocking the access road. Hopefully we can get ahead of this pile on the inside and keep the roads clear for a while longer.
TITLE: 03/11 day Shift: 16:00-00:00 UTC (08:00-16:00 PST), all times posted in UTC
STATE of H1: Planned Engineering
OUTGOING OPERATOR: None
CURRENT ENVIRONMENT:
    Wind Avg: 7 mph
    Primary useism: 0.03 μm/s
    Secondary useism: 0.31 μm/s
QUICK SUMMARY:IFO locked on ENGAGE_ASC_PART3 since 09:04:05UTC.
Jenne, Hang, Robert Ward, Stefan, Matt, Lisa
Today we spent some more time on ASC
1) We realized that ASB36 has the DC centering and SRM both orthogonal to the BS signal, so this is a better signal to be using for BS than 36A. We swithced to this, and also switched SRM to ASB36 I, since we saw that the error point was good for SRM in full lock when we have MICH controlled with ASB36 Q. This loop is not insensitive to the centering (it is basically parallel), but we seem to be OK.
2) 25999
3) We have the CHARD at high bandwidth in the guardian, although this is quite rough and we need to think about how to engage it more smoothly.
4) We have measured several sensing matrices, Hang will post them.
5)We are able to engage the soft loops even when they all have ofsets of about 0.1, and they converge very slowly without bringing our buildups down, with all the rest of the ASC on. We think this means that we don't (at least not any longer) have a problem with error points changing, but we might still have a problem with loops are cross coupled. We have done this 3 times now.
We are now having trouble with the OMC locking, it seems to be locking on the side of the fringe, even though the dither line is supressed. We tried a bust restore (the computer was restarted today.) but that hasn't solved the problem. We will come back to this tomorow.
| loop: |
BS |
SRM |
SRC2 |
DC3 |
DC4 |
CSOFT |
CHARD |
DSOFT |
DHARD |
PRM |
PR3 |
|
AS_A_DC_PIT |
4.22e-07 157 |
1.01e-06 6 |
1.59e-06 -6 |
9.86e-02 4 |
2.4e-03 -151 |
3.5e-09 -50 |
4.8e-09 -18 |
5.1e-09 138 |
8.21e-08 150 |
4.4e-12 -76 |
5.25e-09 129 |
|
AS_A_RF36_I_PIT |
3.54e-03 -43 |
1.47e-03 171 |
3.77e-03 179 |
2.74e+02 -175 |
2.4e+00 132 |
6.9e-06 152 |
2.8e-06 21 |
2.30e-05 151 |
2.7e-05 -43 |
2.86e-07 107 |
2.95e-04 143 |
|
AS_A_RF36_Q_PIT |
8.34e-03 146 |
6.6e-04 139 |
3.23e-03 -140 |
3.50e+02 -176 |
6.9e+00 5 |
2.7e-06 124 |
2.0e-06 -16 |
5.38e-05 -29.3 |
4.06e-05 164 |
9.26e-07 155 |
9.4e-05 161 |
|
AS_A_RF45_I_PIT |
1.58e-03 -29 |
2.71e-04 -142 |
1.3e-04 94 |
1.01e+01 -14 |
1.5e+00 -132 |
3.10e-05 -88 |
4.37e-05 -83 |
1.64e-05 132 |
2.66e-05 90 |
7.15e-08 113 |
4.31e-05 152 |
|
AS_A_RF45_Q_PIT |
1.78e-03 151 |
3.86e-03 4 |
6.24e-03 -3.1 |
3.79e+02 6.1 |
3.1e+00 -142 |
3.0e-05 -47 |
3.5e-05 -74 |
3.74e-05 147 |
6.56e-04 152.4 |
1.3e-07 5 |
1.6e-05 -29 |
|
AS_B_DC_PIT |
1.88e-07 -48 |
1.12e-06 -178 |
6.08e-07 4 |
1.5e-03 -164 |
7.70e-02 4 |
3.2e-09 136 |
2.5e-09 92 |
4.8e-09 -14 |
6.22e-08 -29 |
7.9e-11 139 |
4.27e-08 143 |
|
AS_B_RF36_I_PIT |
2.1e-04 -124 |
4.36e-03 1 |
4.51e-03 169 |
1.9e+00 170 |
4.35e+02 -175.8 |
1.27e-05 -23 |
1.0e-05 170 |
3.3e-06 157 |
6.6e-06 -156 |
7.90e-07 -54 |
5.52e-04 -31 |
|
AS_B_RF36_Q_PIT |
8.49e-03 136.6 |
8.2e-04 -80 |
2.29e-03 154 |
1.2e+00 10 |
3.9e+00 51 |
2.1e-06 -92 |
3.8e-06 14 |
5.25e-05 -34 |
4.66e-05 143 |
8.68e-07 -25 |
1.02e-04 -52 |
|
AS_B_RF45_I_PIT |
1.13e-03 153 |
2.74e-04 132 |
6.54e-04 -33 |
1.18e+00 124 |
6.50e+00 0 |
1.95e-05 91 |
2.68e-05 94 |
1.22e-05 -40 |
2.43e-05 -64 |
5.98e-08 -77 |
4.85e-05 -28 |
|
AS_B_RF45_Q_PIT |
1.24e-03 -49 |
5.01e-03 179.9 |
2.54e-03 3 |
1.8e+01 -170 |
3.23e+02 6 |
4.9e-05 118 |
6.09e-05 97 |
3.78e-05 -36 |
5.93e-04 -28 |
1.3e-07 103 |
1.23e-04 141 |
|
AS_C_PIT |
1.32e-07 -82 |
6.43e-07 177 |
1.19e-06 -1 |
6.4e-04 -161 |
2.9e-04 126 |
1.5e-09 -149 |
2.7e-09 -84 |
9.4e-10 19 |
2.15e-08 -26 |
5.54e-11 125 |
4.33e-08 142 |
|
REFL_A_DC_PIT |
5.6e-07 83 |
6.8e-08 66 |
2.2e-06 72 |
1.9e-03 -147 |
2.6e-02 0 |
6.2e-09 -111 |
3.8e-08 162 |
3.1e-08 -74 |
1.2e-07 -69 |
4.1e-10 128 |
6.05e-08 147 |
|
REFL_A_RF9_I_PIT |
7.2e-04 -59 |
5.6e-05 -116 |
5.3e-04 170 |
1.3e+00 -135 |
1.3e+01 -166 |
8.7e-06 -23 |
8.50e-05 -26 |
1.1e-05 36 |
4.7e-05 80 |
5.1e-07 148 |
2.24e-04 -29 |
|
REFL_A_RF9_Q_PIT |
1.0e-04 109 |
3.3e-05 -14 |
2.4e-04 89 |
6.3e-01 -123 |
8.4e-01 -146 |
4.2e-06 -52 |
2.3e-05 -26 |
3.8e-06 -80 |
1.2e-05 30 |
1.9e-07 137 |
2.3e-05 142 |
|
REFL_A_RF45_I_PIT |
1.3e-03 -165 |
1.0e-03 125 |
4.6e-03 -57 |
3.3e-01 -35 |
2.1e+01 162 |
1.4e-05 104 |
1.0e-04 -27 |
3.6e-05 78 |
6.5e-05 116 |
2.61e-06 147.5 |
2.29e-04 153 |
|
REFL_A_RF45_Q_PIT |
7.8e-04 -105 |
2.0e-04 72 |
6.8e-04 127 |
3.2e-01 -142 |
2.5e+00 -75 |
2.3e-06 -92 |
1.7e-05 -25 |
2.3e-06 -32 |
6.3e-06 28 |
2.5e-07 8 |
7.6e-05 116 |
|
REFL_B_DC_PIT |
3.4e-07 2 |
4.9e-08 -113 |
1.9e-07 87 |
1.2e-03 -165 |
8.9e-03 -100 |
5.6e-09 -24 |
2.0e-08 175 |
1.1e-08 -93 |
9.5e-09 -130 |
1.1e-10 0 |
3.02e-08 -31 |
|
REFL_B_RF9_I_PIT |
1.0e-03 -11 |
1.6e-04 10 |
3.4e-04 47 |
1.0e+00 121 |
9.1e+00 -53 |
2.2e-05 -25 |
8.31e-05 -24 |
1.5e-05 -97 |
1.8e-05 -48 |
1.84e-06 -68 |
6.18e-04 -32.0 |
|
REFL_B_RF9_Q_PIT |
2.1e-04 -5 |
4.8e-05 162 |
1.5e-04 18 |
3.0e-01 117 |
2.6e+00 -38 |
4.2e-06 -26 |
1.4e-05 -24 |
2.6e-06 -116 |
3.4e-06 -88 |
4.49e-07 -62 |
1.20e-04 -31 |
|
REFL_B_RF45_I_PIT |
6.8e-04 -172 |
6.5e-04 -5 |
2.6e-03 123 |
8.9e-01 136 |
1.1e+01 -37 |
7.3e-06 -52 |
8.34e-05 -23 |
2.2e-05 -100 |
2.9e-05 -63 |
1.3e-06 -40 |
4.18e-04 145 |
|
REFL_B_RF45_Q_PIT |
1.1e-03 107 |
1.1e-03 -50 |
2.72e-03 135 |
2.4e-01 175 |
4.0e+00 -78 |
1.1e-06 -165 |
3.29e-05 -25 |
6.9e-06 -111 |
4.6e-06 67 |
1.13e-06 -23 |
2.03e-04 158 |
|
POP_A_PIT |
8.9e-09 152 |
4.36e-09 9 |
3.1e-09 61 |
6.4e-06 119 |
1.4e-04 169 |
7.9e-11 -46 |
1.81e-09 -25 |
9.2e-11 25 |
5.8e-10 -175 |
2.54e-11 119 |
4.09e-09 146 |
|
POP_B_PIT |
8.1e-09 -44 |
2.8e-09 -165 |
5.6e-09 -39 |
1.2e-05 -122 |
1.6e-05 -49 |
4.9e-11 -93 |
9.00e-10 154 |
1.1e-10 169 |
4.8e-10 24 |
5.29e-11 123 |
2.81e-09 -32 |
|
X_TR_A_PIT |
2.7e-09 42 |
1.3e-09 -27 |
4.9e-09 78 |
9.1e-05 11 |
2.0e-04 -76 |
2.0e-11 -165 |
3.02e-09 153 |
4.6e-11 162 |
2.96e-09 159 |
6.9e-13 -174 |
3.81e-10 145 |
|
X_TR_B_PIT |
2.0e-09 97 |
5.2e-10 -8 |
3.9e-09 22 |
7.7e-05 12 |
3.6e-05 -93 |
9.8e-11 164 |
2.81e-09 152 |
1.2e-10 153 |
2.77e-09 153 |
3.7e-14 14 |
3.43e-10 145 |
|
Y_TR_A_PIT |
1.5e-09 112 |
1.72e-09 165 |
2.0e-09 130 |
1.14e-04 -171 |
2.0e-05 -117 |
2.09e-10 152 |
2.70e-09 151 |
1.90e-10 -34 |
2.68e-09 -31 |
4.6e-13 -86 |
3.88e-10 143 |
|
Y_TR_B_PIT |
9.8e-10 11 |
1.29e-09 167 |
5.8e-10 167 |
5.57e-05 -176 |
1.9e-05 -172 |
4.29e-10 148 |
4.36e-10 151 |
4.36e-10 -32 |
4.78e-10 -36 |
5.9e-13 -34 |
1.04e-10 134 |
|
AS_A_RF90_PIT |
5.1e-07 -33 |
2.3e-07 -179 |
3.5e-07 -22 |
1.2e-02 16 |
1.3e-02 41 |
1.7e-08 111 |
6.0e-09 -157 |
2.5e-08 146 |
4.9e-08 -27 |
2.1e-10 -68 |
2.29e-08 158 |
|
AS_B_RF90_PIT |
2.0e-07 135 |
4.1e-07 170 |
2.7e-06 11 |
2.2e-03 146 |
2.7e-02 60 |
4.4e-09 -7 |
3.2e-08 155 |
3.3e-08 -50 |
1.0e-07 -122 |
2.5e-10 -79 |
9.2e-09 132 |
In the matrix, each element is in the format "%e %f"%(ct/ct, phase). The grey elements have low coherence (<0.6).
I confirmed that OMC could be locked manually in a single bounce configuration with 20 W PSL. The angular dither loops was functional as well. I did not find any obvious faults or mis-settings.
In full lock with 2 W PSL, the carrier power is for some reason too small by more than a factor of two according to a threshold value in the OMC guardian. I could confirm this by chainging the size of the DARM offset as well as the peak height of the violine modes. The 45 MHz sidebands seem as large as 15mA in OMC DCPD SUM while the carrier is about 6 mA unless with the nominal DARM offset of 3e-5 counts at the input of LSC-DARM1.
Another sensing matrix, calibrated in W/rad. On the sensor side, only the AS/REFL WFS' were calibrated, based on the matlab model /ligo/svncommon/NbSVN/aligonoisebudget/trunk/Dev/DRFPMI/ASC/ASC_NB/DRFPMI_ASC_simple_MK18.slx
| loop: |
BS |
SRM |
SRC2 |
DC3 |
DC4 |
CSOFT |
CHARD |
DSOFT |
DHARD |
PRM |
PR3 |
INP1 |
|
AS_A_DC_PIT |
1.59e-02 160 |
3.31e-03 6 |
5.30e-03 -6 |
2.12e-02 4 |
5.1e-04 -150 |
6.7e-03 -51 |
9.2e-03 -18 |
9.8e-03 140 |
1.57e-01 150 |
2.8e-08 -76 |
2.37e-04 130 |
1.1e-07 -53 |
|
AS_A_RF36_I_PIT |
1.33e+02 -44 |
4.97e+00 170 |
1.26e+01 180 |
5.79e+01 -180 |
5.1e-01 130 |
1.32e+01 150 |
5.4e+00 22 |
4.40e+01 150 |
5.2e+01 -43 |
1.87e-03 110 |
1.37e+01 140 |
8.08e-04 88 |
|
AS_A_RF36_Q_PIT |
3.14e+02 150 |
2.2e+00 140 |
1.06e+01 -140 |
7.50e+01 -180 |
1.5e+00 5 |
5.2e+00 120 |
3.8e+00 -16 |
1.03e+02 -29.0 |
7.85e+01 160 |
5.99e-03 160 |
4.3e+00 160 |
2.50e-03 -85 |
|
AS_A_RF45_I_PIT |
6.06e+01 -29 |
8.94e-01 -140 |
4.3e-01 95 |
2.14e+00 -15 |
3.2e-01 -130 |
5.93e+01 -89 |
8.42e+01 -83 |
3.06e+01 130 |
5.17e+01 91 |
4.57e-04 110 |
1.96e+00 150 |
2.67e-04 110 |
|
AS_A_RF45_Q_PIT |
6.82e+01 150 |
1.29e+01 4 |
2.05e+01 -3.1 |
8.15e+01 6.1 |
6.6e-01 -140 |
5.7e+01 -47 |
6.7e+01 -74 |
7.08e+01 150 |
1.26e+03 150.0 |
8.4e-04 5 |
7.3e-01 -29 |
4.9e-04 -88 |
|
AS_B_DC_PIT |
7.20e-03 -48 |
3.64e-03 -180 |
2.02e-03 4 |
3.2e-04 -160 |
1.65e-02 4 |
6.1e-03 140 |
4.8e-03 93 |
9.2e-03 -15 |
1.19e-01 -30 |
5.1e-07 140 |
1.96e-03 140 |
2.5e-07 100 |
|
AS_B_RF36_I_PIT |
8.0e+00 -120 |
1.46e+01 1 |
1.49e+01 170 |
4.1e-01 170 |
9.43e+01 -180.0 |
2.49e+01 -23 |
1.9e+01 170 |
6.3e+00 160 |
1.3e+01 -160 |
5.08e-03 -54 |
2.51e+01 -31 |
7.1e-04 -74 |
|
AS_B_RF36_Q_PIT |
3.22e+02 140.0 |
2.7e+00 -81 |
7.62e+00 150 |
2.6e-01 11 |
8.4e-01 52 |
4.0e+00 -93 |
7.3e+00 14 |
9.95e+01 -35 |
9.00e+01 140 |
5.60e-03 -25 |
4.56e+00 -53 |
1.7e-03 100 |
|
AS_B_RF45_I_PIT |
4.17e+01 150 |
8.94e-01 130 |
2.15e+00 -33 |
2.57e-01 120 |
1.39e+00 0 |
3.83e+01 91 |
5.17e+01 94 |
2.30e+01 -40 |
4.59e+01 -65 |
3.86e-04 -78 |
2.19e+00 -28 |
2.42e-04 -81 |
|
AS_B_RF45_Q_PIT |
4.55e+01 -50 |
1.66e+01 180.0 |
8.28e+00 3 |
3.9e+00 -170 |
6.86e+01 6 |
9.4e+01 120 |
1.17e+02 97 |
7.27e+01 -37 |
1.13e+03 -28 |
8.4e-04 100 |
5.47e+00 140 |
8.9e-04 110 |
|
AS_C_PIT |
4.93e-03 -82 |
2.12e-03 180 |
3.97e-03 -1 |
1.4e-04 -160 |
6.2e-05 130 |
2.9e-03 -150 |
5.2e-03 -84 |
1.8e-03 19 |
4.21e-02 -26 |
3.54e-07 130 |
1.96e-03 140 |
2.02e-07 100 |
|
REFL_A_DC_PIT |
2.1e-02 83 |
2.3e-04 66 |
7.3e-03 73 |
4.1e-04 -150 |
5.6e-03 0 |
1.2e-02 -110 |
7.3e-02 160 |
5.9e-02 -75 |
2.3e-01 -70 |
2.6e-06 130 |
2.74e-03 150 |
1.94e-05 -84 |
|
REFL_A_RF9_I_PIT |
2.7e+01 -59 |
1.9e-01 -120 |
1.8e+00 170 |
2.8e-01 -140 |
2.8e+00 -170 |
1.7e+01 -23 |
1.63e+02 -26 |
2.1e+01 36 |
9.0e+01 80 |
3.3e-03 150 |
1.00e+01 -30 |
2.59e-01 -81.0 |
|
REFL_A_RF9_Q_PIT |
3.8e+00 110 |
1.1e-01 -15 |
7.9e-01 90 |
1.4e-01 -120 |
1.8e-01 -150 |
8.0e+00 -52 |
4.4e+01 -26 |
7.3e+00 -81 |
2.3e+01 31 |
1.2e-03 140 |
1.0e+00 140 |
5.25e-02 -81 |
|
REFL_A_RF45_I_PIT |
4.9e+01 -170 |
3.3e+00 130 |
1.5e+01 -58 |
7.1e-02 -35 |
4.5e+00 160 |
2.7e+01 100 |
1.9e+02 -28 |
6.9e+01 78 |
1.2e+02 120 |
1.67e-02 150.0 |
1.05e+01 150 |
2.18e-01 -82 |
|
REFL_A_RF45_Q_PIT |
3.0e+01 -110 |
6.6e-01 73 |
2.3e+00 130 |
6.9e-02 -140 |
5.4e-01 -75 |
4.4e+00 -92 |
3.3e+01 -25 |
4.4e+00 -32 |
1.2e+01 28 |
1.6e-03 8 |
3.5e+00 120 |
4.36e-02 -78 |
|
REFL_B_DC_PIT |
1.3e-02 2 |
1.6e-04 -110 |
6.3e-04 88 |
2.6e-04 -170 |
1.9e-03 -100 |
1.1e-02 -25 |
3.8e-02 180 |
2.1e-02 -93 |
1.8e-02 -130 |
7.1e-07 0 |
1.37e-03 -32 |
8.1e-06 100 |
|
REFL_B_RF9_I_PIT |
3.8e+01 -11 |
5.3e-01 11 |
1.1e+00 47 |
2.1e-01 120 |
2.0e+00 -53 |
4.2e+01 -25 |
1.59e+02 -24 |
2.9e+01 -97 |
3.4e+01 -48 |
1.16e-02 -68 |
2.83e+01 -32.0 |
2.02e-01 97 |
|
REFL_B_RF9_Q_PIT |
8.0e+00 -5 |
1.6e-01 160 |
5.0e-01 18 |
6.4e-02 120 |
5.6e-01 -39 |
8.0e+00 -26 |
2.7e+01 -24 |
5.0e+00 -120 |
6.5e+00 -88 |
2.90e-03 -63 |
5.47e+00 -31 |
5.49e-02 98 |
|
REFL_B_RF45_I_PIT |
2.6e+01 -170 |
2.2e+00 -5 |
8.6e+00 120 |
1.9e-01 140 |
2.4e+00 -37 |
1.4e+01 -52 |
1.59e+02 -23 |
4.2e+01 -100 |
5.6e+01 -64 |
8.4e-03 -40 |
1.92e+01 150 |
1.78e-01 97 |
|
REFL_B_RF45_Q_PIT |
4.2e+01 110 |
3.6e+00 -51 |
8.94e+00 140 |
5.1e-02 180 |
8.6e-01 -79 |
2.1e+00 -170 |
6.32e+01 -26 |
1.3e+01 -110 |
8.8e+00 68 |
7.08e-03 -24 |
9.12e+00 160 |
6.46e-02 97 |
|
POP_A_PIT |
3.4e-04 150 |
1.46e-05 9 |
1.0e-05 61 |
1.4e-06 120 |
3.0e-05 170 |
1.5e-04 -46 |
3.45e-03 -26 |
1.8e-04 25 |
1.1e-03 -180 |
1.61e-07 120 |
1.87e-04 150 |
7.59e-08 100 |
|
POP_B_PIT |
3.1e-04 -45 |
9.3e-06 -170 |
1.9e-05 -39 |
2.6e-06 -120 |
3.4e-06 -50 |
9.4e-05 -94 |
1.72e-03 150 |
2.1e-04 170 |
9.2e-04 24 |
3.41e-07 120 |
1.28e-04 -33 |
1.21e-07 99 |
|
X_TR_A_PIT |
1.0e-04 43 |
4.3e-06 -28 |
1.6e-05 79 |
2.0e-05 11 |
4.3e-05 -76 |
3.8e-05 -170 |
5.74e-03 150 |
8.8e-05 160 |
5.74e-03 160 |
4.4e-09 -170 |
1.73e-05 150 |
8.9e-09 25 |
|
X_TR_B_PIT |
7.6e-05 97 |
1.7e-06 -9 |
1.3e-05 22 |
1.7e-05 13 |
7.7e-06 -93 |
1.9e-04 160 |
5.36e-03 150 |
2.3e-04 150 |
5.36e-03 150 |
2.4e-10 15 |
1.55e-05 150 |
3.7e-09 25 |
|
Y_TR_A_PIT |
5.7e-05 110 |
5.63e-06 170 |
6.6e-06 130 |
2.36e-05 -170 |
4.3e-06 -120 |
4.02e-04 150 |
5.17e-03 150 |
3.64e-04 -34 |
5.17e-03 -31 |
3.0e-09 -86 |
1.78e-05 140 |
1.1e-08 63 |
|
Y_TR_B_PIT |
3.7e-05 12 |
4.31e-06 170 |
1.9e-06 170 |
1.20e-05 -180 |
4.1e-06 -170 |
8.23e-04 150 |
8.42e-04 150 |
8.42e-04 -32 |
9.19e-04 -37 |
3.8e-09 -34 |
4.56e-06 130 |
1.1e-08 73 |
|
AS_A_RF90_PIT |
1.9e-02 -34 |
7.6e-04 -180 |
1.2e-03 -22 |
2.6e-03 16 |
2.8e-03 42 |
3.3e-02 110 |
1.1e-02 -160 |
4.8e-02 150 |
9.4e-02 -27 |
1.4e-06 -69 |
1.05e-03 160 |
1.1e-06 95 |
|
AS_B_RF90_PIT |
7.6e-03 140 |
1.4e-03 170 |
8.9e-03 12 |
4.7e-04 150 |
5.8e-03 61 |
8.4e-03 -7 |
6.1e-02 160 |
6.3e-02 -51 |
1.9e-01 -120 |
1.6e-06 -80 |
4.2e-04 130 |
1.1e-06 50 |
Sheila, Rob
The OMC locking trouble turned out to be due to highly excited violin modes saturating the whitening filters for the OMC DCPD signals.
Kiwamu, Matt
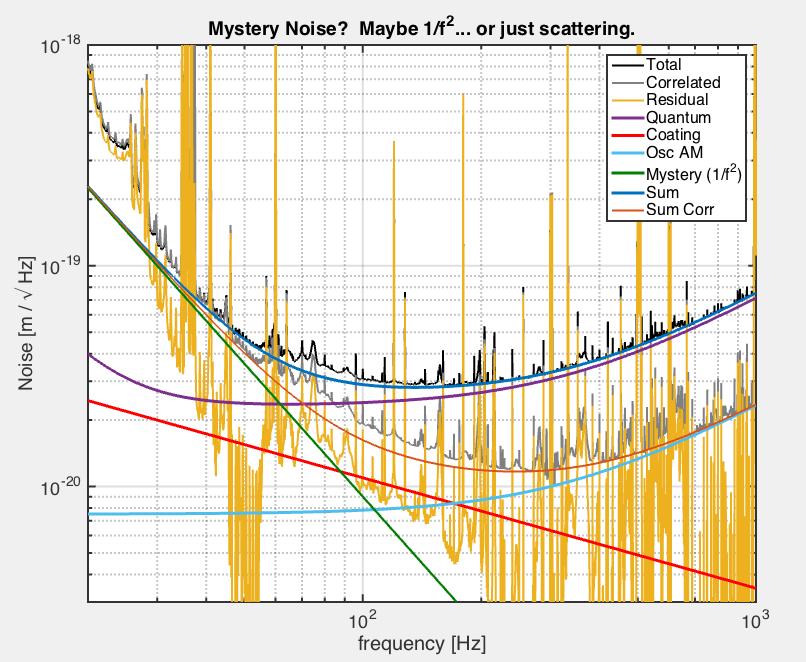
Thanks to the new cross-correlation data, we can make an updated mystery noise budget. This time, the recently remembered RF AM noise is included. There is some calibration correction required to make the uncorrelated noise flat (zero at 193Hz, pole at 215Hz), but this might be expected due to calibration drift over the run.
The curves on the attached plot are:
The conclusion is that there is no "great mystery noise" any more. It looks like the unaccounted for noise, in this simple noise budget, is mostly just scattering peaks. A 1/f2 curve is included to give the total a reasonable shape and to guide the eye, but it shouldn't be taken too seriously. (See 23350 for a real H1 budget, and 25092 for L1.)
Suggested course of action:
TITLE: 03/10 day Shift: 00:00-08:00 UTC (16:00-00:00 PST), all times posted in UTC
STATE of H1: Planned Engineering
OUTGOING OPERATOR: Ed
QUICK SUMMARY: ASC work still on going.
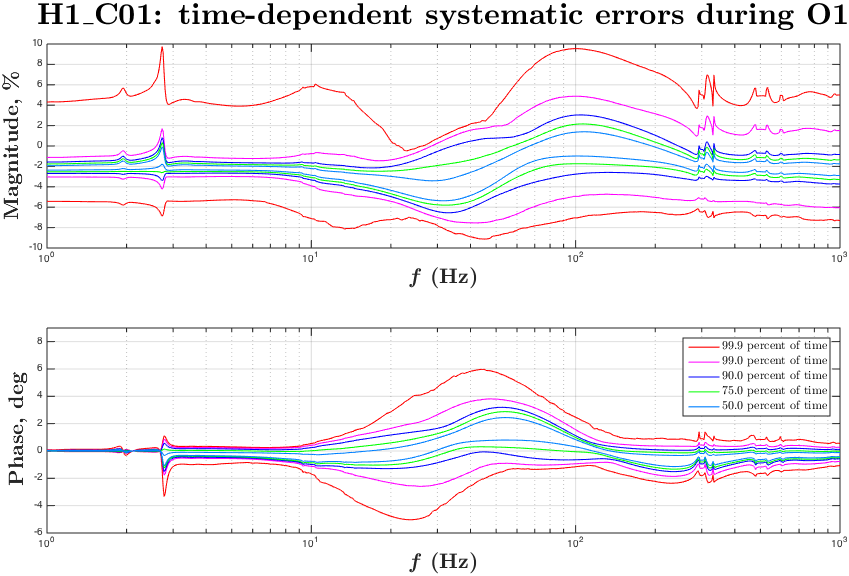
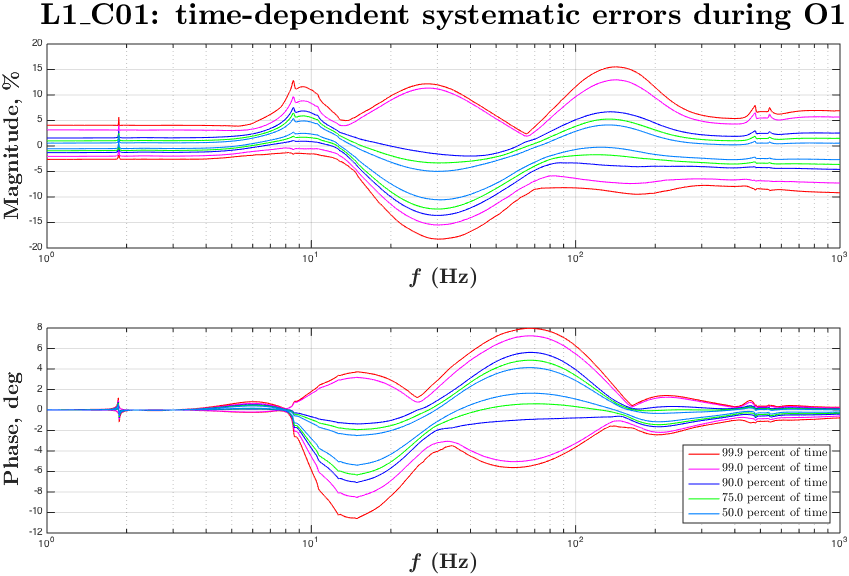
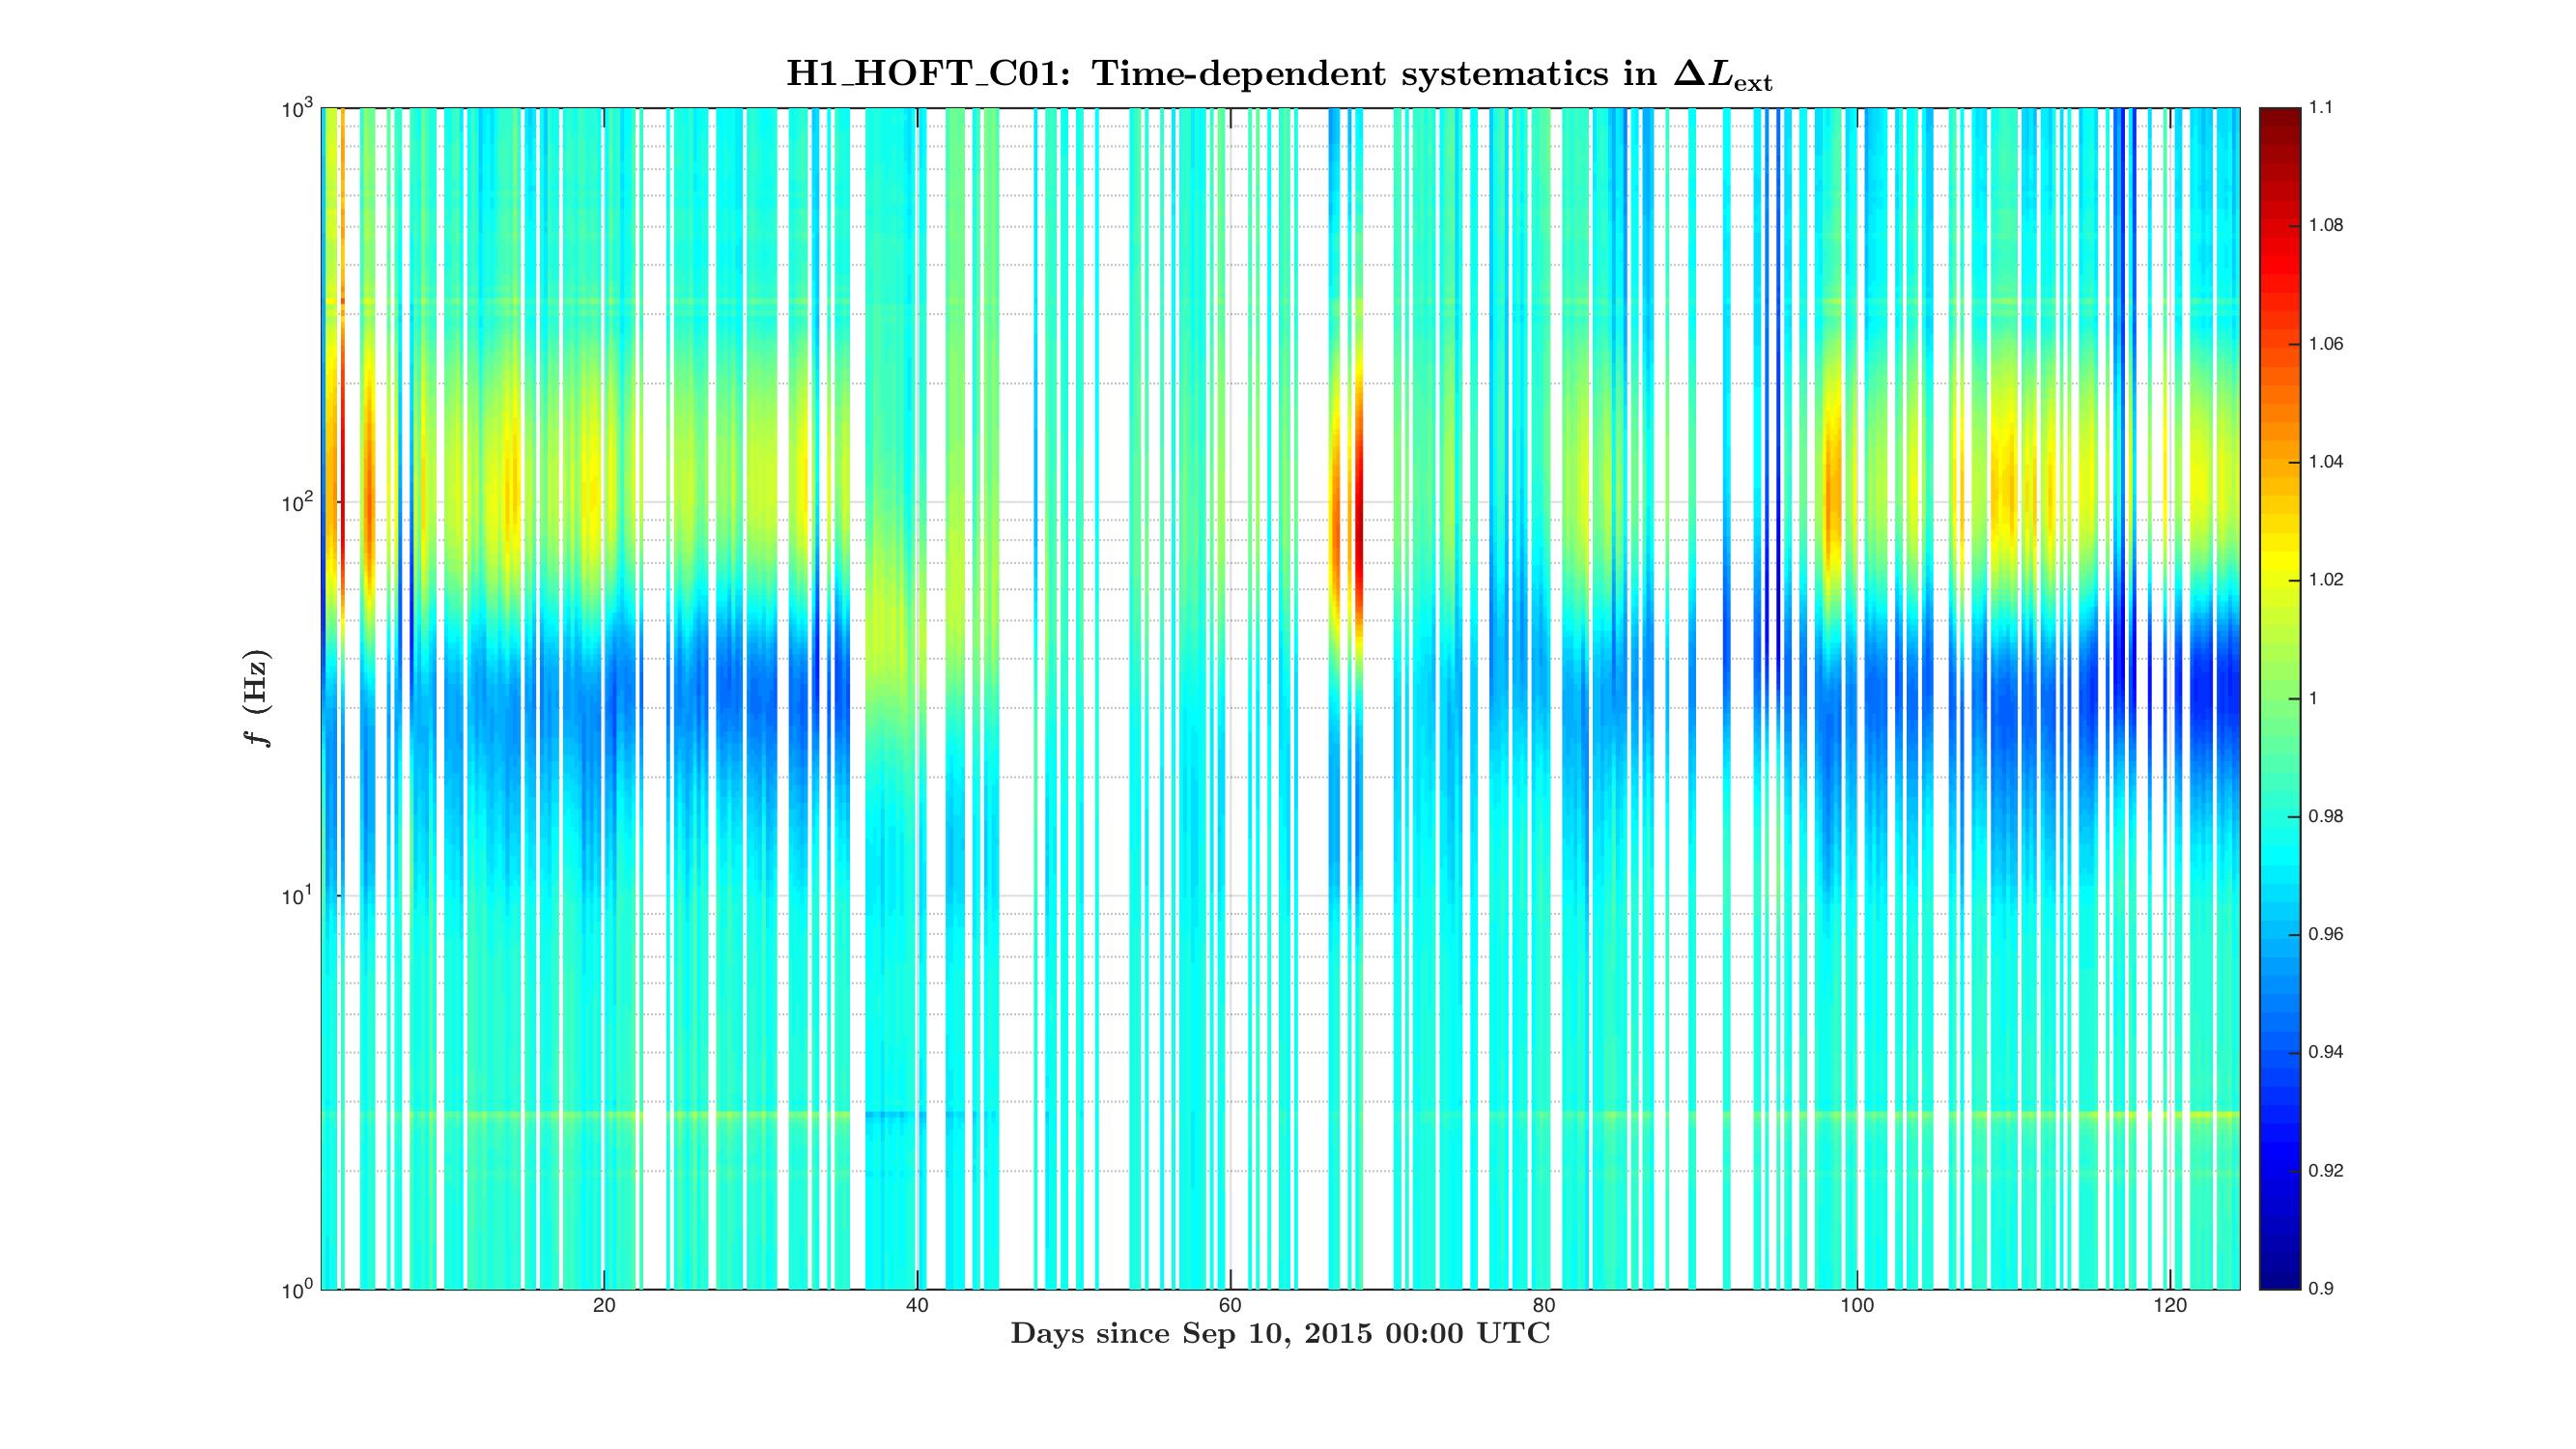
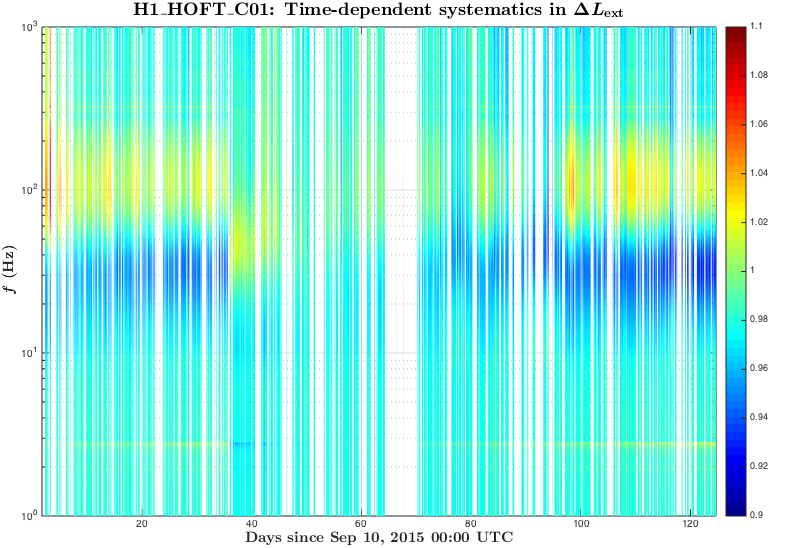
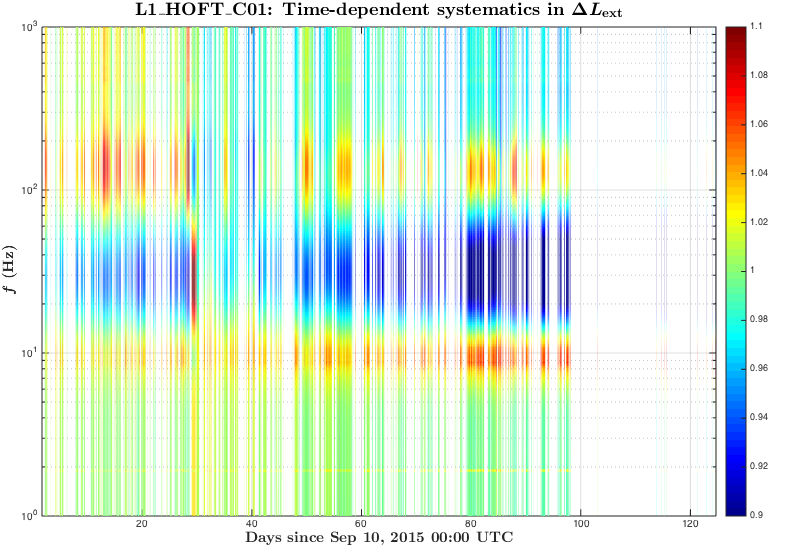
During O1 run we have monitored slow variations in the DARM actuation and sensing functions with several ~35 Hz and a ~350 Hz line at both observatories.
Systematics in the actuation function mostly affect systematic errors at frequencies below UGF, while systematics in the sensing mostly show up at higher frequencies.
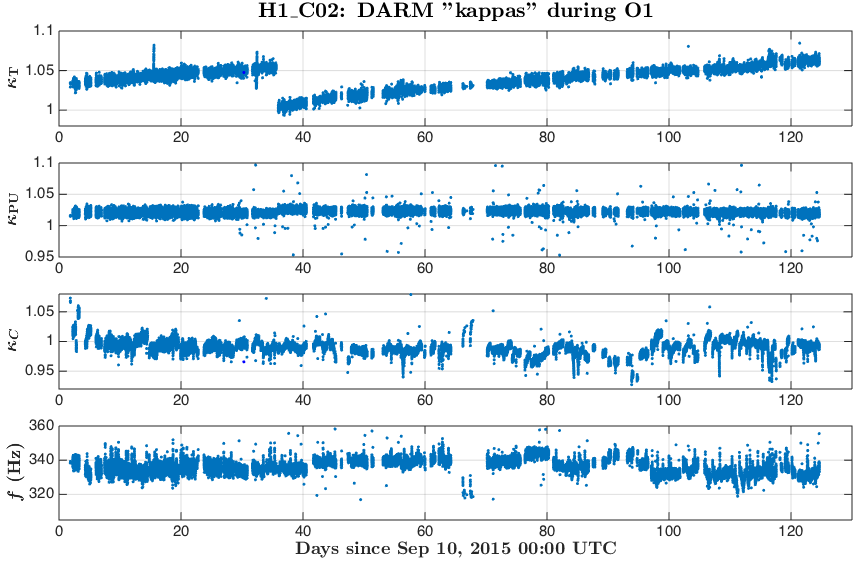
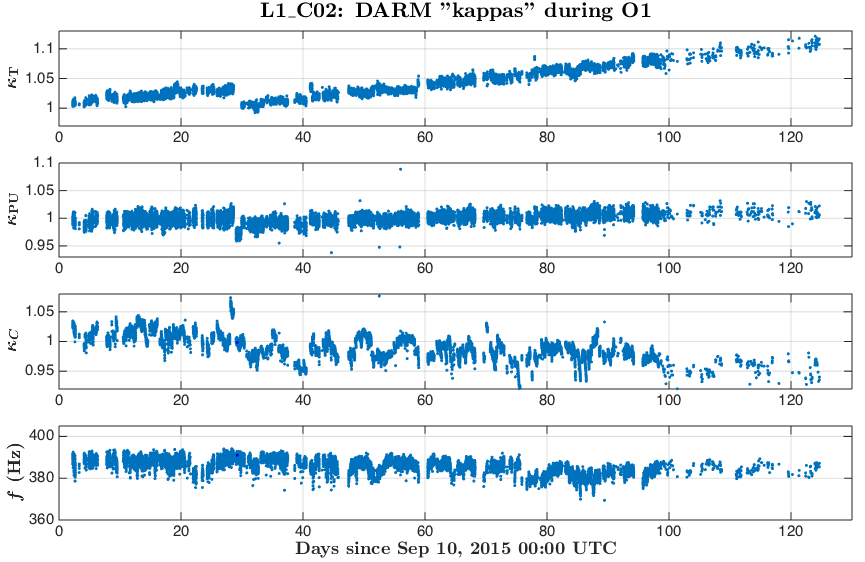
Variation in the DARM sensing is parametrized with an overall sensing gain κC and a cavity pole frequency fC. Most dramatic changes in both of these parameters appear in the beginning of locks, which could be a result of changing of cavity modes due to thermal heating of test masses and possibly some other effects.
Variation in the DARM actuation is parametrized with κTST and κPU. The κTST is a scalar gain factor of the ESD driver actuation which drives only the TST stage. We believe that it changes mostly due to charge accumulation on the surface of an ETM. The κPU is a scalar gain factor of the actuation functions of the upper stages PUM and UIM. The coil-drivers as used to for actuation of these stages. We do not believe that κPU should change over time, but monitoring it helps to make sure that we do not miss any slow variations that we did not account for.
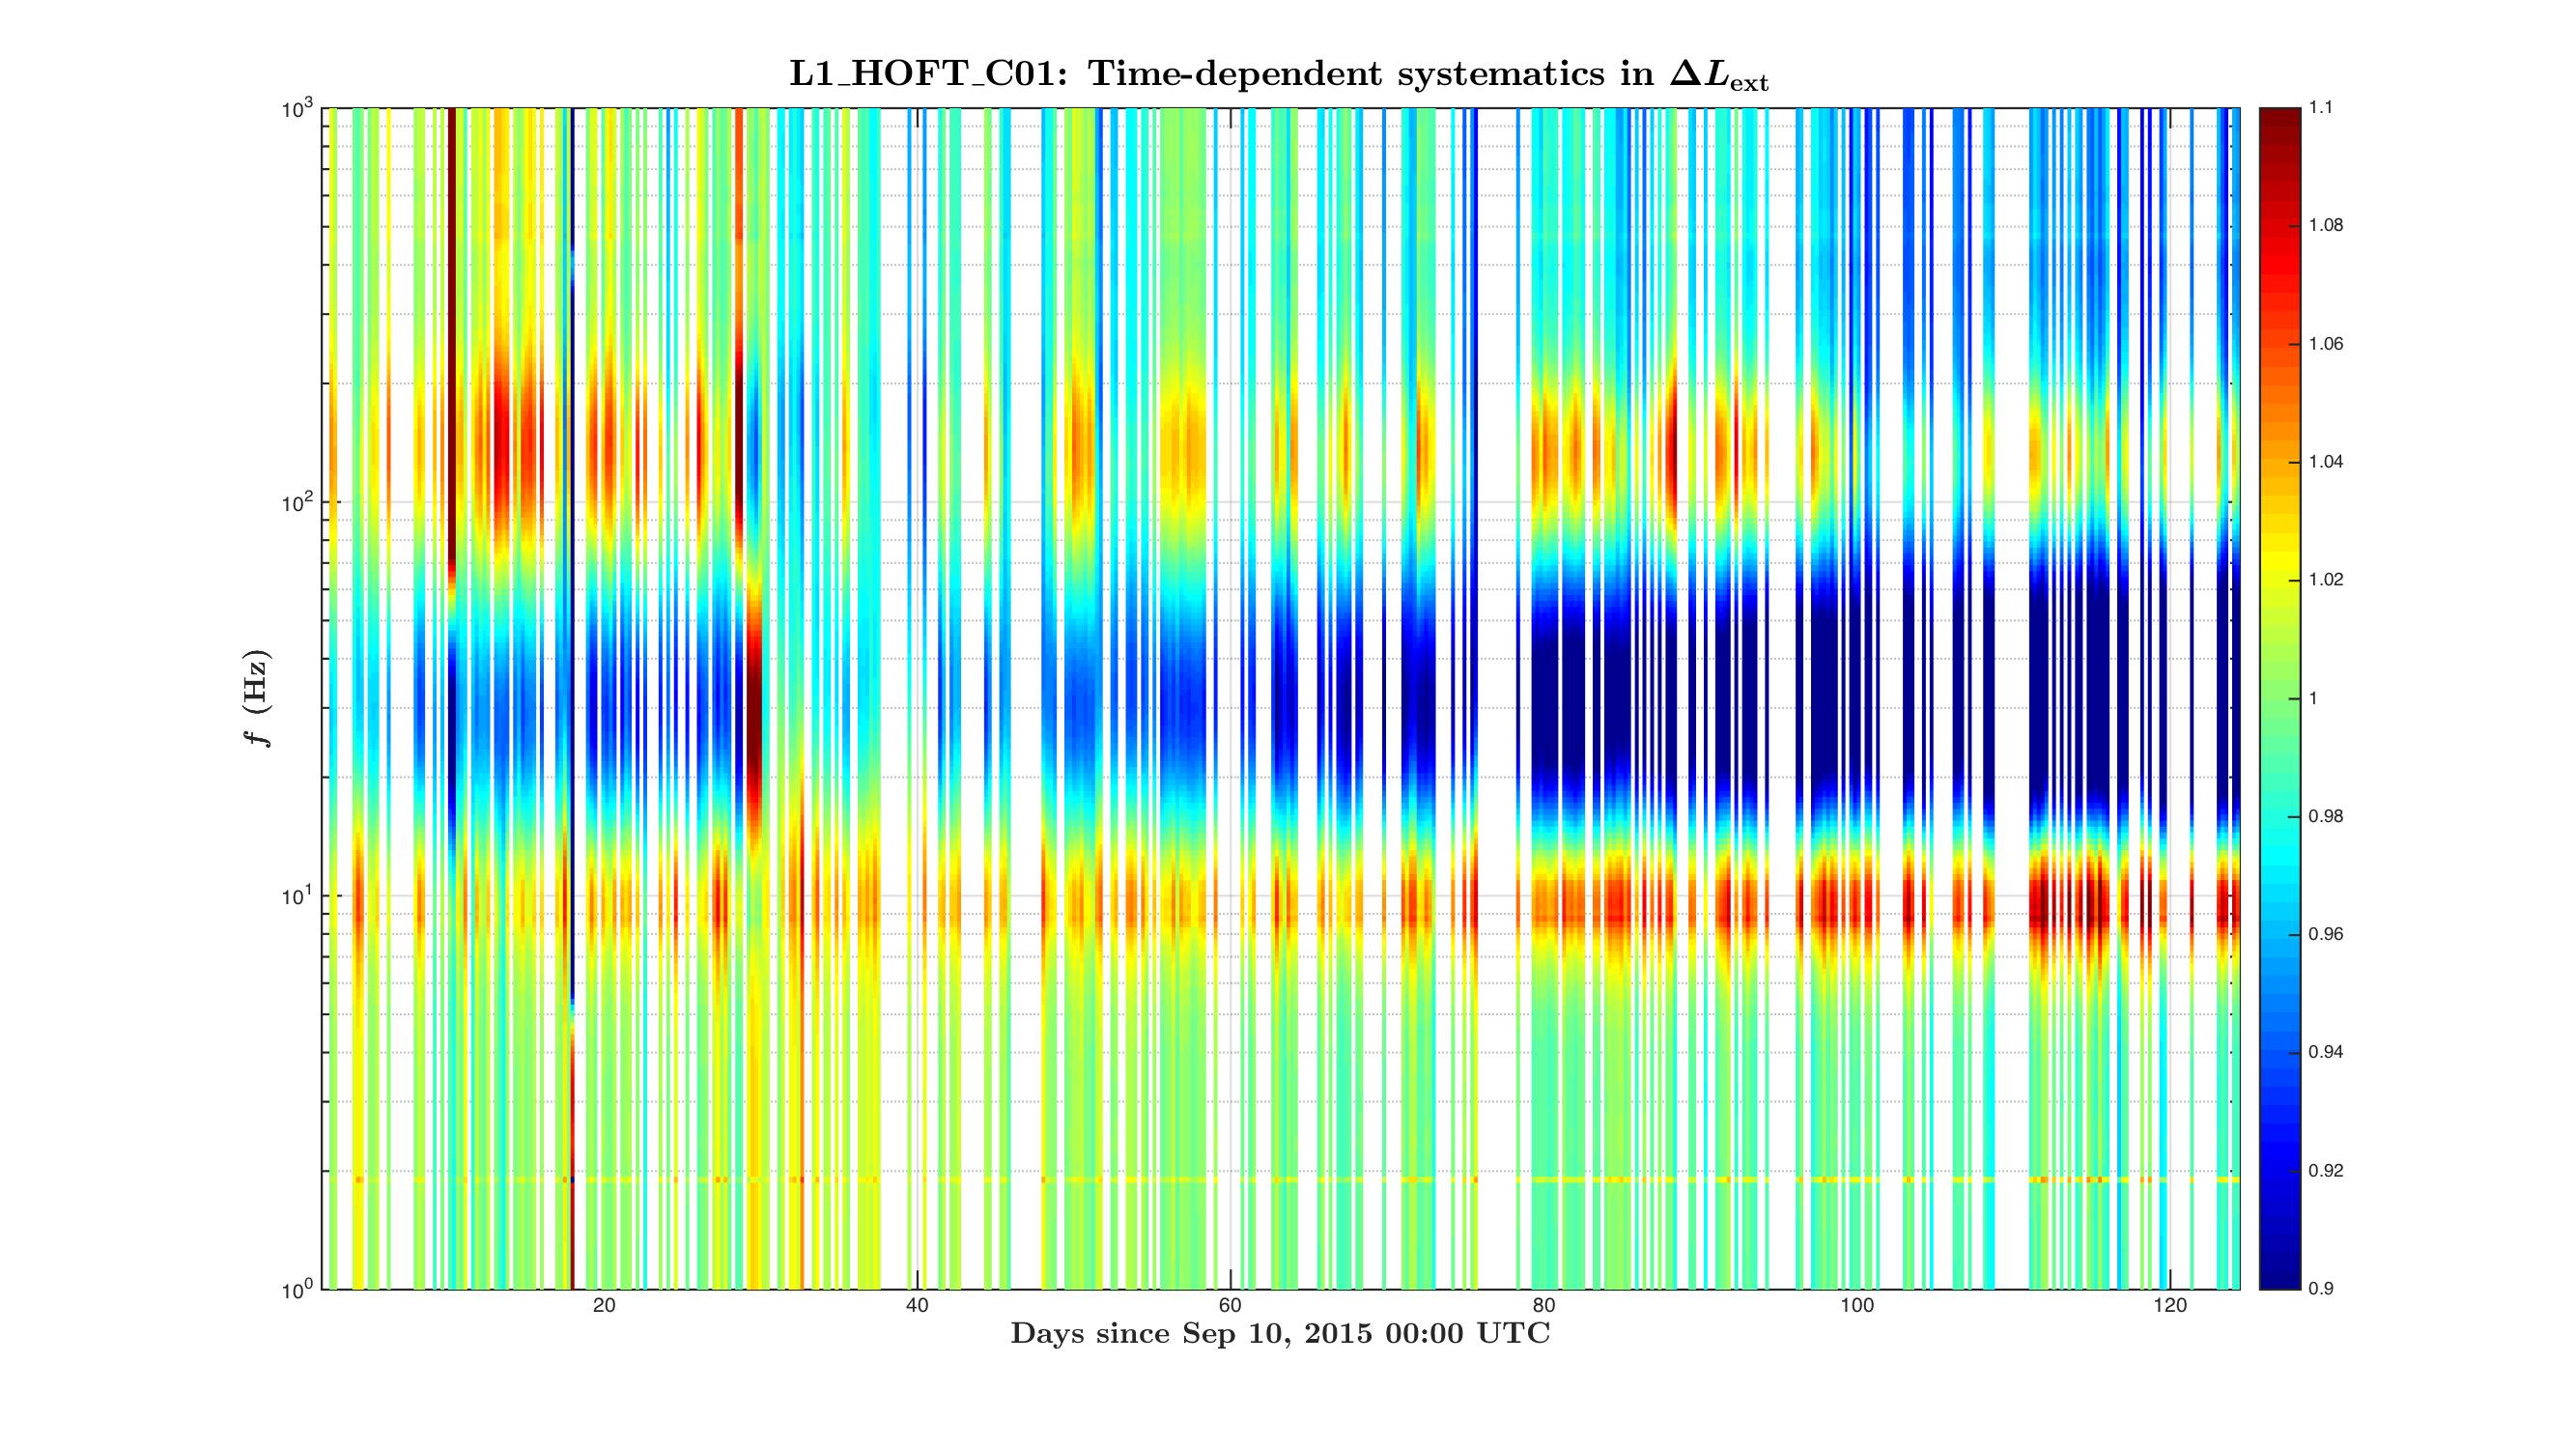
Time-frequency plots of the known time-depedent systematics in the overall DARM response function calculated from κTST, κPU, κC and fC in O1 run are attached.
Update: replaced figures (portrait -> landscape orientation) for convenience.
Summary
Details
The time-frequency plots of the time-dependent systematic errors in the reconstructed ΔLext and plots of "kappa" values during O1 are attached to this report.
The state vector in C01 seemed to give a noisier set of values, to filter out "good data points" for these plots we have used the state vector from C02 frames, and 128 second median values from C01 frames for kappas.
The median kappa values are taken from the values extracted from C01 are saved to CalSVN:
Runs/O1/$(IFO)/Measurements/TimeDependence/20160301_C01_kappas_AllOfO1/kappa_C01_$(IFO)_all_wStateVector.txt
From C02 we took a single value every 128 seconds (without taking any average or median), these values are saved to
Runs/O1/$(IFO)/Measurements/TimeDependence/20160301_C02_kappas_AllOfO1/kappa_C02_$(IFO)_all_wStateVector.txt
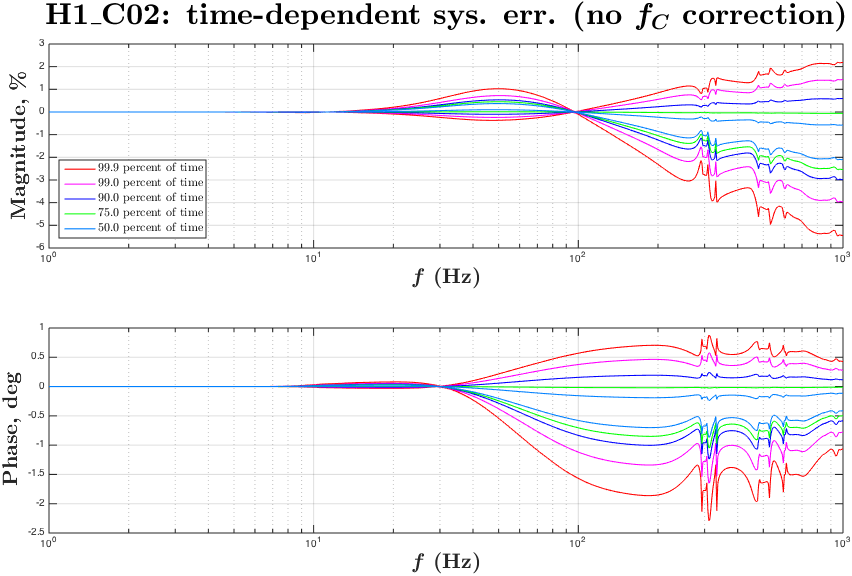
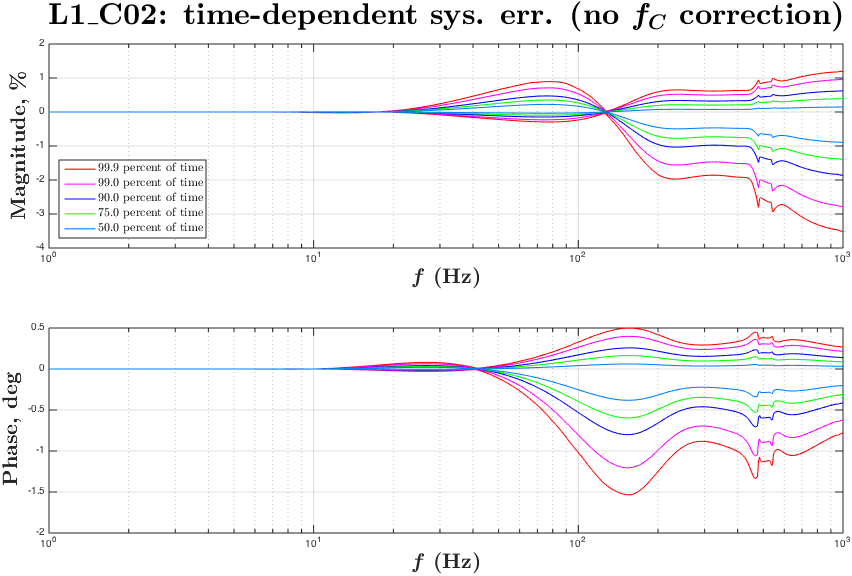
We have produced a plot of systematic uncertainty boundaries for 50%, 75%, 90%, 99%, ~100% of the cases in O1 when HOFT_OK was 1.
This information or similar analysis can be used to set a 1-sigma uncertainty bars on the time-dependent systematics in C01 due to uncorrected kappas (the values were taken only for times when all of the KAPPA*_OK and HOFT_OK were 1).
The plots for C02 give an estimation of time-dependent systematic errors caused by not correcting fC.