kyle.ryan@LIGO.ORG - posted 10:03, Thursday 25 February 2016 (25714)
Soft-cycled GV5 and GV7 for 5-Ton crane load
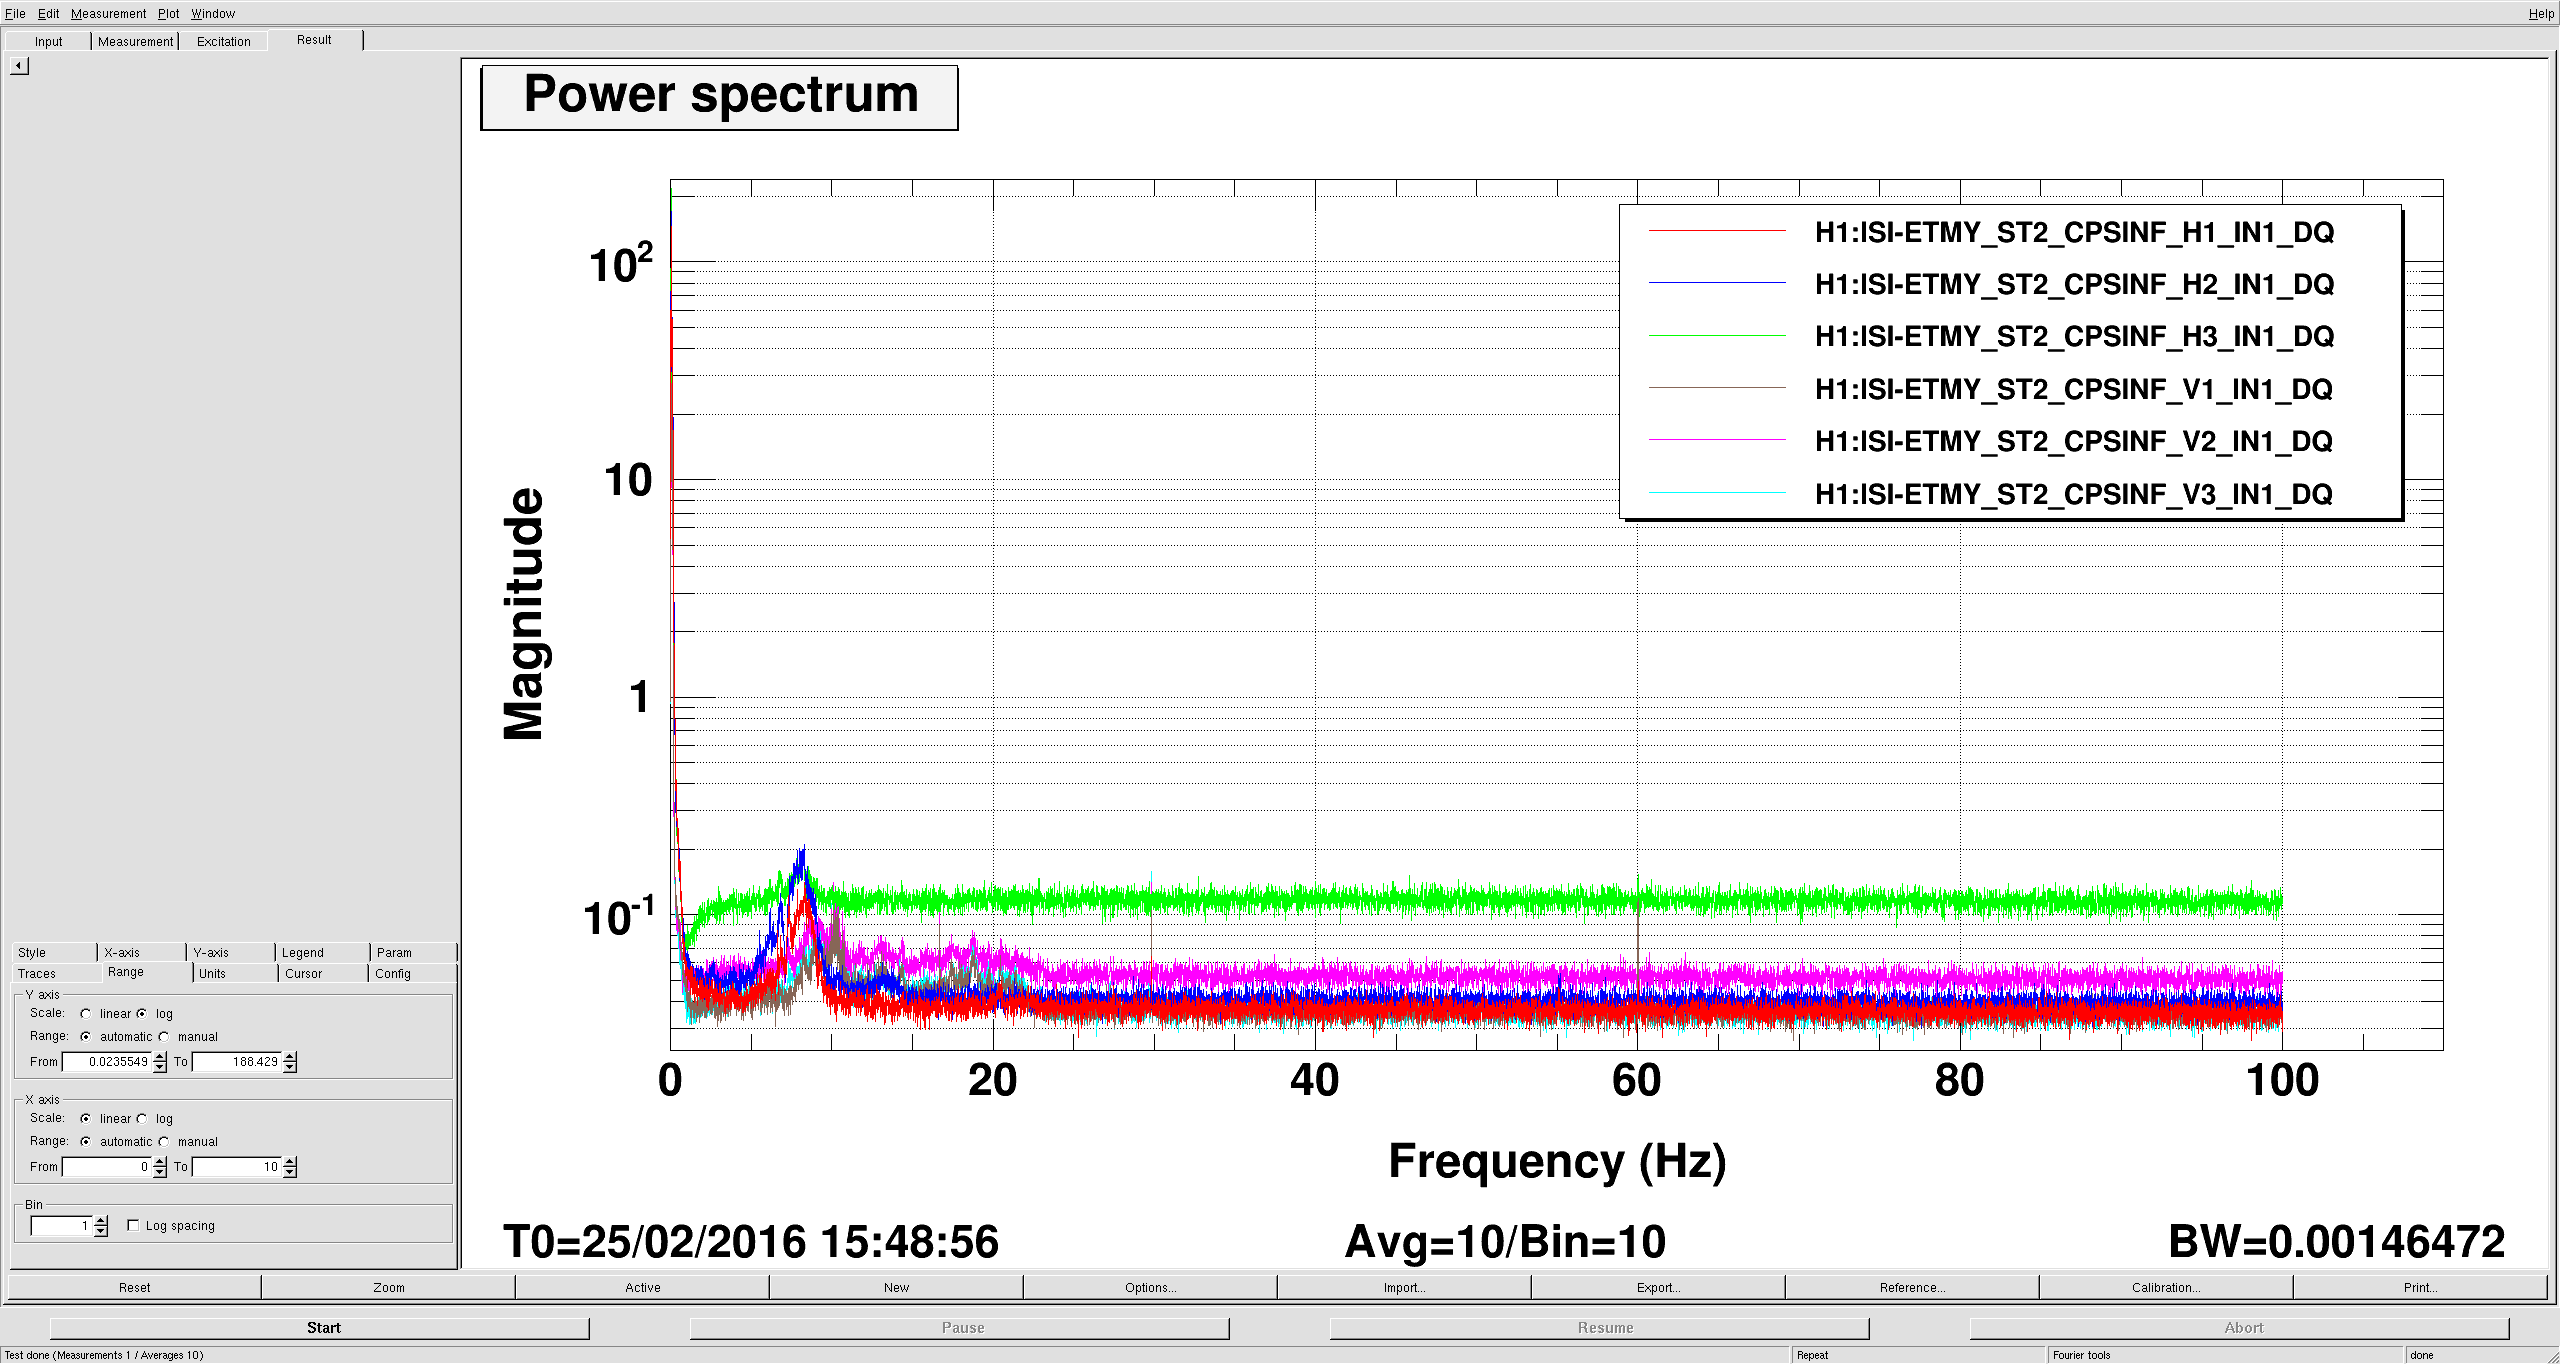
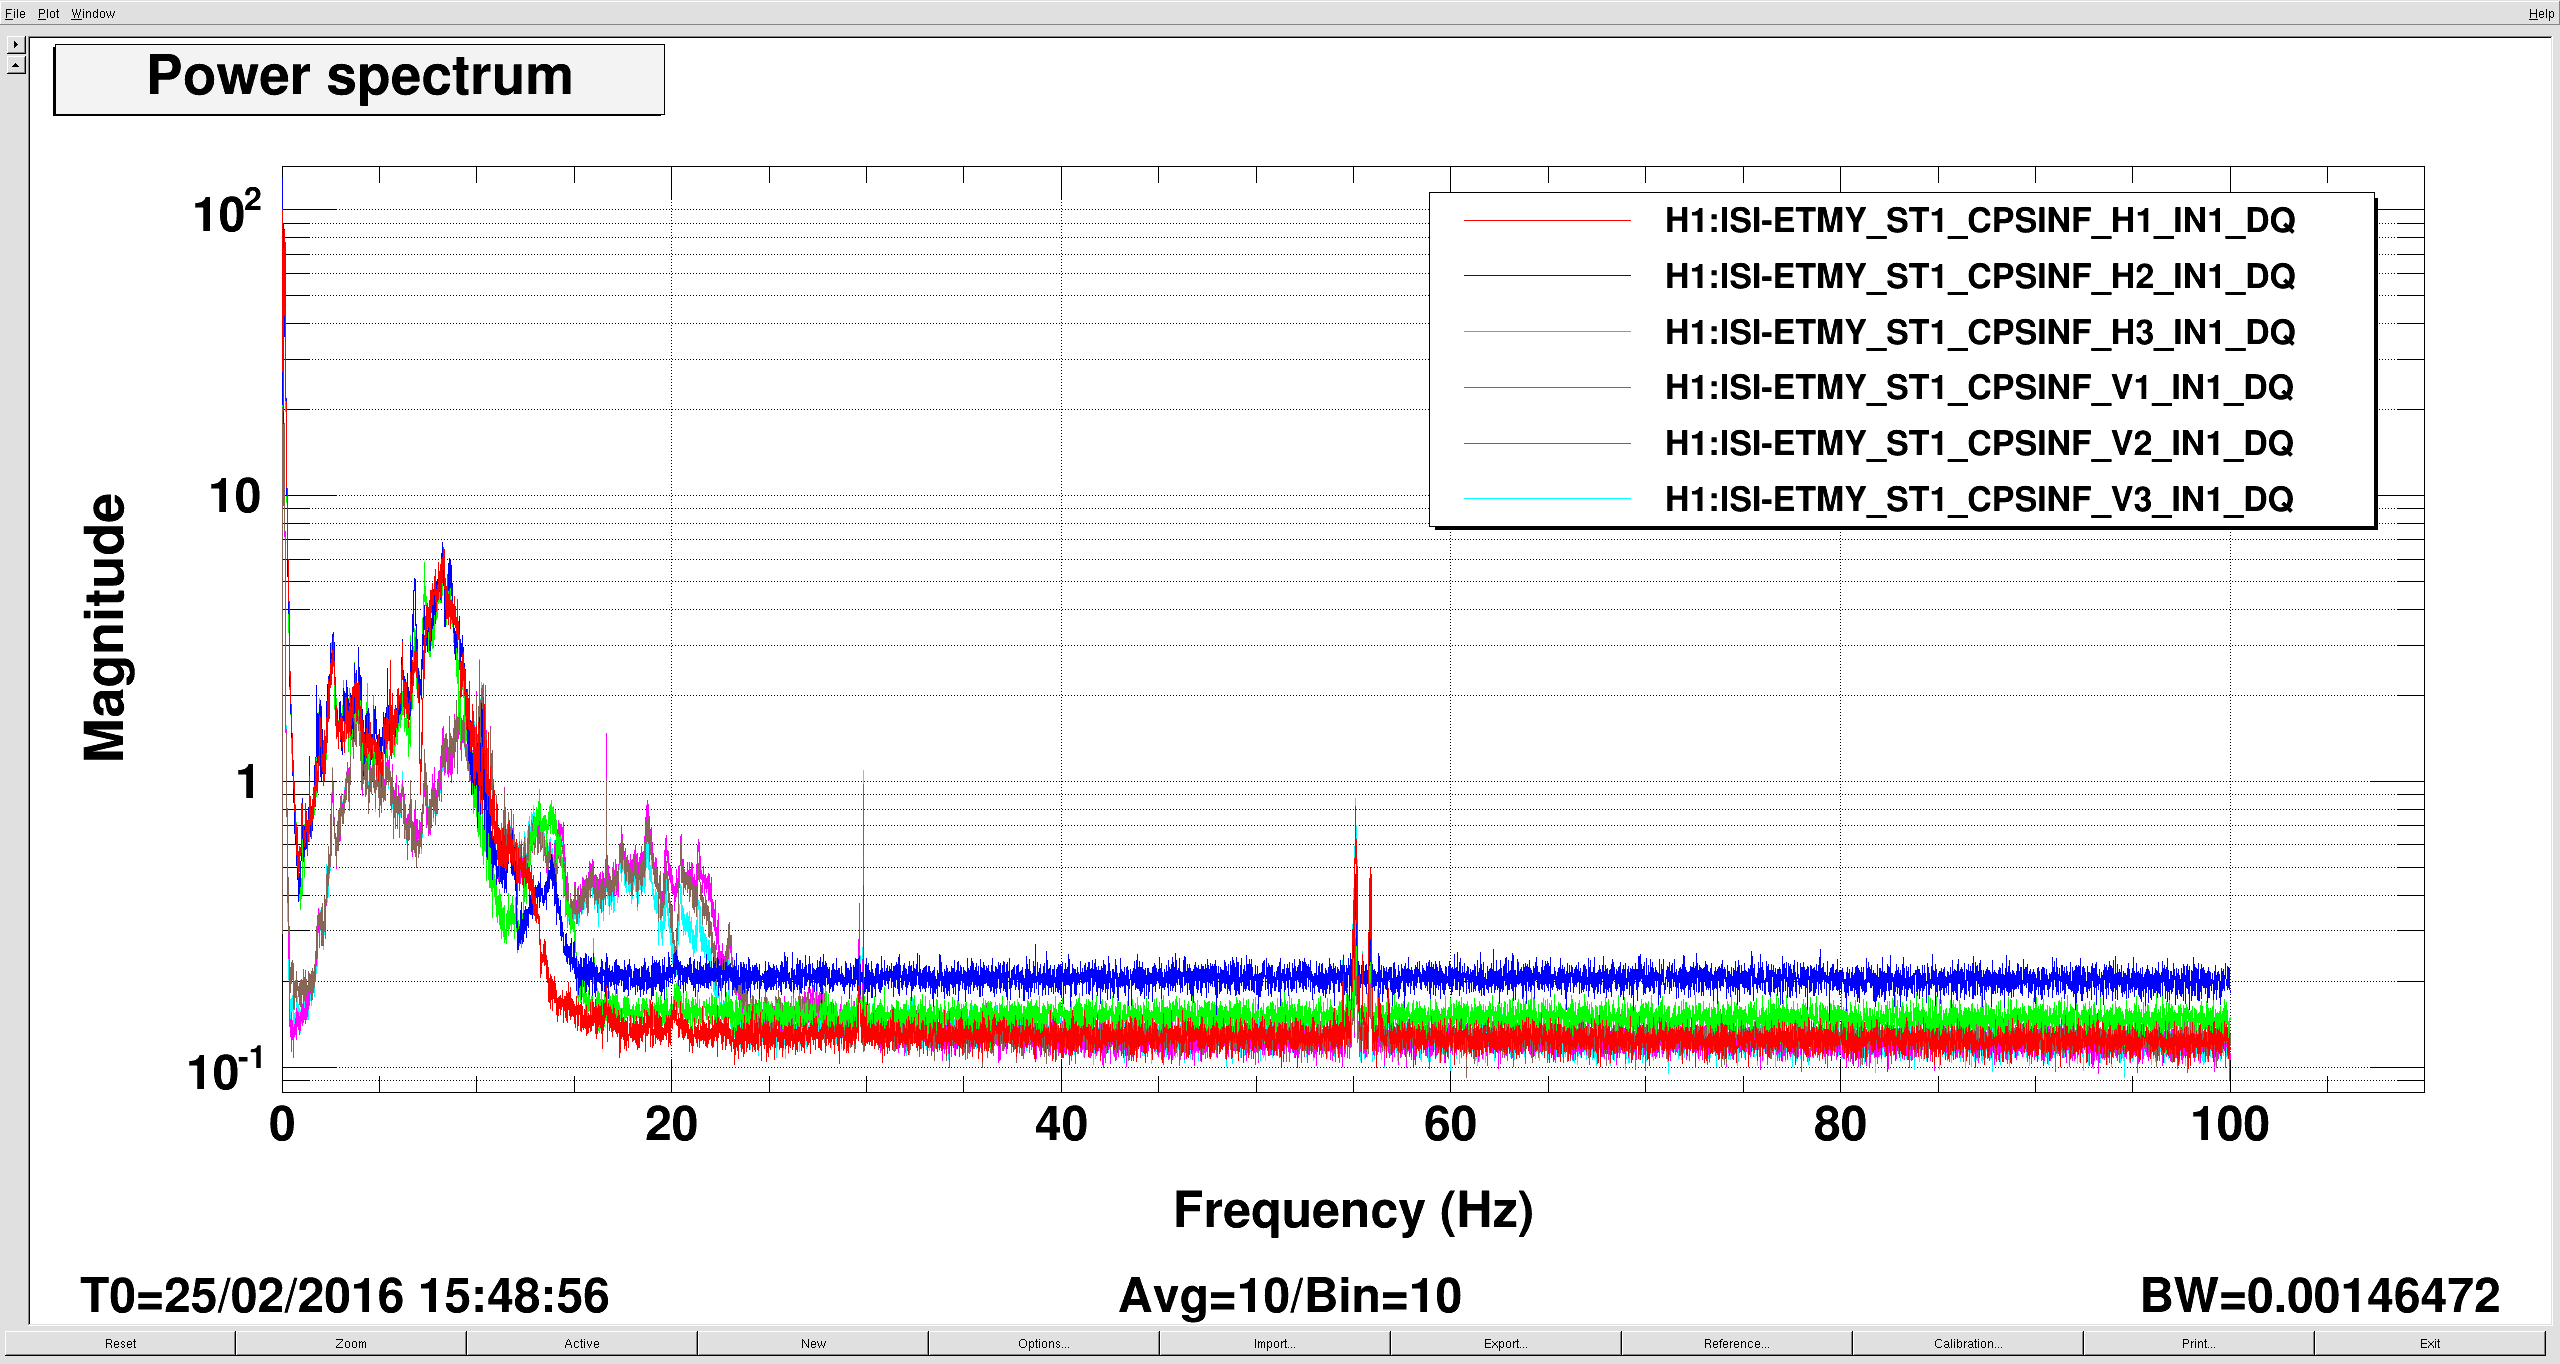
Looks like there is a failing CPS at ETMY. I noticed on the Detchar sumary page, ETMY was not performing as well as the other BSCs above 1 hz, and has been for a little while (since about Feb 2nd). When I started looking at spectra, I saw that the Y CPS blend in was high at high frequency, digging down to individual sensors, it looks like ST2 H3 is to blame. LLO had a similar failure last year sometime. We should be able to stick a new card in and still run okay, or maybe we just need to check some connections. Probably not a big deal for now, but we should address this soon. Attached plots shows the CPS for St2 (first plot) and St1(second). Green on the first plot is the bad sensor. The St1 sensors look okay, though H2 (blue, second plot) looks a little high as well.
FRS 4424
WP 5744, II 1206, FR 4418
Code oversite fixed. Guardian restarted. All HPIs are good. Tested on HAM6, positive function. ISI guardians not restarted--should do next Tuesday to confirm no issues there.
files updated:
hugh.radkins@operator3:~ 0$ userapps
hugh.radkins@operator3:release 0$ cd isi/common/guardian/
hugh.radkins@operator3:guardian 0$ svn up
U isiguardianlib/isolation/const.py
U isiguardianlib/isolation/states.py
U isiguardianlib/damping/states.py
Updated to revision 12715.
Here are the changes and additions to fix the oversite
hugh.radkins@operator3:guardian 0$ diff isiguardianlib/damping/states.py isiguardianlib/damping/states.pybuhr
> if (iso_const.ISOLATION_CONSTANTS['SWITCH_GS13_GAIN']) & (top_const.CHAMBER_TYPE != 'BSC_ST1'):
< if (iso_const.ISOLATION_CONSTANTS['SWITCH_GS13_GAIN']) & (top_const.CHAMBER_TYPE != 'BSC_ST1') & (top_const.CHAMBER_TYPE != 'HPI'):
---
hugh.radkins@operator3:guardian 1$ diff isiguardianlib/isolation/const.py isiguardianlib/isolation/const.pybuhr
139,144d138
< GS13_GAIN_DOF = ['H1', 'H2', 'H3', 'V1', 'V2','V3'],
< SWITCH_GS13_GAIN = False,
< FF_DOF = dict(
< FF = [],
< HPI_FF = [],
< ),
hugh.radkins@operator3:guardian 1$ diff isiguardianlib/isolation/states.pybuhr isiguardianlib/isolation/states.py
319c319
< if (iso_const.ISOLATION_CONSTANTS['SWITCH_GS13_GAIN']) & (top_const.CHAMBER_TYPE != 'BSC_ST1'):
---
> if (iso_const.ISOLATION_CONSTANTS['SWITCH_GS13_GAIN']) & (top_const.CHAMBER_TYPE != 'BSC_ST1') & (top_const.CHAMBER_TYPE != 'HPI'):
321c321,322
< iso_util.turn_FF('OFF', iso_const.ISOLATION_CONSTANTS['FF_DOF'])
---
> if (top_const.CHAMBER_TYPE != 'HPI'):
> iso_util.turn_FF('OFF', iso_const.ISOLATION_CONSTANTS['FF_DOF'])
490c491
< if (iso_const.ISOLATION_CONSTANTS['SWITCH_GS13_GAIN']) & (self.has_requested_gs13_gain_switch == False) & (top_const.CHAMBER_TYPE != 'BSC_ST1'):
---
> if (iso_const.ISOLATION_CONSTANTS['SWITCH_GS13_GAIN']) & (self.has_requested_gs13_gain_switch == False) & (top_const.CHAMBER_TYPE != 'BSC_ST1') & (top_const.CHAMBER_TYPE != 'HPI'):
494c495,496
< iso_util.turn_FF('ON', iso_const.ISOLATION_CONSTANTS['FF_DOF'])
---
> if (top_const.CHAMBER_TYPE != 'HPI'):
> iso_util.turn_FF('ON', iso_const.ISOLATION_CONSTANTS['FF_DOF'])
JRPC Notes
SEI
SUS
CDS
Facilities & VAC
(45) FRS Reports ongoing, and NO new FRS reports (Vern)
Operating Mode: Engineering
LVEA Laser SAFE
H1 was not locked & Guardian was in Ready state when I walked in.
Was notified Bubba was on the floor doing some craning. Concurrent work to be done with this activity:
Switched Operating Mode: Corrective Maintenance
Evan, Den
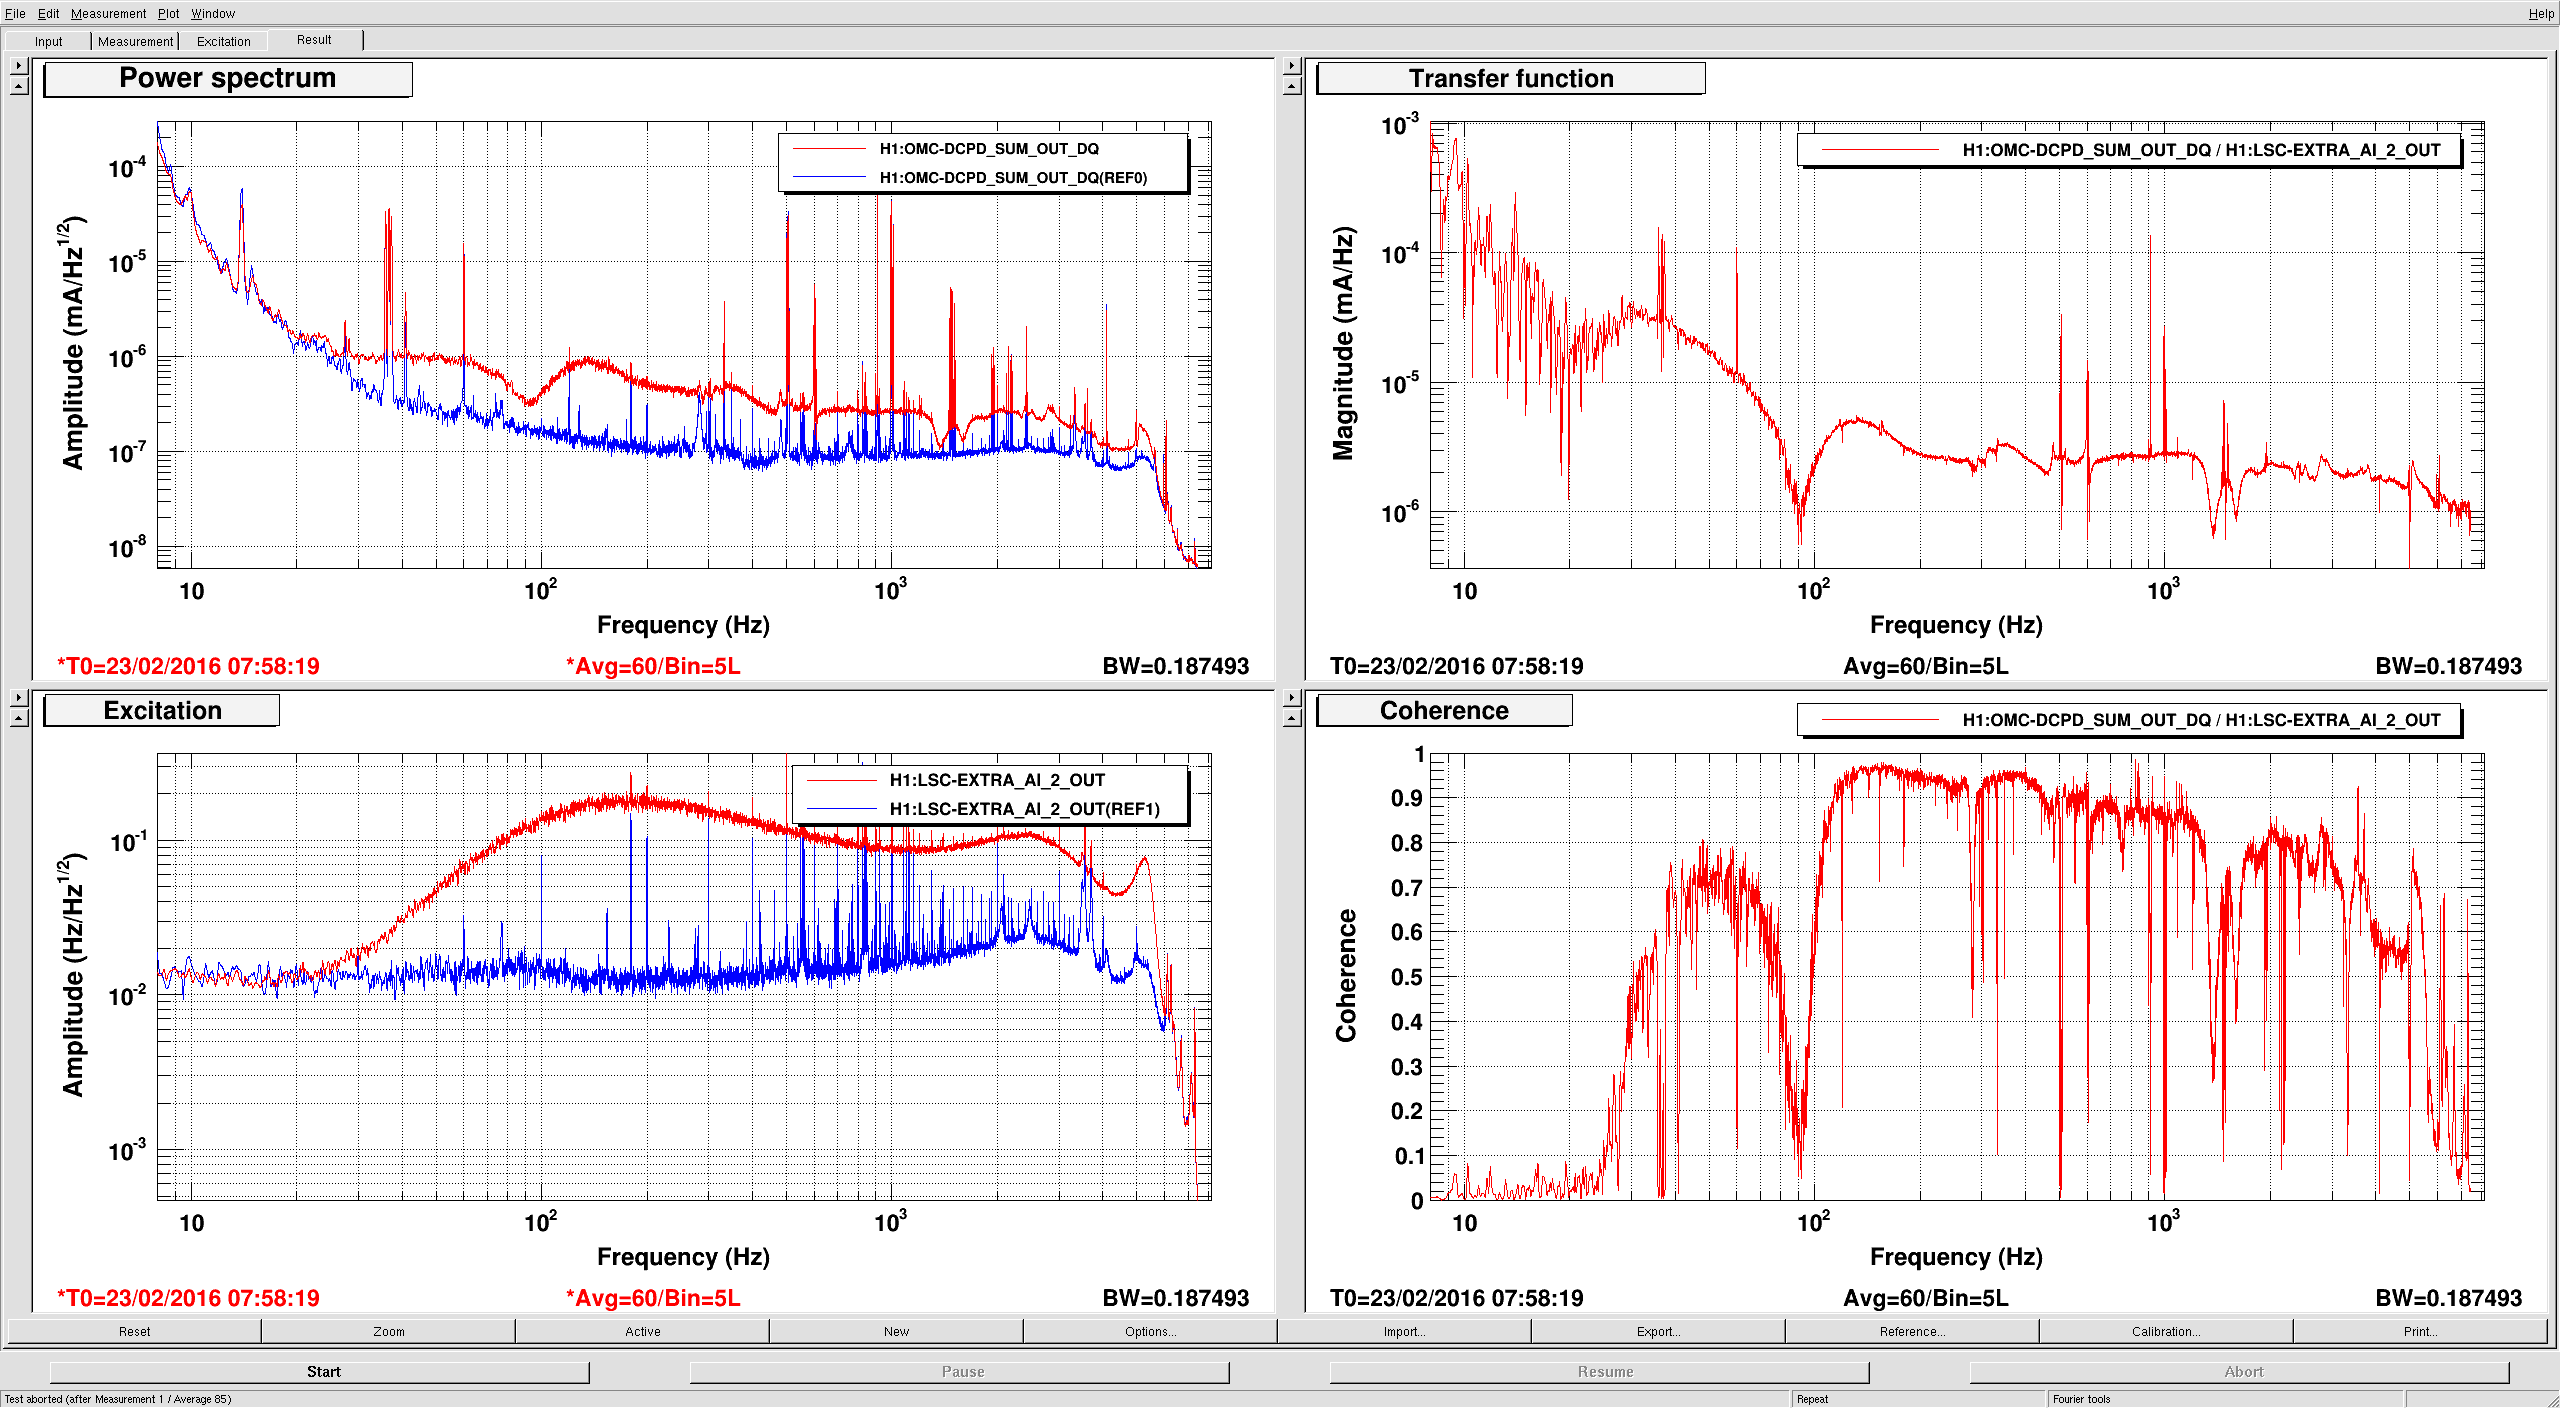
Tonight we asked ourselves a question whether 1/f (or 1/f^2) noise, seen in DARM around 100Hz, comes from the OMC or not. We put a bandstop filter to the DARM control loop at 92-127Hz and made a correlation measurement between AS 45 WFS SUM and OMC PDs at this frequency band. The idea is that if there is any OMC noise coherent between 2 OMC PDs, it should not be present at the RF detector.
Attached plot shows the results of the measurement. Cross-spectrum between WFS and OMC PDs around 100Hz is almost the same (15% lower) as cross-spectrum between two OMC PDs. We integrated for 3.5 hours and AS 45 WFS SUM channels are not DQ. We can significantly improve the measurement if we record these channels and integrate for ~20 hours.
At the current precision of the correlation we can not say that noise around 100Hz comes from the OMC. Right now it looks vice versa.
We have also measured coherence between DARM and voltage noise of +15V signal going into the vacuum. Noise level is 2uV/sqHz at 100Hz and coherence is <10-3. This noise is insignificant for the current sensitivity.
Den, which +15V signal is this that you measured?
Rich, we have measured the noise on pin 6 (+15V head 1, D1300502). This noise is highly coherent with noise on pin 2 (+15V on head 2) and partially coherent (0.4) with noise on pin 7 and 3 (-15V, head 1 and 2). For this reason, we did not measure DARM coherence with other pins.
TITLE: 2/25 eve Shift: 00:00-08:00 UTC (16:00-00:00 PST), all times posted in UTC
STATE of H1: Planned Engineering
INCOMING OPERATOR: None
QUICK SUMMARY: More commissiong work. The only to mention was that Verbal reported that Transient Injections running at 4:00UTC and then stopped at 4:43. I'm not sure if there was any injections scheduled that didn't get logged or what it might be.
Today Keita and I spent some time thinking about OMC length noise, there will be an update coming soon with more information and a noise projection.
We spent some time looking at some nonlinear behavoir noise in the drive to PZT1. Our dither frequency is 4100 Hz, and looking at the low voltage PZT monitor we can see a small 8 Hz and a larger 16 Hz comb. There is also other non stationary noise in the monitor, and a broad peak at 12.7 kHz. We have moved the dither line frequency to 4100.21 Hz, so if this was the cause of the 16 Hz comb in DARM we would now expect it to be more like a 16.84 Hz comb. Evan Goetz tells us that we need 15 minutes or more of data in low noise to evaluate if this has changed any combs in DARM.
We have just reached nominal low noise at 3:14:34 UTC Feb 25th, although the low frequency noise (below 50 Hz) is worse than normal. I've temporarily changed the dither frequency in the OMC guardian, so if there is a longer lock later tonight it should also have this changed dither frequency. (If anyone wants to double check what the dither frequency is, the channel is H1:OMC-LSC_OSC_FREQ
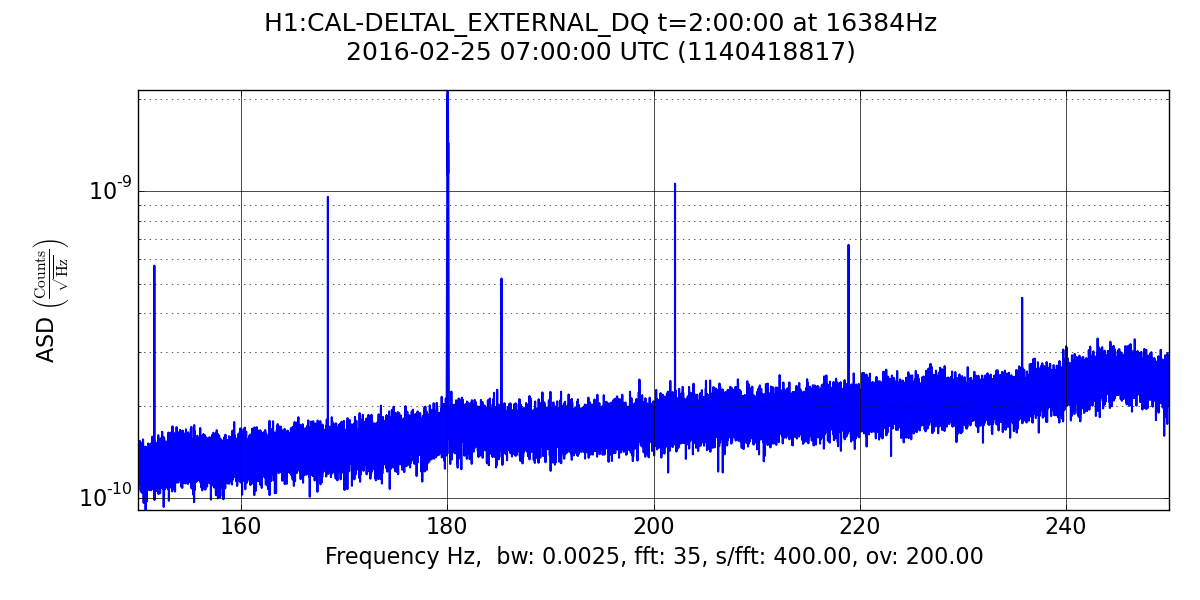
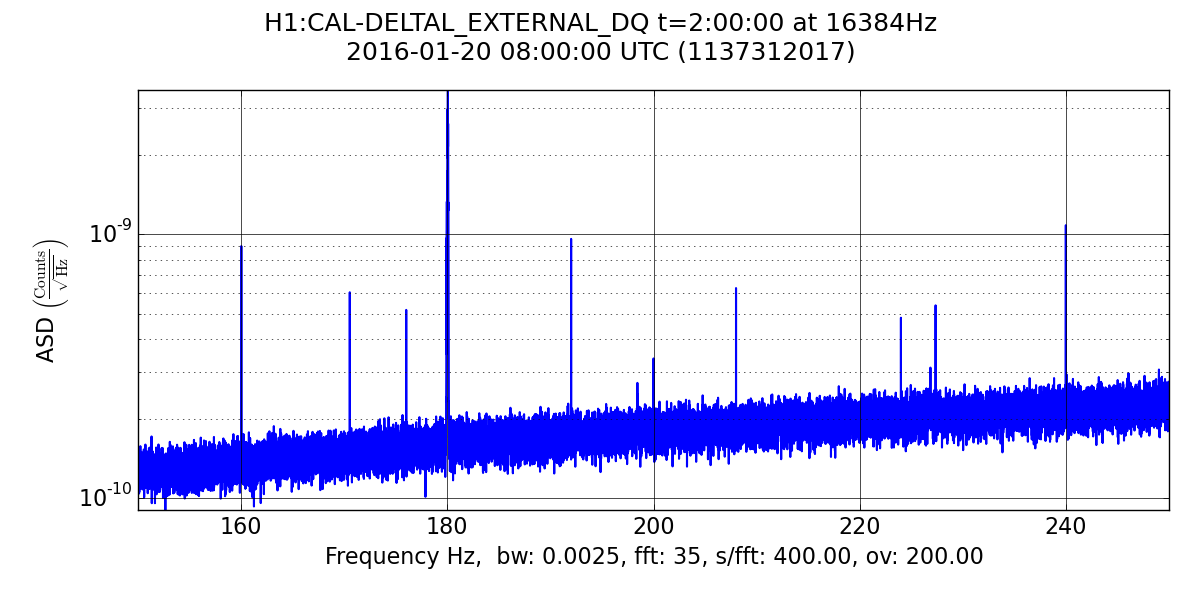
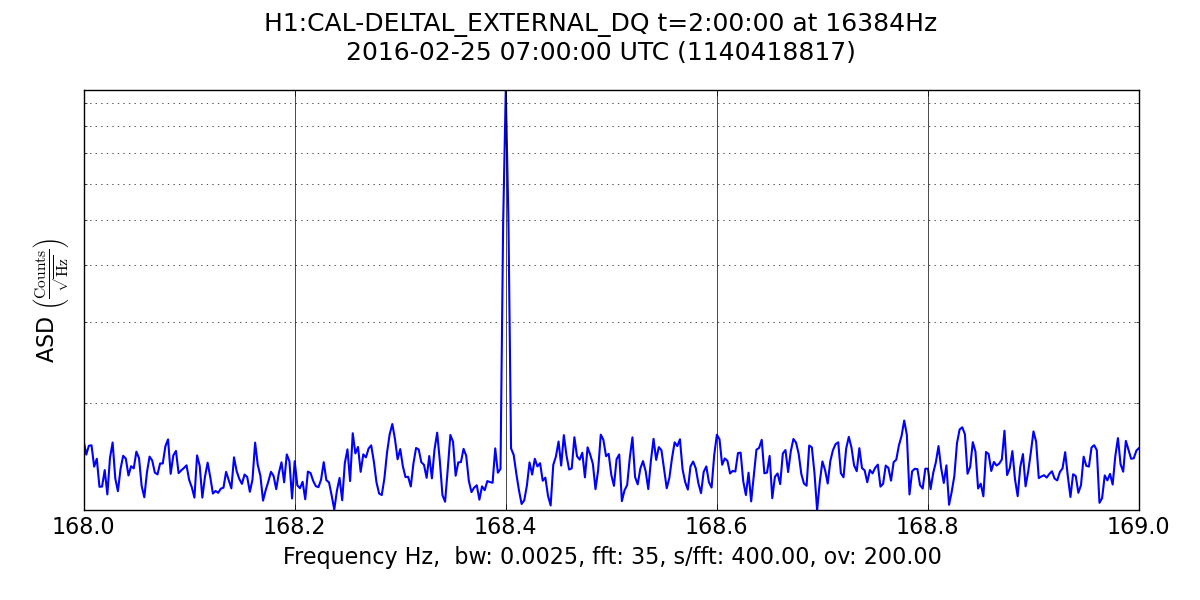
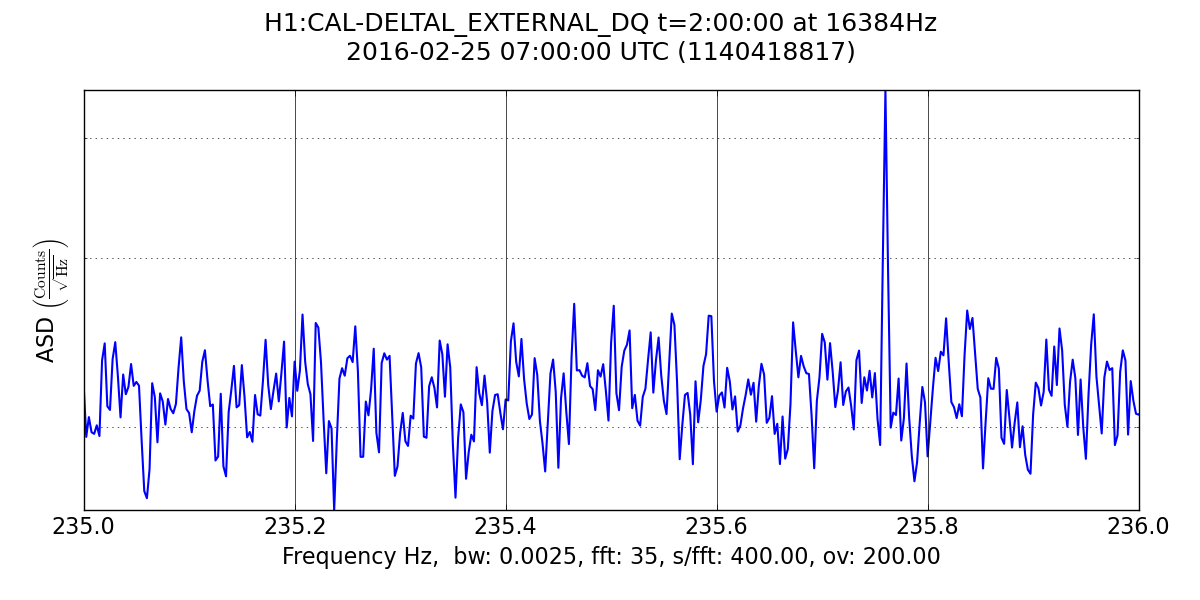
To quote Bill Murray in Groundhog Day, "Anything different is good." (at least in this context)

The 16-Hz comb does indeed appear to have changed into a 16.84-Hz comb.
A DARM spectrum from two hours (400-sec coherence time) last night in the 150-250 Hz band is
attached, along with one from January on a day when the 16-Hz comb
was strong. New lines are seen in this band at

151.56 Hz
168.40 Hz
185.24 Hz
202.08 Hz
218.92 Hz
235.76 Hz

Some 1-Hz zooms are shown for a couple of the new lines.

So...can we fix this problem?
Keita, Sheila
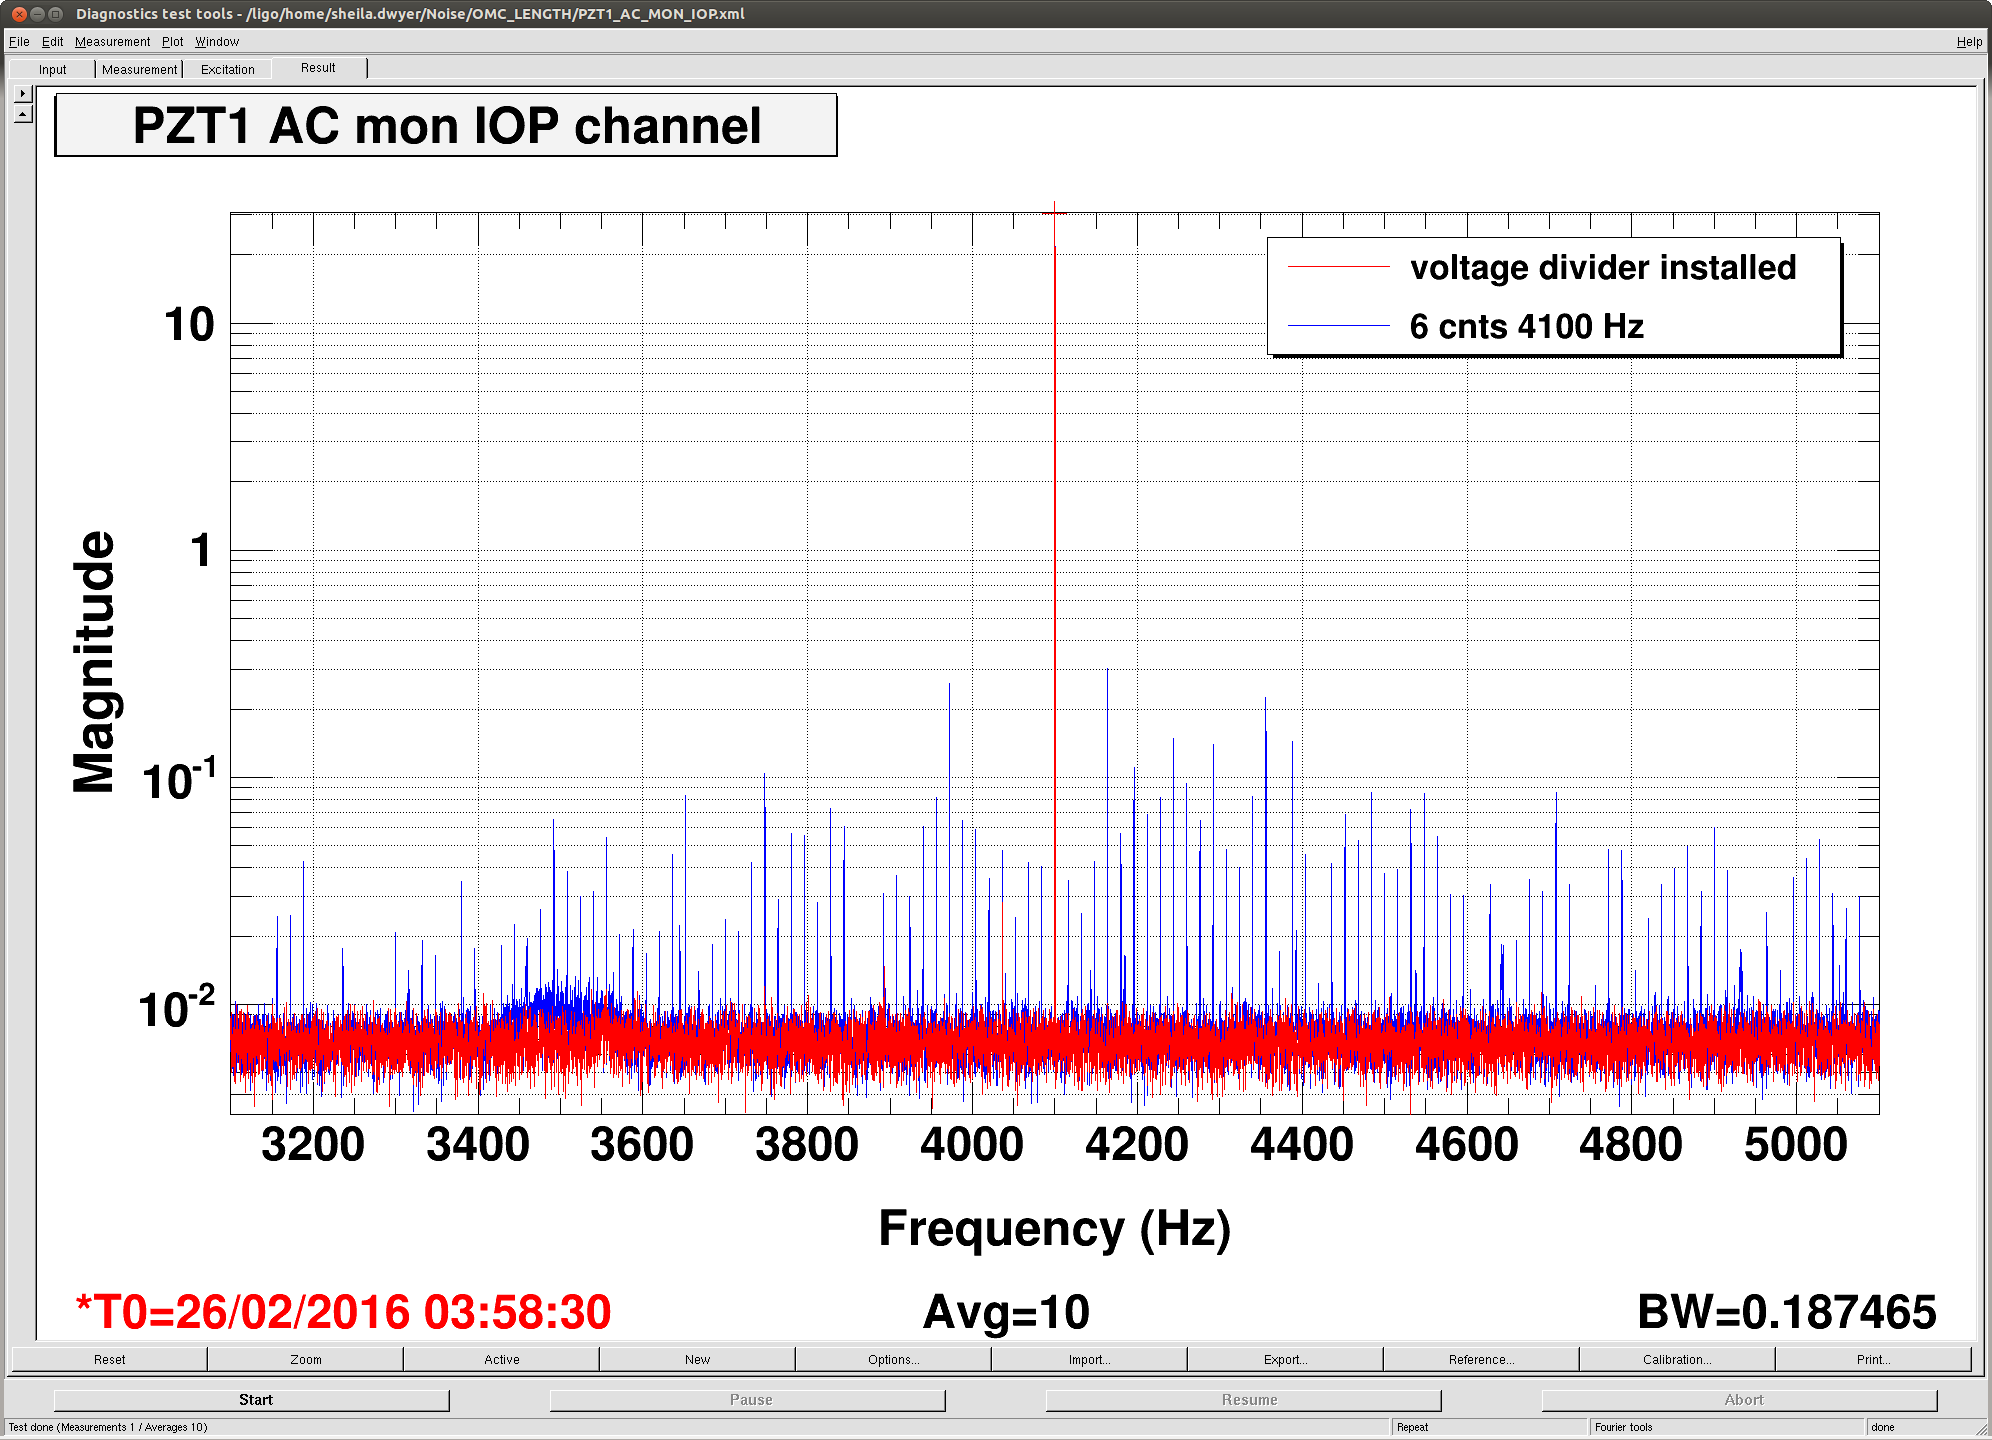
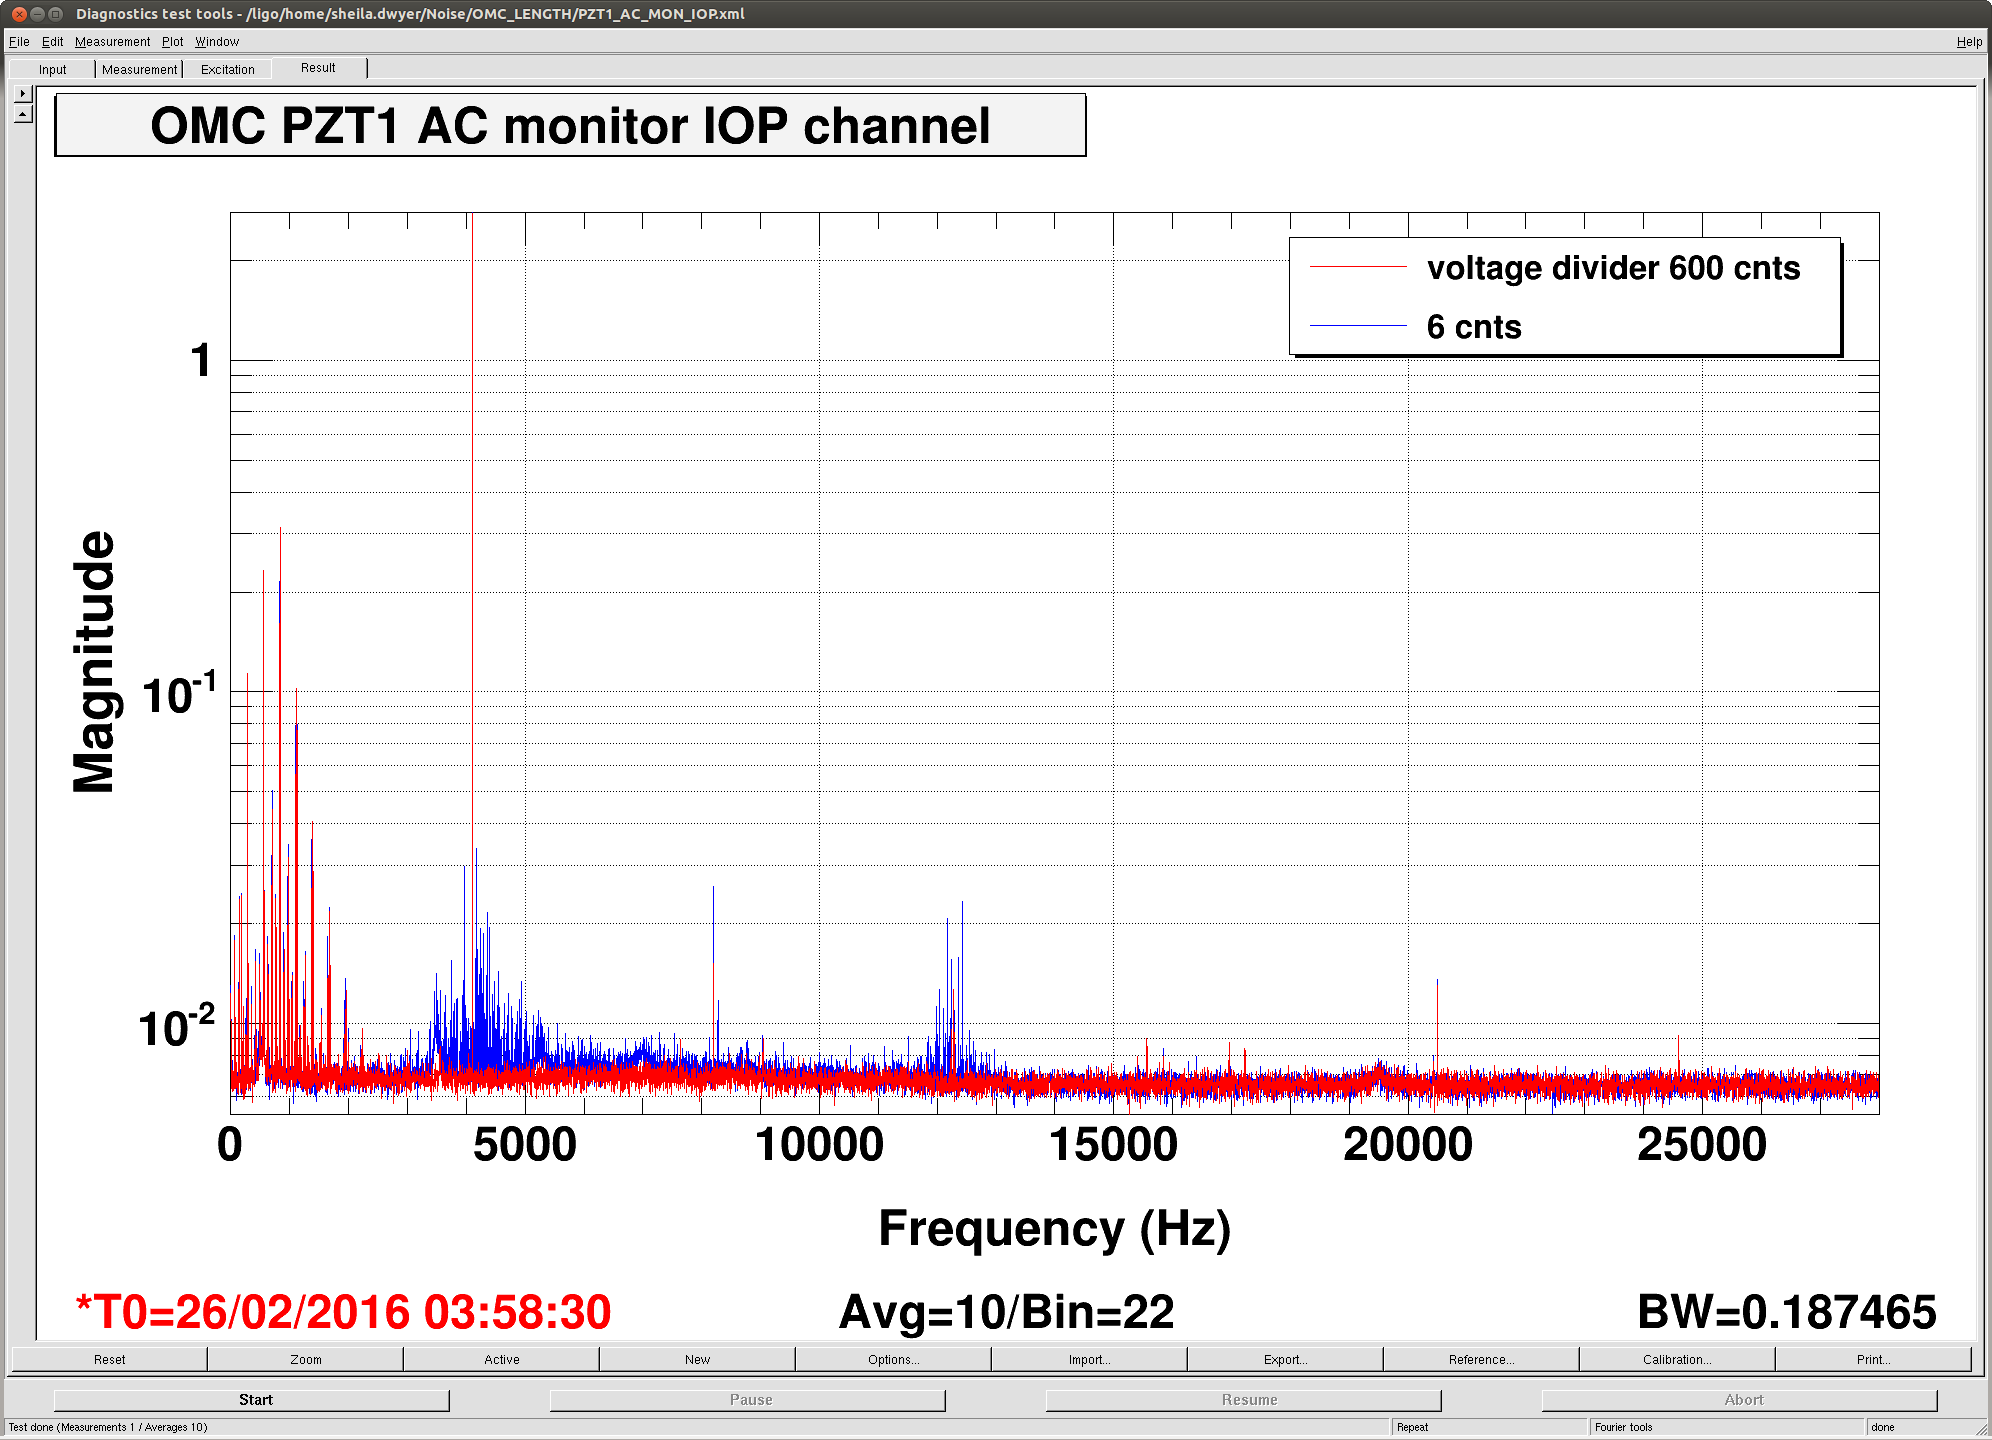
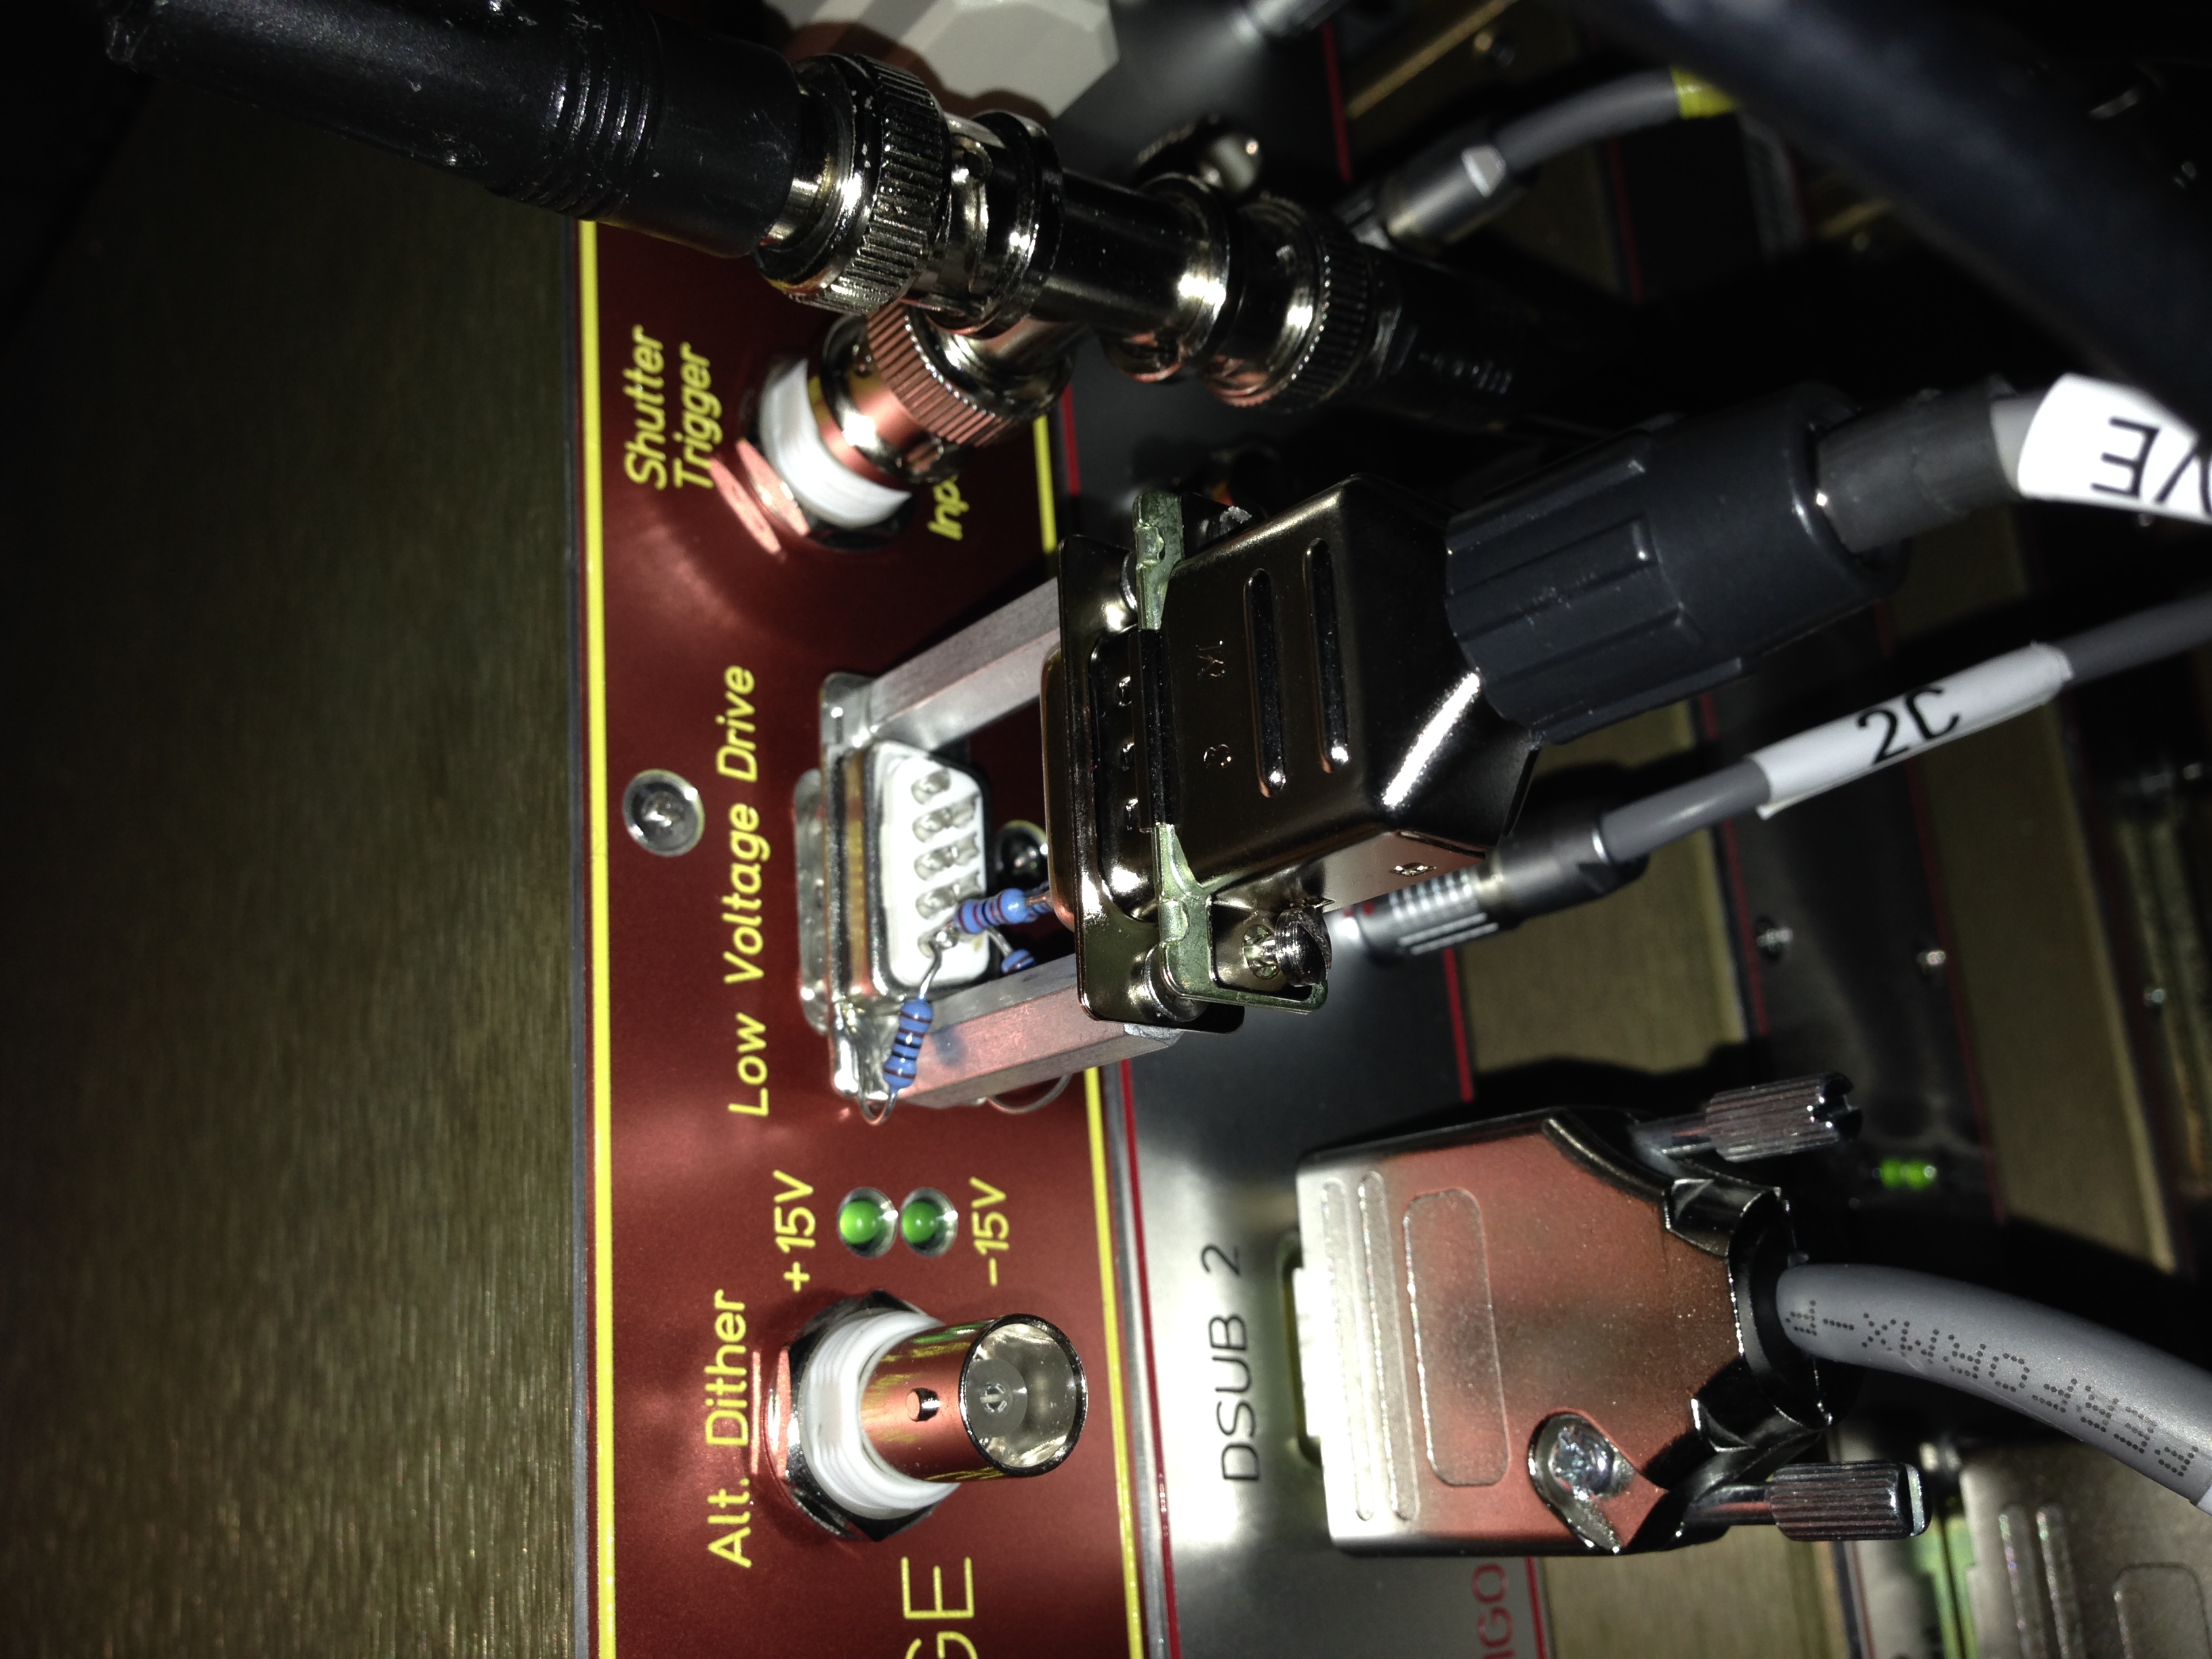
So that we can keep the OMC dither small while driving a reasonable level of counts out of the DAC, we added a voltage divider (somewhat creatively built) to the D-sub from the DAC to the driver chassis. This is a 11k/110 Ohm divider on pins 1 +6. We have increased the dither amplitude from 6 cnts to 600 cnts, so the round off errors will now be 100 times smaller compared to our signal.
The attached screenshots show the PZT1 AC monitor before and after this change. The lines below 1 kHz are always there, (even when there is 0 coming out of the DAC) and are not present on the analog signal coming into the driver chassis for the monitor.
We have reverted the frequency to 4100 Hz. If we get a long enough low noise lock tonight we can hope that the 16 Hz comb will be better. If things look good we should upgrade our voltage divider.
Thing is, our dither line used to be 12 counts pk-pk, so the rounding error was actually significant (signal/error ratio is something like 10 in RMS), and the error showed up as lots of lines because we're sending in only one sinusoidal signal. These lines actually drive the PZT length.
Making the dither bigger, the round off error RMS doesn't change much so RIN will become smaller.
We inserted two sets of 11k-110 Ohm resistive divider, one each for positive and negative input of the low voltage pzt driver input because it was easy. This is a temporary non-solution. A permanent solution is TBD.
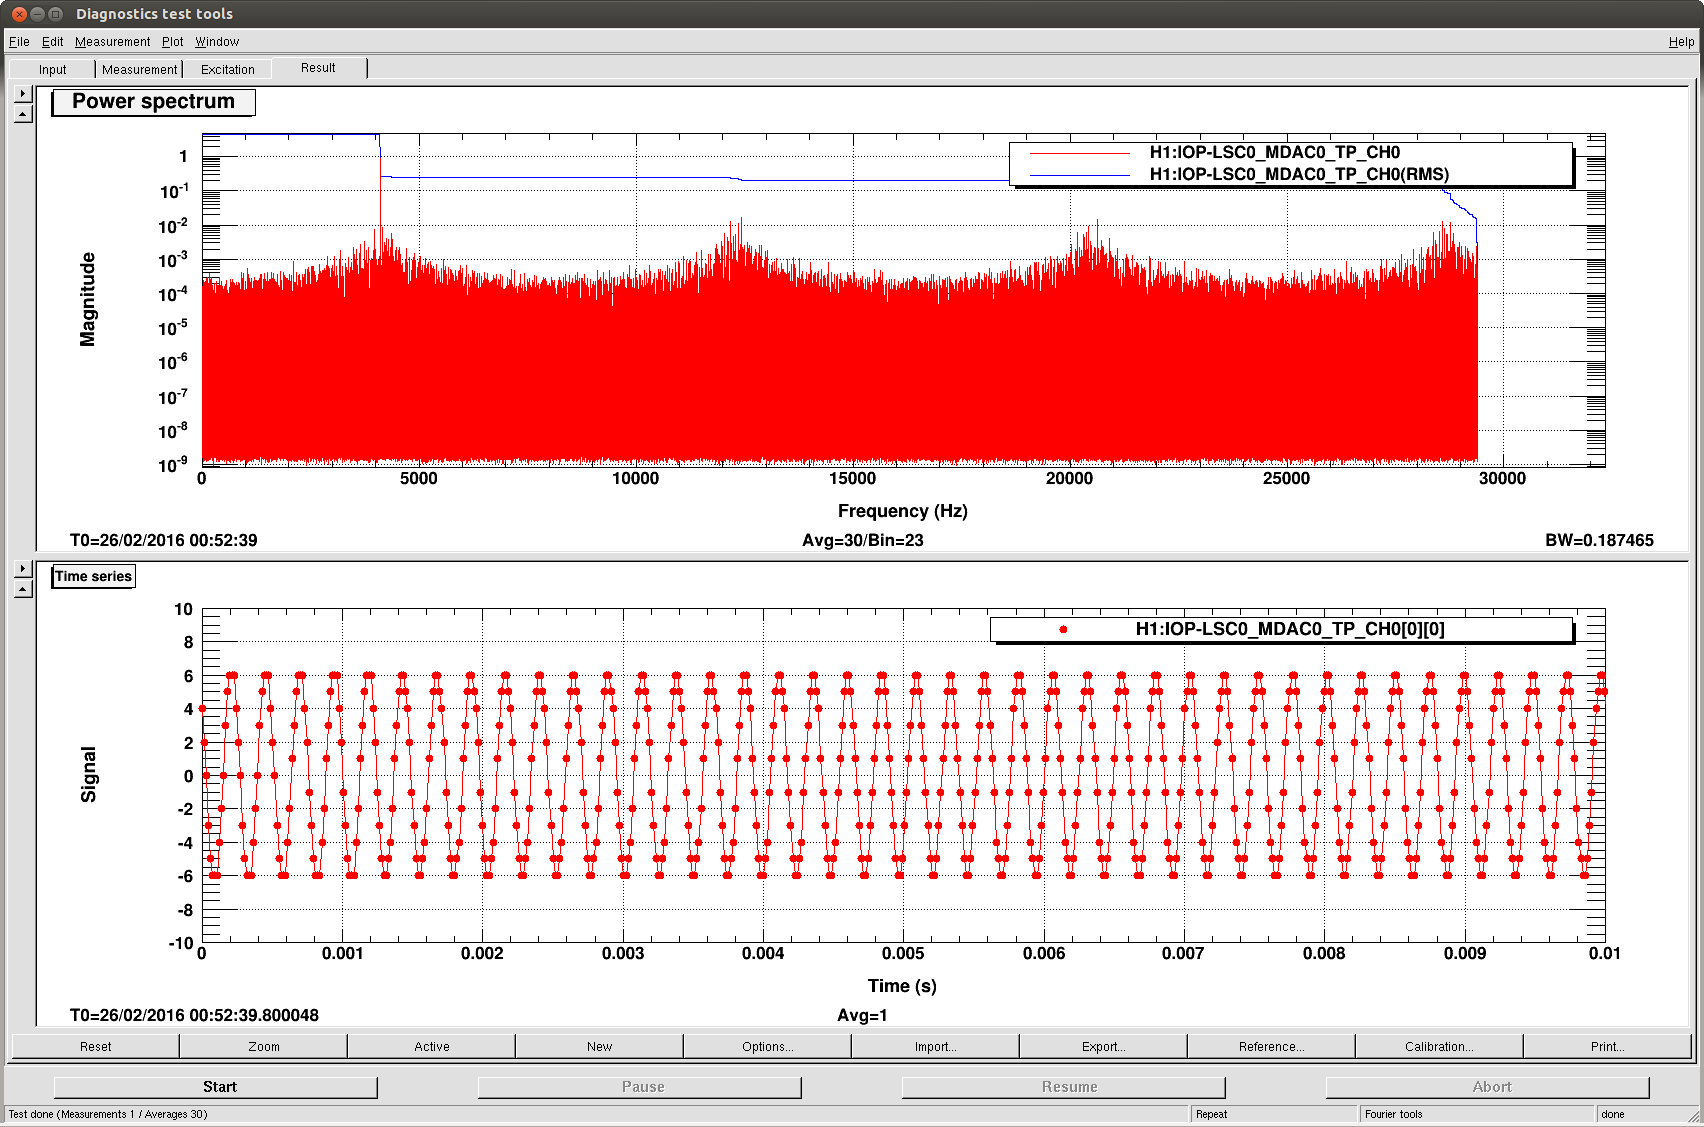
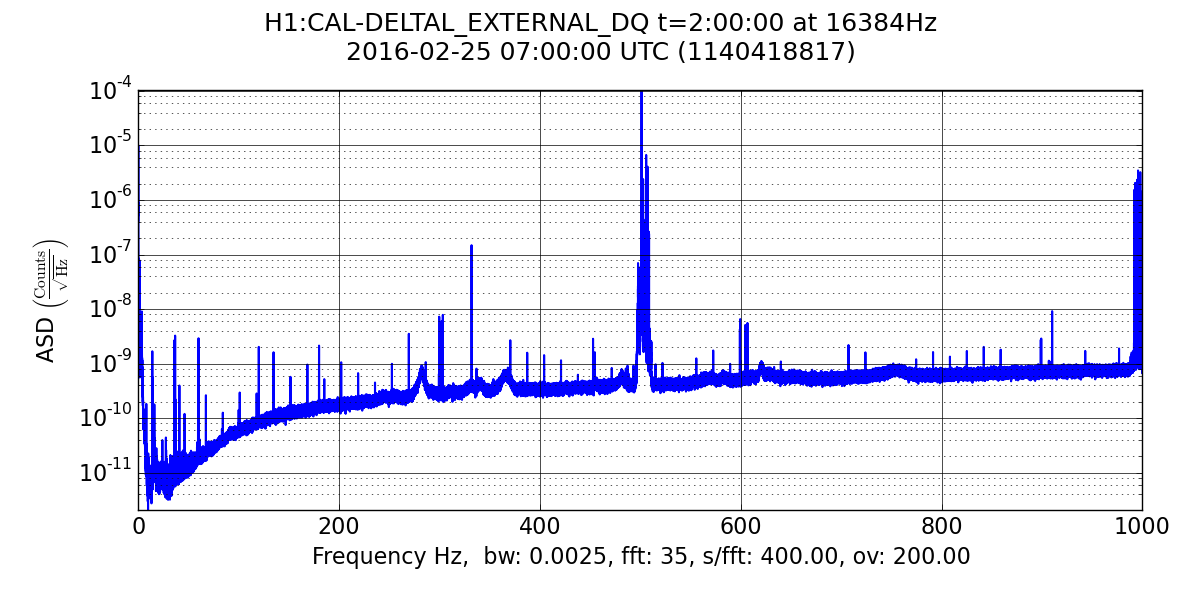
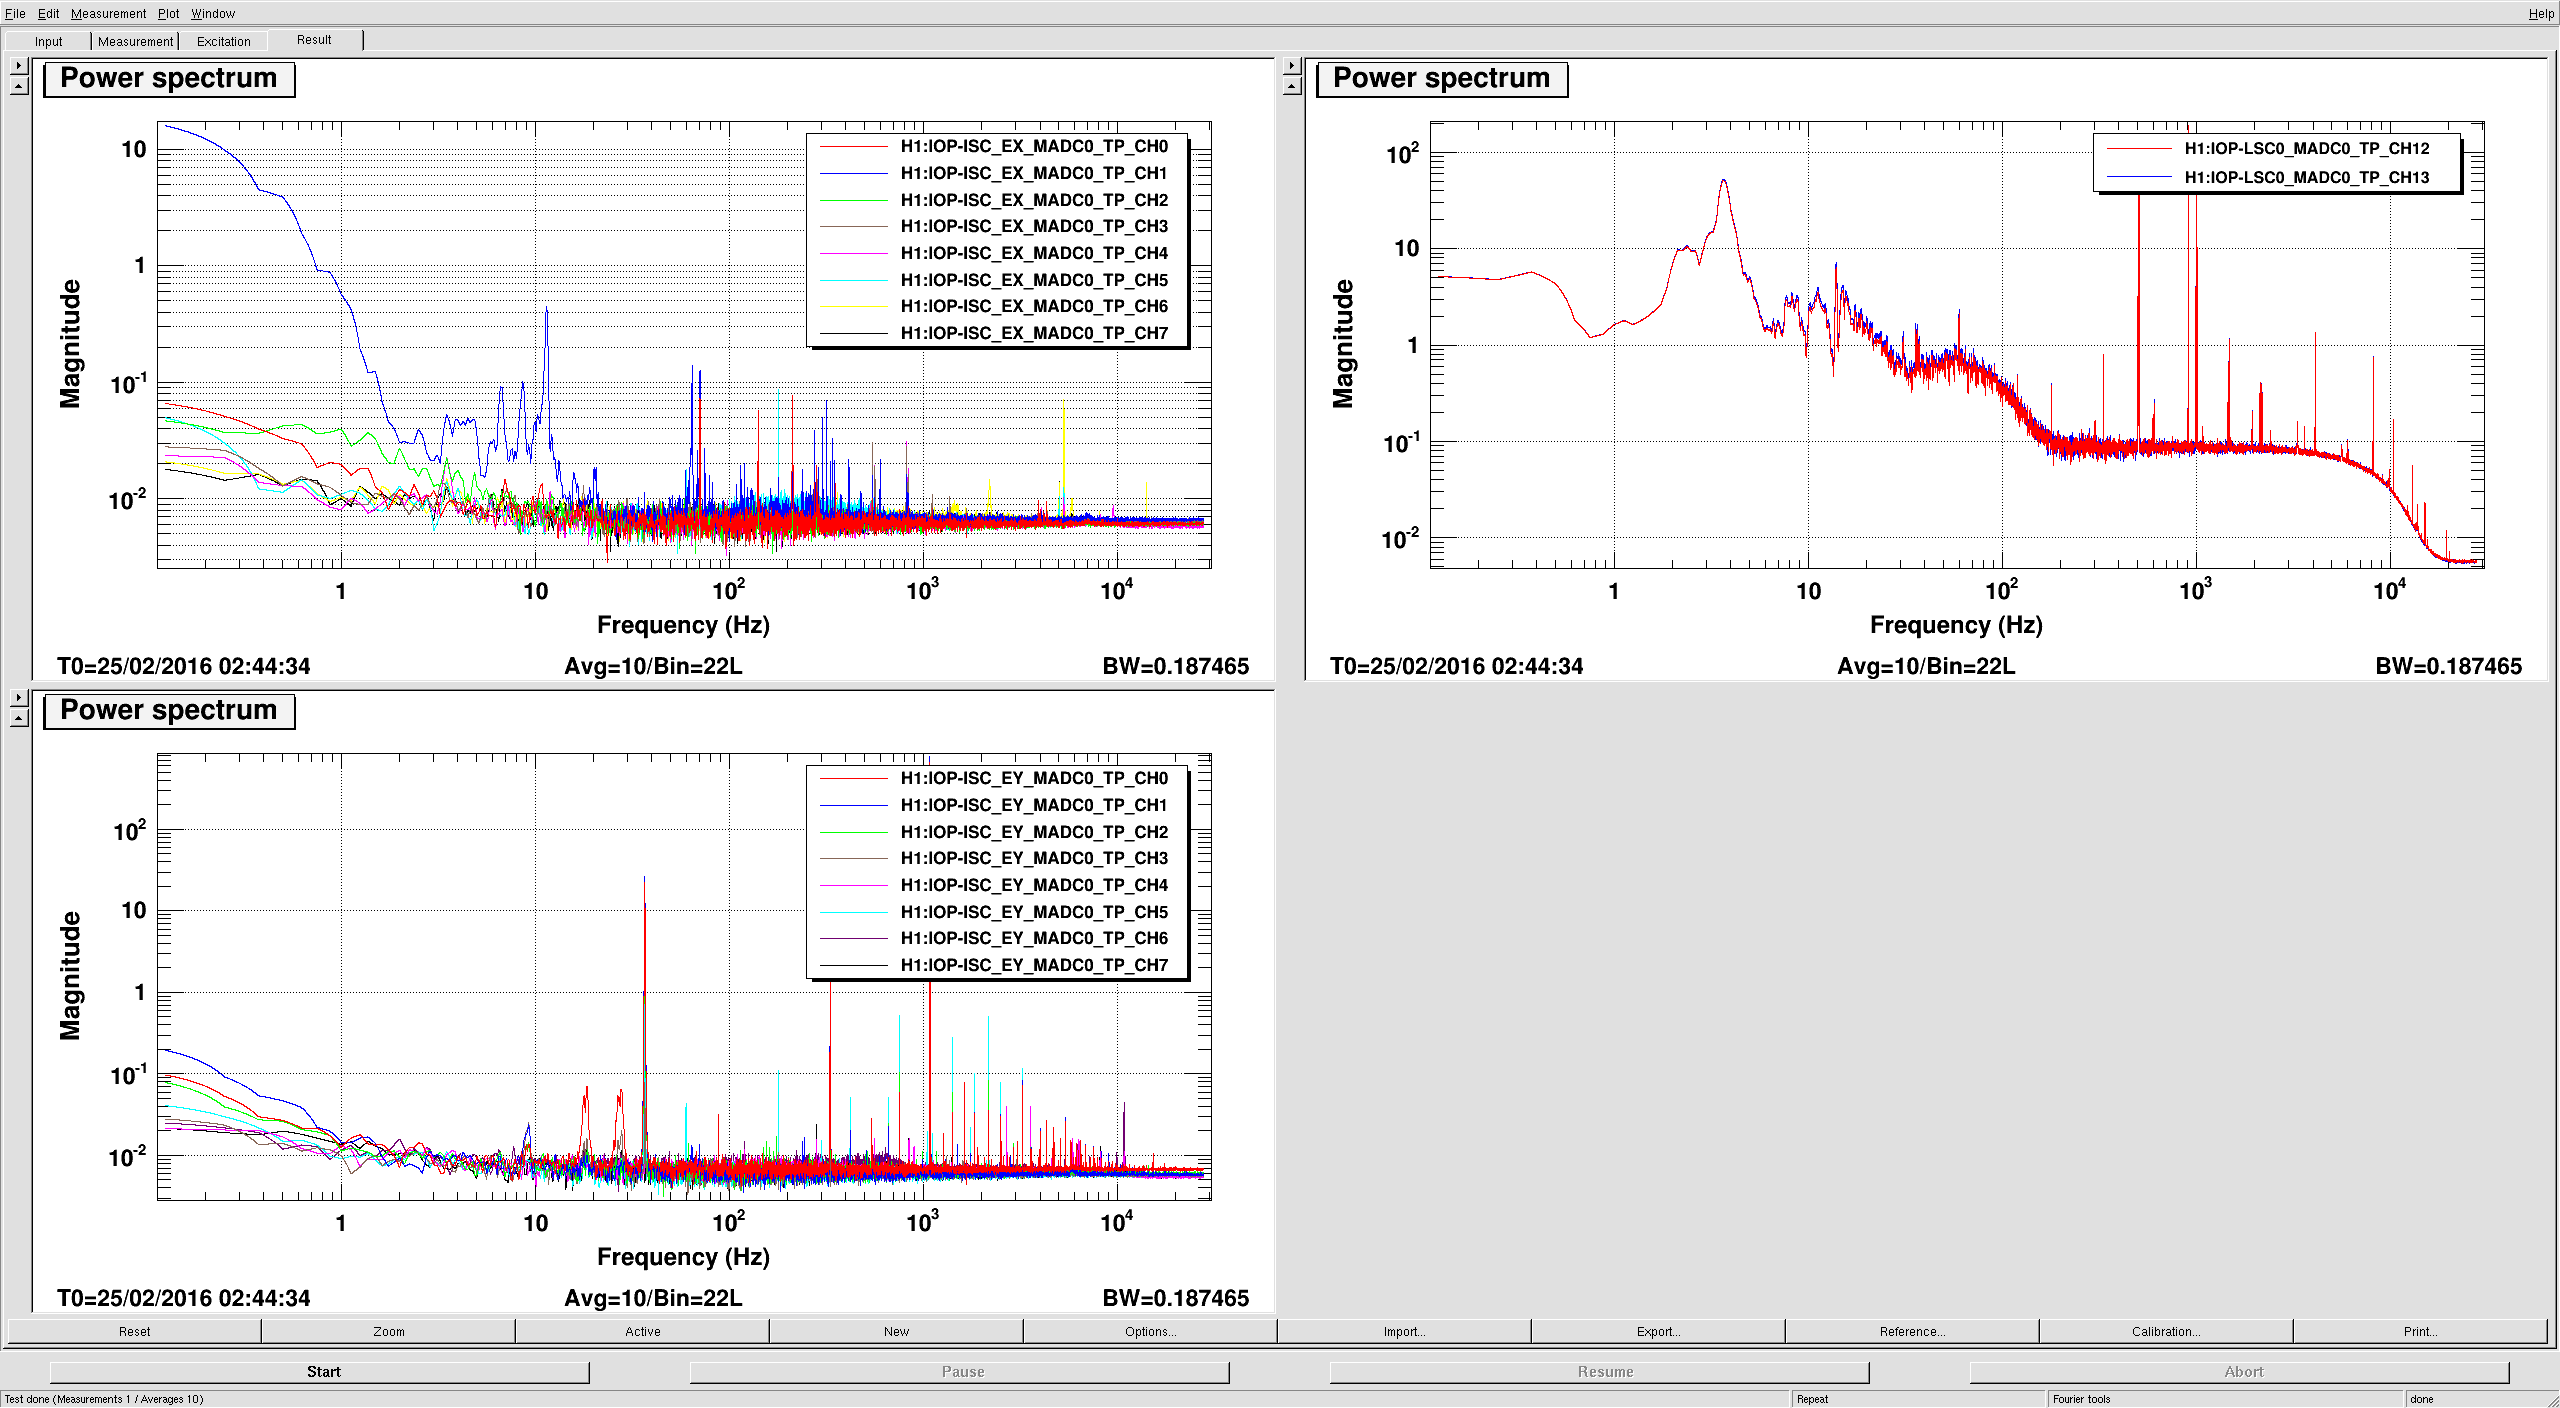
The first attachment shows the spectrum of the DAC IOP channel for the dither, i.e. the very last stage of the digital, before we increased the amplitude. RMS of the forest of lines is about a factor of 10 below the RMS of the dither.
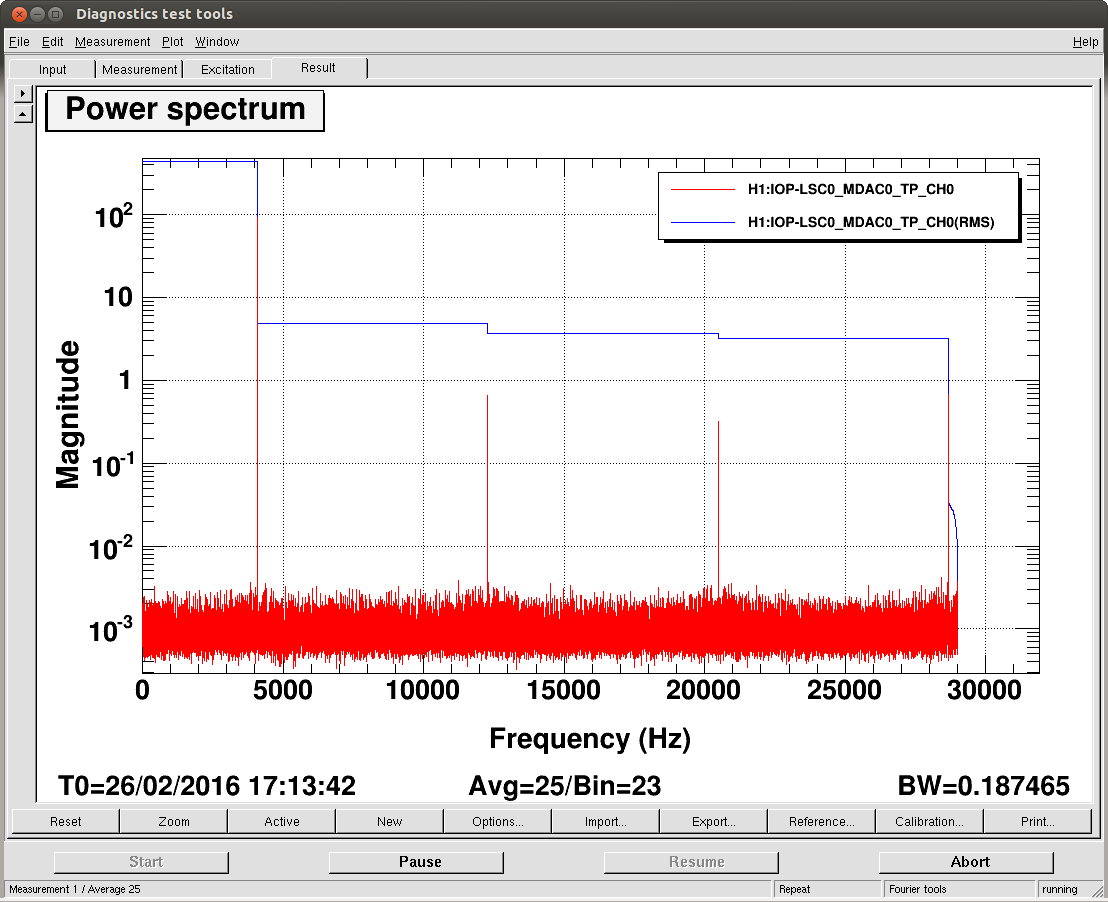
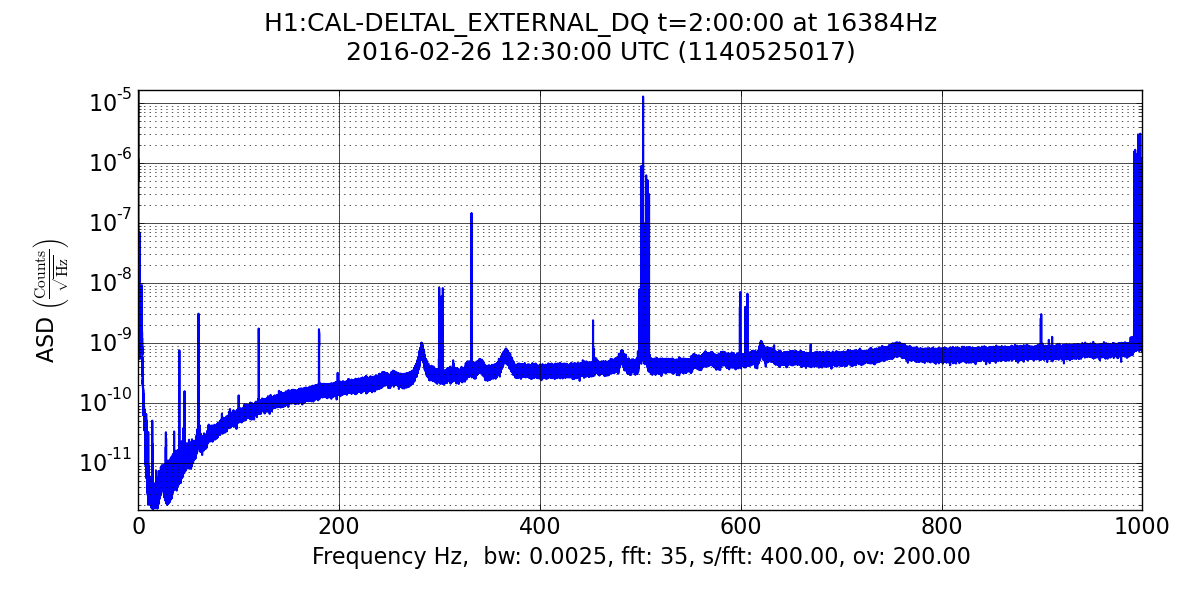
The second plot is after increasing the amplitude by a factor of 100, the rounding error RMS is still at the same level though you cannot tell from the plot, the dither to error RMS ratio should be more like 1000 now.
Three large lines in the second plot are not round off errors but imaging peaks that were previously buried in the round off errors: 12283.8kHz=16384-4100.2Hz, 20484.2Hz=16384+4100.2Hz, and 28667.8=32768-4100.2Hz.
Actually, the dither line is still at 4100.21 Hz for tonight, (I had forgotten that I put this into the guardian). We will revert it tomorow.
Splendid -- no 16-Hz or 16.84-Hz comb seen in a 2-hour stretch from last night!

See attached spectrum 150-250 Hz spectrum for comparison
with above plots, along with 0-1000 Hz spectra from last night
and from the night before, with the 16.84-comb present.

Many thanks from the CW group as we look ahead to O2.
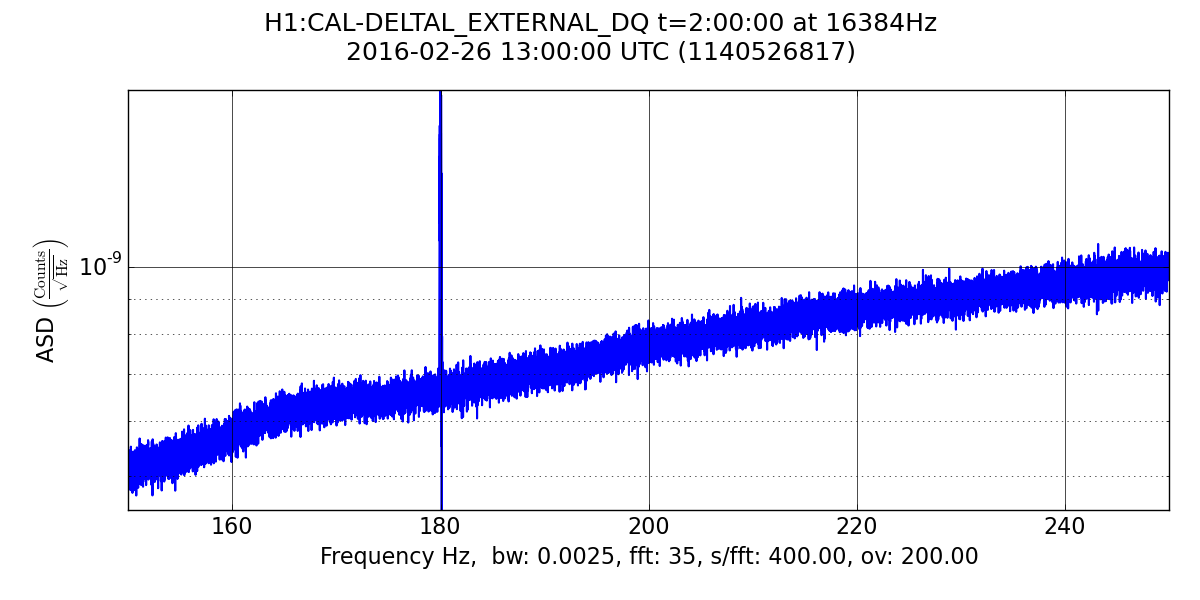
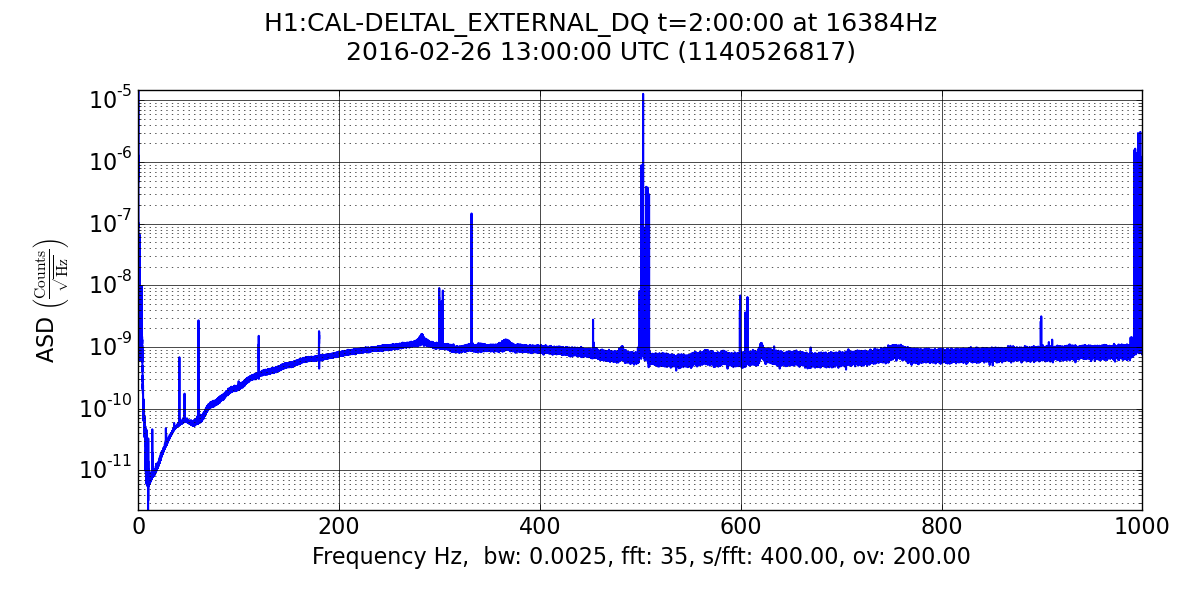
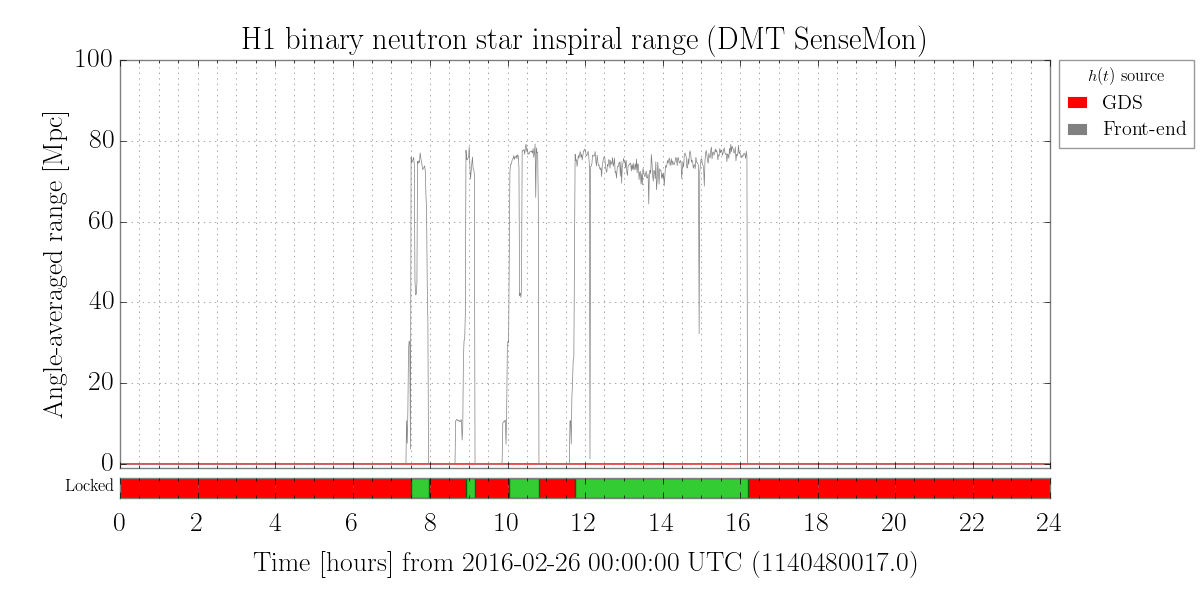
Sheila pointed out that the noise floor for the 2nd spectrum
is considerably higher than for the 1st and could be hiding
residual lines due to the dither. So I tried shifting the 2-hour
time window a half hour earlier, to avoid the hellacious glitch
seen in the inspiral range (see 1st figure) near the end of
the original Feb 26 interval. The 2nd figure shows the resulting
spectrum with a noise floor closer to that on Feb 25. The
16.84-Hz comb still does not appear.

So I think it's safe to say that the 100 times multiplication / divide
trick did indeed suppress the 16.84 Hz (originally 16 Hz) comb a
great deal, but of course, we will need long coherence times and
long integrations to see if what's left causes residual trouble for CW searches.
Den, Patrick, Evan
During IX coil driver investigations yesterday, we rang up some violin modes to very high amplitude (~4×10⁻¹⁴ m rms in DARM, about 4 orders of magnitude higher than our optimal, damped mode height).
The existing violin mode damping settings, which consisted of a few wide filters meant to actuate on multiple modes simultaneously, were damping some of the modes while causing others to ring up.
This is not the first time we have been hoist with our own wide-bandwidth pitard. Additionally, we have more the enough filter modules per test mass to damp each first harmonic individually, which alleviates the problem of having to find a filter to damp multiple modes simultaneously.
There were five IX modes visible in DARM on rf readout. For these five modes, we constructed narrow, individual damping filters (8th order butterworths). The settings are as follows:
| Freq. [Hz] | FWHM [mHz] | Phase | Gain [ct/ct] |
| 500.054 | 100 | 60° | 100 |
| 500.212 | 100 | 0° | 100 |
| 501.208 | 30 | 0° | −10 |
| 501.256 | 30 | 0° | 10 |
| 501.452 | 100 | 0° | 100 |
Note the narrow bandwidth of the filters for the two 501.2 Hz modes.
These use the IX L2 damping SFMs, numbers 1 through 5. The corresponding OAF monitor filters have been updated as well.
That means there are three other first harmonics on IX that are yet to be damped.
The damping phase of the mode at 501.208 Hz seems to have flipped sign at the start of the most recent lock. We'll have to keep an eye on this one.
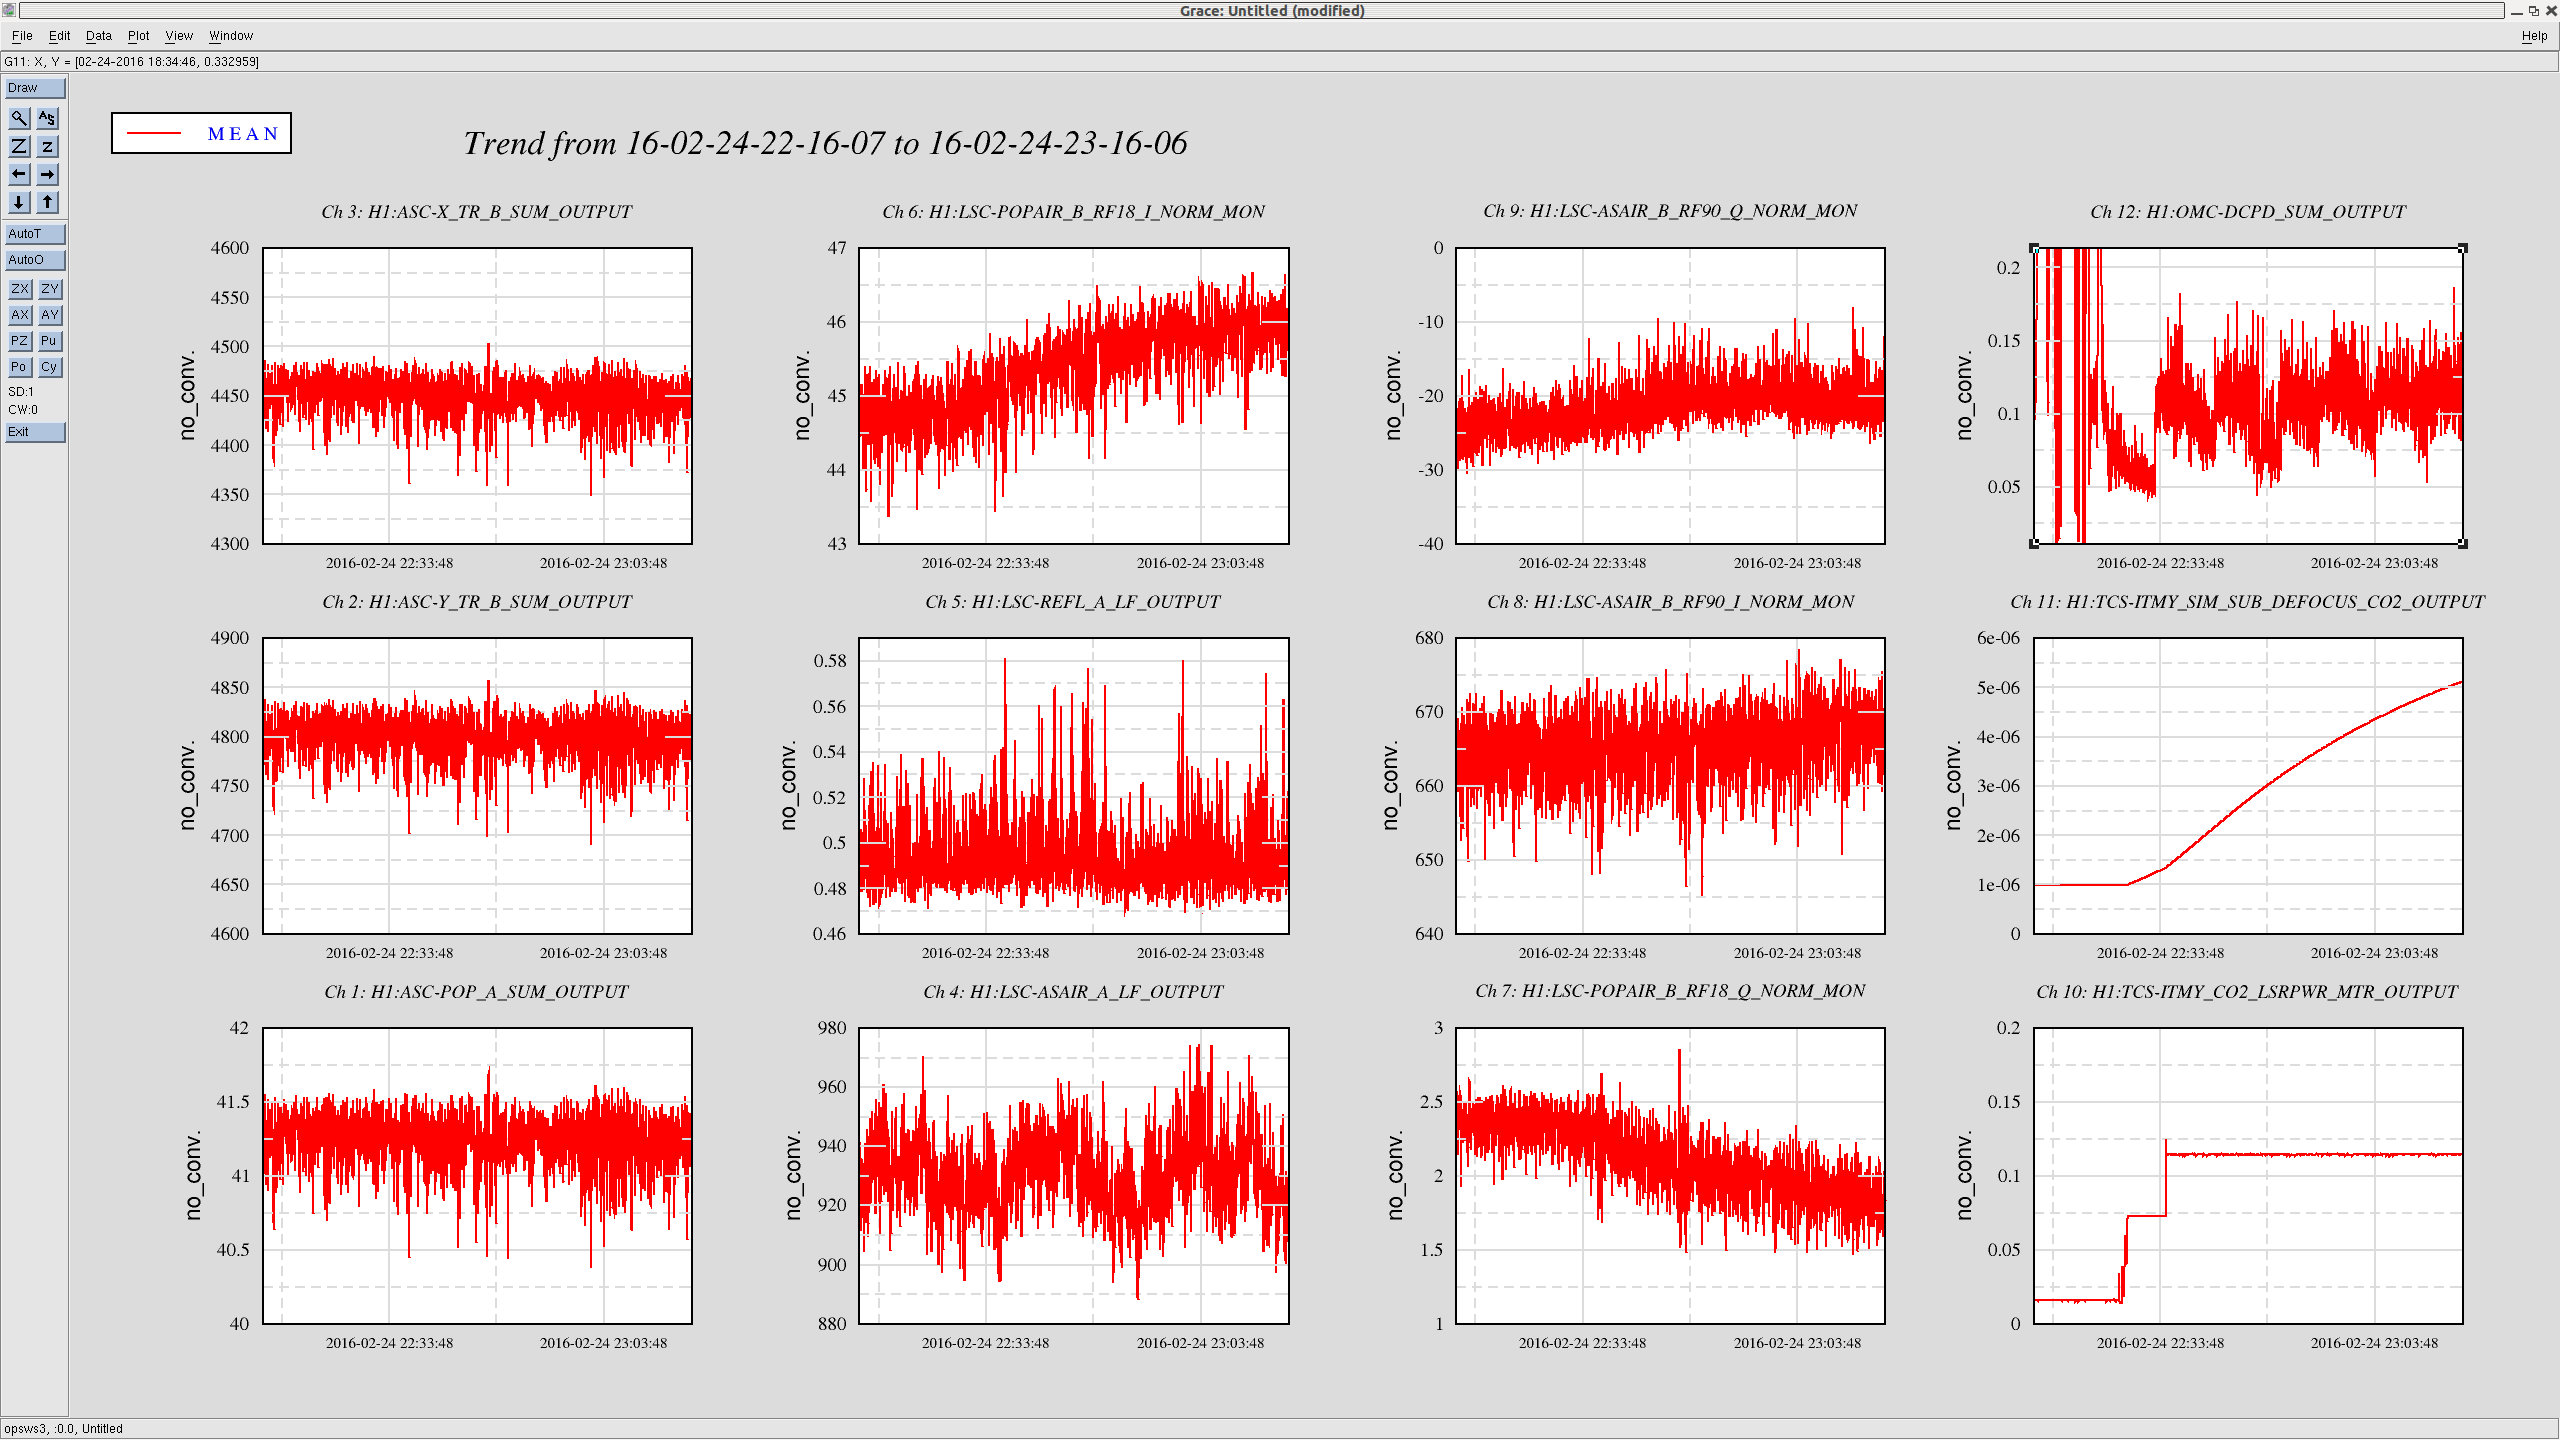
I have increased the CO2 Y laser from 0 to 110 mW as a part of the tuning of the differential lensing. No obvious imporvements or degradation were observed so far.
I am leaving CO2 Y as it is. If this setting turns out to make some noise performance worse, one can feel free to decrease the power.
[Background]
We have three tests/adjustments to do in this week and perhaps the coming as follows:
This alog reports an activity related to the first topic. The work has not been concluded yet. So we need to return to this point at some point.
[RF9 3rd HOM?]
There was a theory that the differential heating may be efficiently sensed by monitoring a 3rd order HOM of the 9 MHz rf sidebands. We obtainted this idea from a measurement that Dan did a while ago (alog 22175). However, according to today's test with PSL at 2W, this theory does not look promising. We should repeat this at 20 W.
[The test]
I have increased CO2Y from 0 to 110 mW. According to Aidan's simulator (alog 25587), this introduces a defocus of about 6 uD. Also, from the experience on this Monday, 400 mW of CO2 Y makes some part of the interferometer unstable and eventually unlocks. So this time, I chose 100 mW.
The interferometer stayed locked with AS RF45 Q with a nominal DARM offset (a few 10 pm) throughout the test. The PSL power was at 2 W. The OMC alignment was first optimized by engaging the length and dither alignment loops then I updated the QPD loops' operating points. I unlocked the OMC and changed the PZT voltage until I found the 3rd order HOM of RF9. The alignment was servoed bt the QPD loops. The 3rd order HOM was as high as 0.1 mA while the carrier was about 20 mA in OMC DCPD SUM. I wanted to lock on the HOM but unfortunately this was not practical. As the alignment chnages the peak height of this particular mode changes and also there was a 2nd order HOM of RF45 which is more stable and high. So for these reasons, the loop was not stable. I instead decided not to lock the OMC length and continuously adjust the pzt voltage by hand every few minutes or so. By the way, this mode was able to increase its power by a factor of 3 by changing the OMC alignment. Not great.
The attached trend shows some relavant channels over 1 hour. I do not see any obvious change in the carrier power (i.e. TRX, TRY and REFL_LF). The RF9 3rd HOM stayed constant throughout the test which is visible in OMC DCPD SUM since the OMC length was set such that it resonates with this mode. There was a slight change in POP RF18 which slightly increased by 6% or so with some amount of rf phase rotation. The interferometer stayed locked throughout the test. I have done a OMC scan after and before the test. I will process the data and post the results later.
Ideally, I should have monitored the laser noise couplings at the same time, but I did not do that this time. So, perhhaps next time.
15:56 UTC Bubba to LVEA to work on crane.
16:13 UTC Took ISC_LOCK guardian to down. Paused ALIGN_IFO guardian. Put guardian for each optic in HAM2 to SAFE.
16:15 UTC Richard powering down SAT amps for optics in HAM2.
17:11 UTC Richard done. Started relocking.
17:17 UTC Bubba done.
18:22 UTC Nutsinee to mechanical room to check TCS cable width.
18:29 UTC Nutsinee done.
21:21 UTC Sheila and Keita to racks near HAM6 to look at PZT voltages.
23:17 UTC Kyle to mid Y to fill CP3.
23:35 UTC Kyle back.

Support: Sheila, Kiwamu

IFO locked at NLN upon arrival. Took ISC_LOCK to down and put HAM2 suspensions in safe mode to allow powering down satellite amps for capacitor fix. Repeated lock losses at FIND_IR during recovery. ETMX HEPI tripped (see Jim W.'s alog). Ran through initial alignment after trouble locking DRMI. Left locked at ENGAGE_ASC_PART3 as requested by Kiwamu. Evan H. working on violin mode damping.
1517 - 1532 hrs. local -> To and from Y-mid

LN2 at exhaust 40 seconds after 1/2 turn open.  Next overfill to be Friday, Feb. 26th. before 4:00 pm local.
The beam tube cleaning crew departed for LLO this morning to help out down there. The beam tube cleaning will be on hold until they return. The crew should be back at LHO on 03/07/2016.
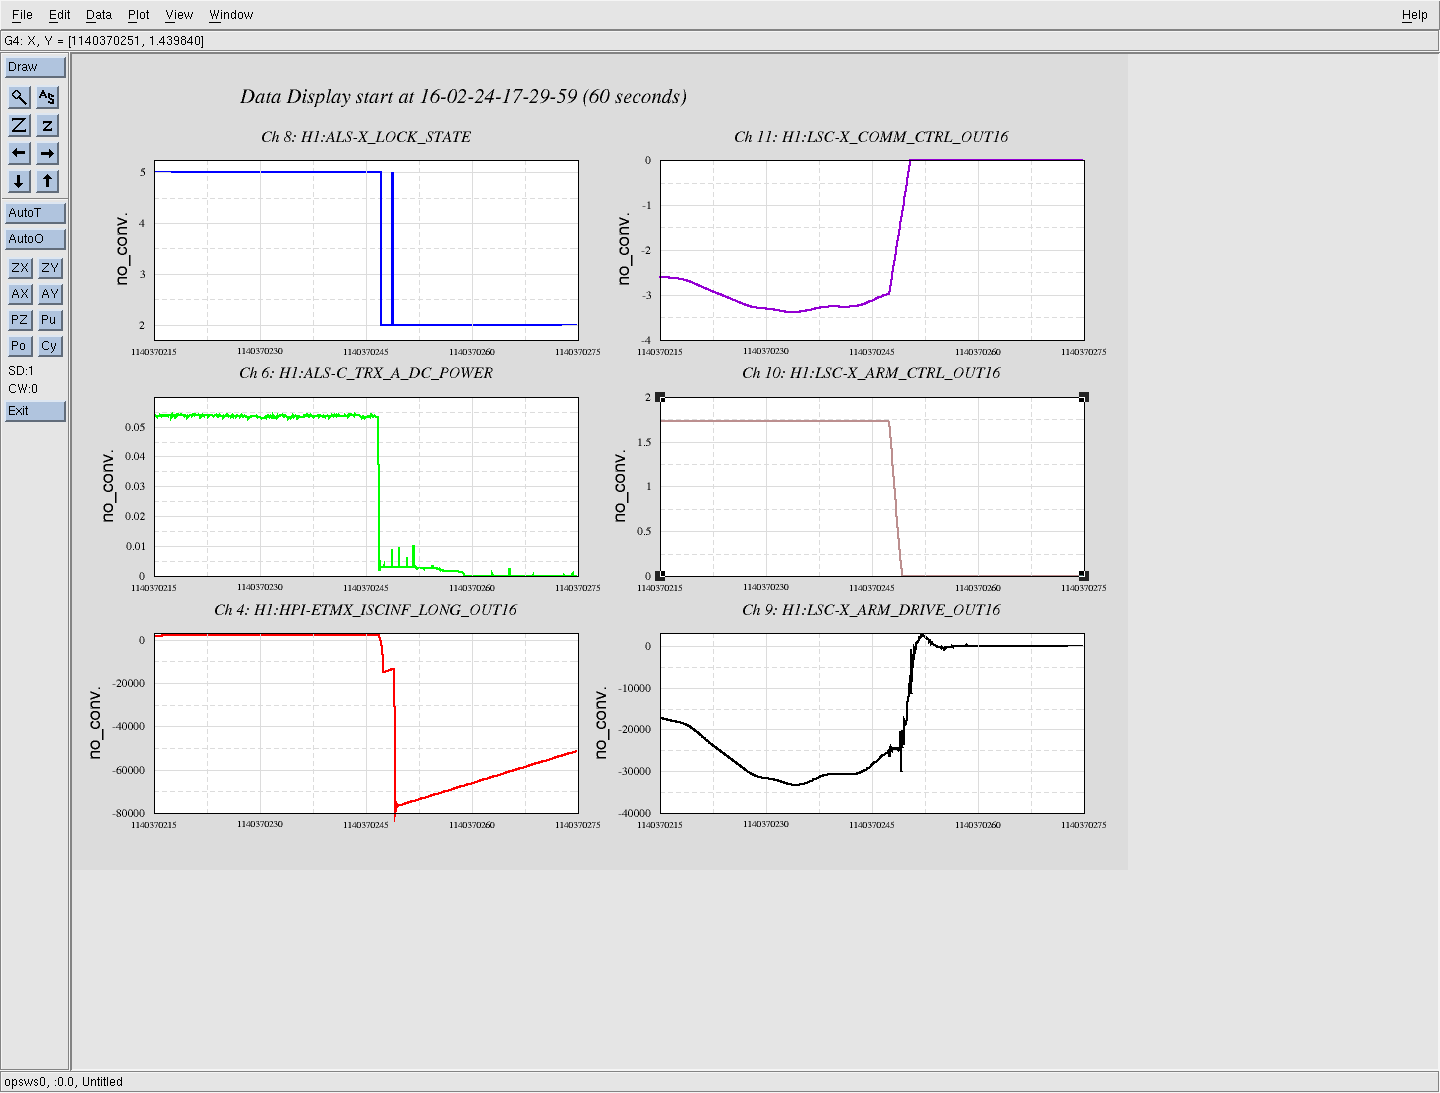
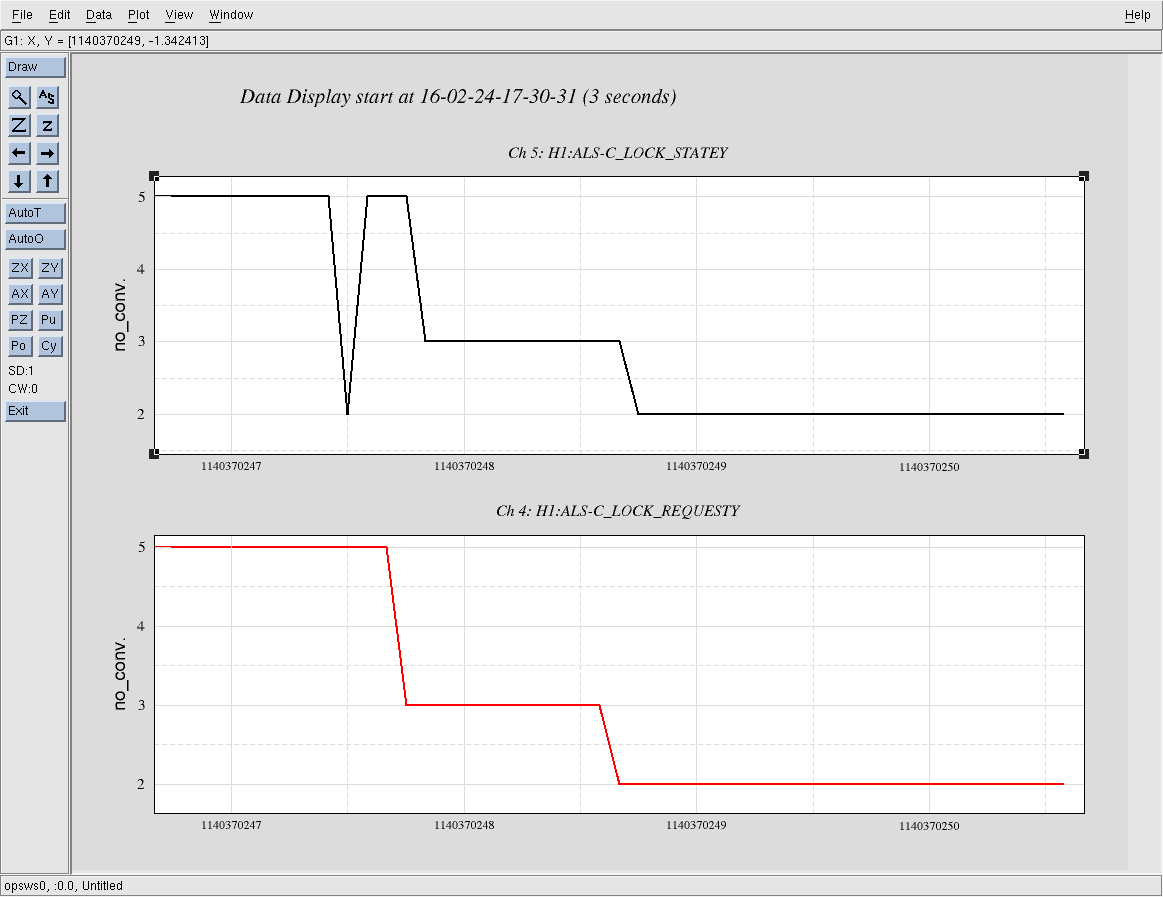
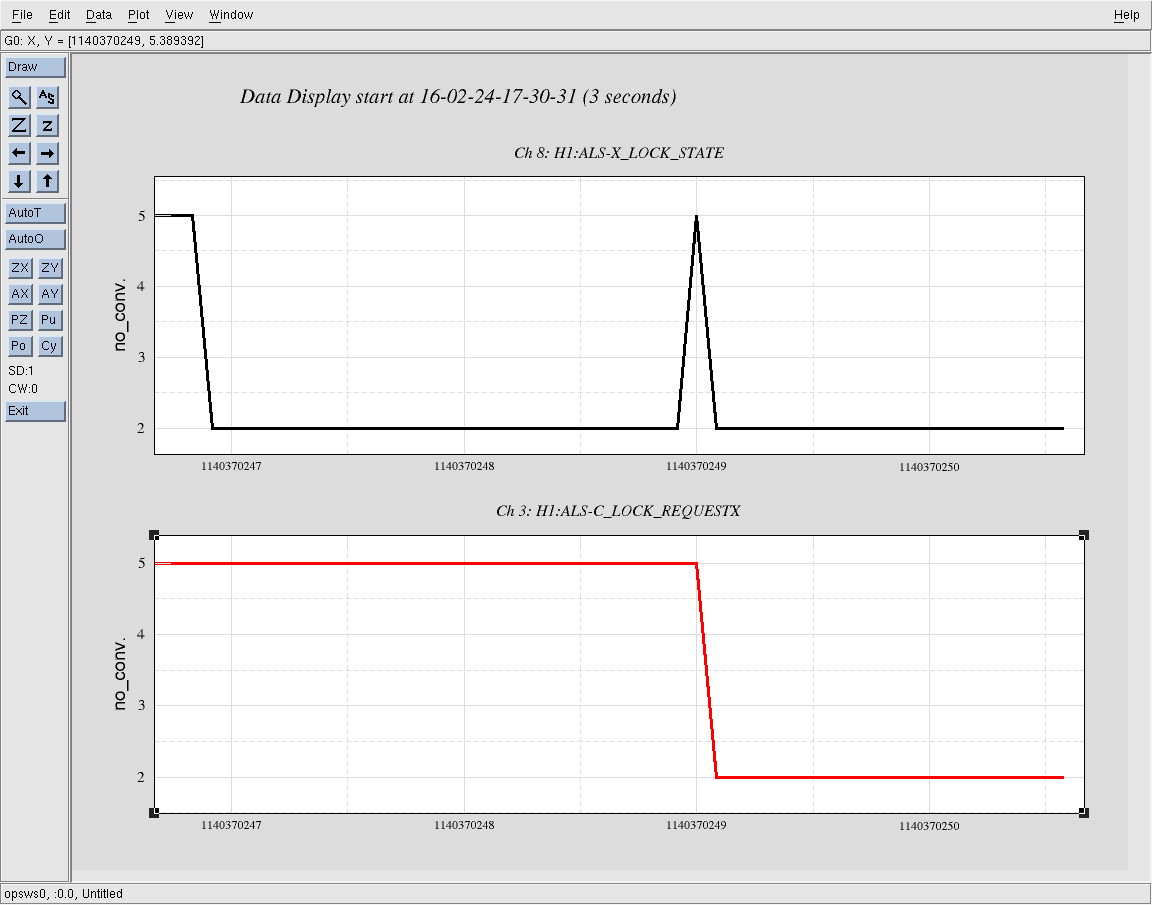
This morning ETMX HEPI tripped again after a lock loss. Sheila and I looked into it and it looks like there is some difference between the tidal controls between the two arms. The first screen shows a number of signals related to the X arm tidal. After the lockloss (where the TRX power green(?) trace goes to zero in the center left) HEPI starts bleeding off the tidal offset. It looks like some flash makes the ALS think the arm is locked again, and it sends an 80 micron kick to the HEPI ISC offload (the big downward jump in the red trace, bottom left). The next two, traces are the request and states for the ALS X and Y for 5 seconds around the time of the HEPI trip. The second screen shows the state and request for Y, the notch in the black trace is the lock loss. The red trace shows the request going from (I think) Locked to Transition to Down (or something like that). The third screen shows the same time for the X arm. The state goes from Locked to Down, then 2 seconds later the Request goes from Locked to Down, which cause the State to jump back up to Locked, then immediately back to Down. This jump lines up with the big kick to the EX HEPI that causes the trip.
Updated the tidal code to add a 5s delay before engaging. Still needs to be activated.
200 ml added. This seems to be about 50 ml too much. The water level is beyond MAX line but not overflow.
FAMIS#4139 closed
DaveB restarted the guardian computer to correct a tconvert issue, WP 5740.
After this, every HEPI platform guardian reports this error:
2016-02-23T17:52:24.50084 HPI_HAM1 [ROBUST_ISOLATED.enter]
2016-02-23T17:52:24.57873 HPI_HAM1 W: Traceback (most recent call last):
2016-02-23T17:52:24.57874 File "/ligo/apps/linux-x86_64/guardian-1485/lib/python2.7/site-packages/guardian/worker.py", line 459, in run
2016-02-23T17:52:24.57875 retval = statefunc()
2016-02-23T17:52:24.57875 File "/ligo/apps/linux-x86_64/guardian-1485/lib/python2.7/site-packages/guardian/state.py", line 240, in __call__
2016-02-23T17:52:24.57876 main_return = self.func.__call__(state_obj, *args, **kwargs)
2016-02-23T17:52:24.57876 File "/ligo/apps/linux-x86_64/guardian-1485/lib/python2.7/site-packages/guardian/state.py", line 240, in __call__
2016-02-23T17:52:24.57877 main_return = self.func.__call__(state_obj, *args, **kwargs)
2016-02-23T17:52:24.57877 File "/opt/rtcds/userapps/release/isi/common/guardian/isiguardianlib/decorators.py", line 86, in wrapper
2016-02-23T17:52:24.57878 return func(*args, **kwargs)
2016-02-23T17:52:24.57878 File "/opt/rtcds/userapps/release/isi/common/guardian/isiguardianlib/decorators.py", line 86, in wrapper
2016-02-23T17:52:24.57879 return func(*args, **kwargs)
2016-02-23T17:52:24.57879 File "/ligo/apps/linux-x86_64/guardian-1485/lib/python2.7/site-packages/guardian/state.py", line 240, in __call__
2016-02-23T17:52:24.57880 main_return = self.func.__call__(state_obj, *args, **kwargs)
2016-02-23T17:52:24.57880 File "/ligo/apps/linux-x86_64/guardian-1485/lib/python2.7/site-packages/guardian/state.py", line 240, in __call__
2016-02-23T17:52:24.57881 main_return = self.func.__call__(state_obj, *args, **kwargs)
2016-02-23T17:52:24.57882 File "/opt/rtcds/userapps/release/isi/common/guardian/isiguardianlib/isolation/states.py", line 490, in run
2016-02-23T17:52:24.57882 if (iso_const.ISOLATION_CONSTANTS['SWITCH_GS13_GAIN']) & (self.has_requested_gs13_gain_switch == False) & (top_const.CHAMBER_TYPE != 'BSC_ST1'):
2016-02-23T17:52:24.57883 KeyError: 'SWITCH_GS13_GAIN'
2016-02-23T17:52:24.57883
2016-02-23T17:52:24.57888 HPI_HAM1 [ROBUST_ISOLATED.run] USERMSG: USER CODE ERROR (see log)
2016-02-23T17:52:24.62596 HPI_HAM1 ERROR in state ROBUST_ISOLATED: see log for more info (LOAD to reset)
I've reloaded and restarted both HAM1 and HAM6 and the error returns. It sure looks like it is related to the updates to get the ISI guardian to switch the GS13 gains depending on the state. I can not find documentation (logs) that the HPI nodes have been restarted since the gain switching updates which were intended for the ISI.
I've elected to not attempt any code corrections at this time; I suspect Hugo will correct this easily. Meanwhile, I don't know if the guardian will actually function if it trips. This can be done easily however with the command scripts isolating to level1.
II 1206 FR 4418
Code oversite fixed. Guardian restarted. All HPIs are good. Tested on HAM6, positive function. ISI guardians not restarted--should do next Tuesday to confirm no issues there.
files updated:
hugh.radkins@operator3:~ 0$ userapps
hugh.radkins@operator3:release 0$ cd isi/common/guardian/
hugh.radkins@operator3:guardian 0$ svn up
U isiguardianlib/isolation/const.py
U isiguardianlib/isolation/states.py
U isiguardianlib/damping/states.py
Updated to revision 12715.
Den, Sheila, Evan
~> We tried reverting to the old QPD offsets (the ones we used throughout O1) for the soft loops and the PRM pointing loops. These seemed to make the recycling gain slightly worse, and did not improve the jitter coupling. This indicates that (as we had suspected) these offsets are no longer good to use.
~> We measured the 9 MHz oscillator phase noise coupling into DARM. This had been done previously (19911), but with a suspicious calibration and in a way that also drove the 45 MHz phase. This time, we used the OCXO to drive both the harmonic generator (bypassing the 9 MHz distribution amplifier) and to serve as a reference for an IFR/OCXO PLL with a >40 kHz bandwidth. The IFR is used to drive the 9 MHz distribution amplifier. The error point of the PLL was offset in order to maintain the relative time delay of the 9 MHz and 45 MHz signals. When we relocked, we found that the 18 MHz and 27 MHz signals had flipped sign, but otherwise the interferometer locked normally. However, there was a great excess of 45 MHz noise in DARM (worse even than before we installed the 9 MHz bandpass). Nevertheless, we were able to drive enough to see the effect of 9 MHz phase modulation in DARM. The coupling is roughly 2–4×10⁻⁶ mA/Hz above 100 Hz.
Also, twice last night (while locked on the IFR) we were battling a 900 Hz line in DARM that increased over the duration of the lock, and eventually caused EY to saturate.
We suspected PI, but this line was also present at 900 Hz in the DCPD IOP channels. So it is not folding around the 8 kHz Nyquist of the digital downsampling.
This line does not appear in the IOP channels for the end station QPDs. (2 W, dc readout)
It's the third harmonic of the beamsplitter violin mode. Den added a stopband filter to the BS M2 length drive, and the line went down.
Unclear why this had not been a problem before.
I have subtracted SRCL coupling from DARM, and found that residual noise has the shape of 1/f4-5 at 15-30Hz. I remember when L2 was in acquire state we could see actuator noise in this frequecy band in DARM. For this reason I decided to look into L2 noise again even though actuators are in the low noise (state 3) during current locks.
All 16 actuators show similar noise levels. Attached plot shows spectra for one of them (ITMX LL) in different states. When there is no control signal, actuator noise in low noise state is a factor of 10 smaller compared to acquire state in the frequency range 10-30Hz. However, if a small (few counts) low frequency excitation is applied, then actuator noise increases by a factor of 10. The noise increases almost by the same level if a large excitation is applied. I decided to check if upconversion happens in DAC, actuator or noise monitor. Control signal was shifted by a DC offset (10000 cnts) and actuator noise has reduced by a factor of 2-3. From this measurement one might conclude that DAC is responsible for extra noise. Also, we run oplev servo on the ITMs and even though control signal is aggressively low passed, actuator noise still increases above 10Hz.
Since L2 actuator noise depends on the low frequency control signal (or DC offset), then actuator noise may or may not be coherent to DARM at 10-30Hz. However, when we looked at DARM spectrum with bandwidth of 1Hz, we saw that noise goes up and down by a factor of 1.5 at 10-30Hz.
We have measured the differential actuator noise in low noise by notching ETMX control signal at 20Hz. Spectrum is 0.1 cnts/sqHz and is consistant with the noise when small low frequency excitation is applied (and a factor of 10 higher compared to the case when no excitation is applied). Total noise from L2 is 1.4e-19 m/sqHz at 10Hz and from L1 is 2.2e-18 m/sqHz at 10Hz. This result is consistant to the previous measurement using pringles technique (Chris alog 21070).
Evan, Kiwamu, Den
We measured L2 actuator noise directly from the coils on ITMX. We did not find any irregular noises, current noise looks normal. We have also measured the noise on each coil end relative to the ground. At 20Hz the noise level is 4uV/sqHz. We drive one of the coils in common relative to the ground with 300uV at 30Hz but did not see any noise in DARM.
Kiwamu, Den
Tonight we have shut down ITMX and ITMY L2 drivers while in low noise to double check that these drivers do not cause extra noise at 15-30Hz. We did not see any change in DARM. We would like to do the same test for ETMs.
